. 2017 Oct 3;7(1):12610.
doi: 10.1038/s41598-017-12765-x.

The free-energy cost of interaction between DNA loops

Affiliations

The free-energy cost of interaction between DNA loops

Lifang Huang et al. Sci Rep. .

Abstract

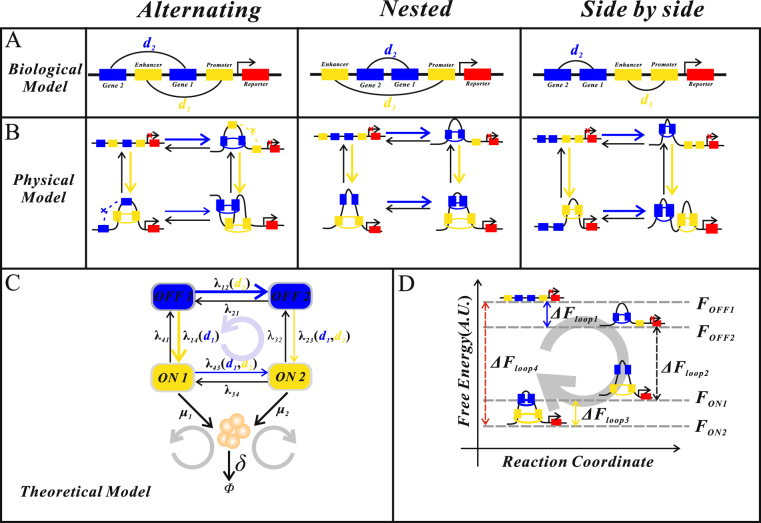
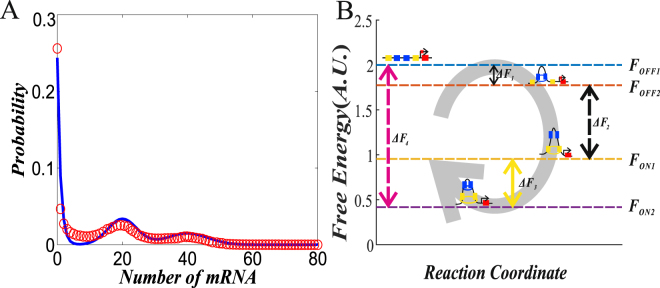
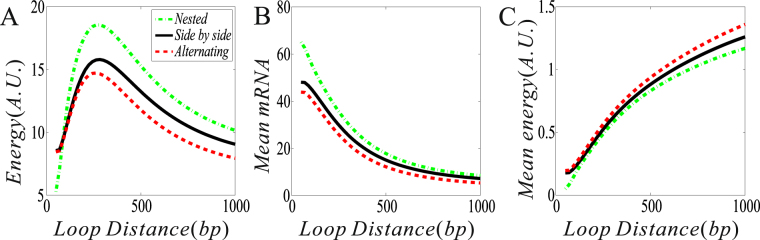
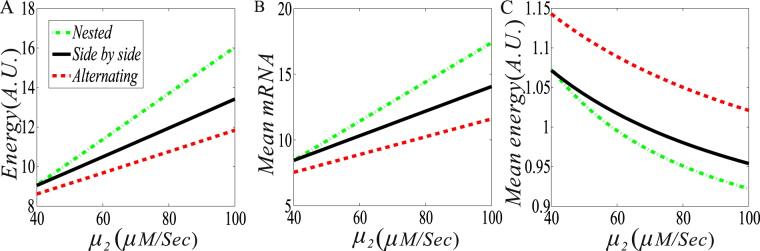
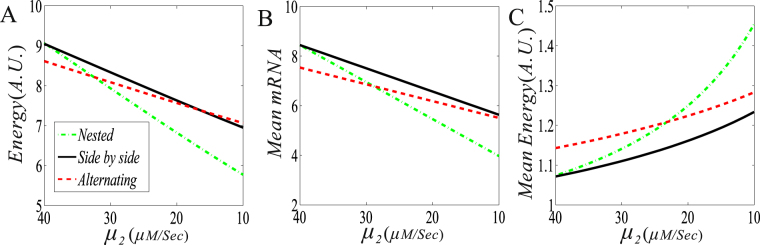
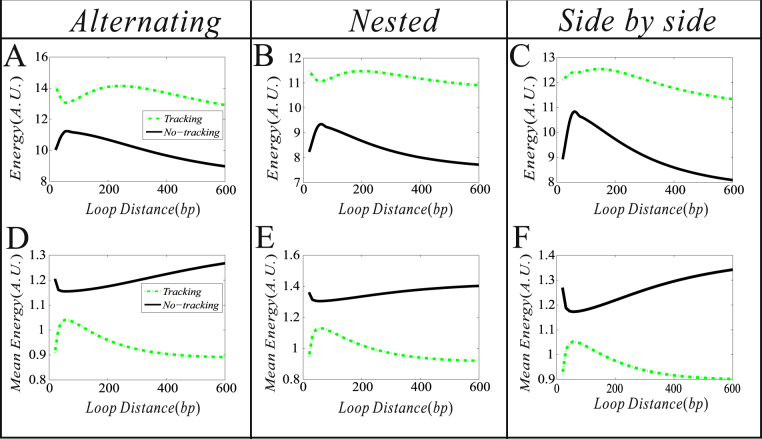
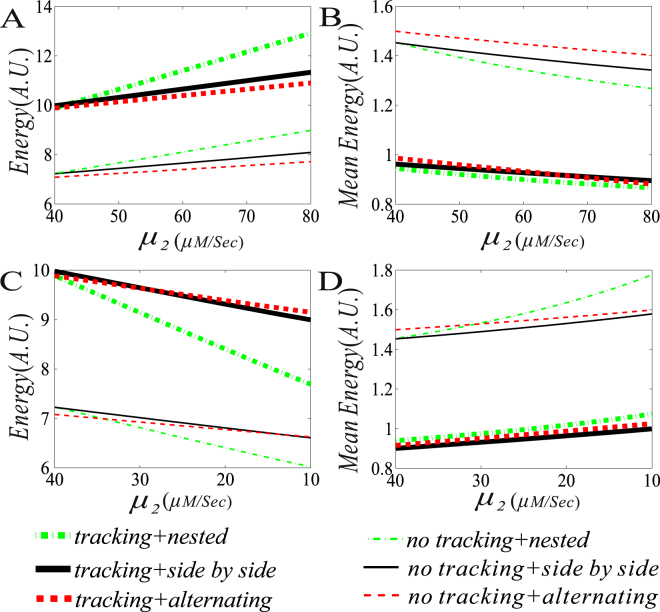
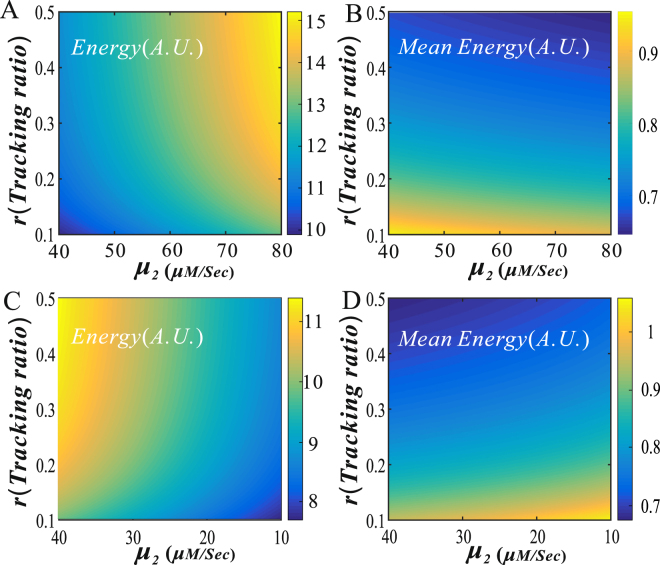
From the viewpoint of thermodynamics, the formation of DNA loops and the interaction between them, which are all non-equilibrium processes, result in the change of free energy, affecting gene expression and further cell-to-cell variability as observed experimentally. However, how these processes dissipate free energy remains largely unclear. Here, by analyzing a mechanic model that maps three fundamental topologies of two interacting DNA loops into a 4-state model of gene transcription, we first show that a longer DNA loop needs more mean free energy consumption. Then, independent of the type of interacting two DNA loops (nested, side-by-side or alternating), the promotion between them always consumes less mean free energy whereas the suppression dissipates more mean free energy. More interestingly, we find that in contrast to the mechanism of direct looping between promoter and enhancer, the facilitated-tracking mechanism dissipates less mean free energy but enhances the mean mRNA expression, justifying the facilitated-tracking hypothesis, a long-standing debate in biology. Based on minimal energy principle, we thus speculate that organisms would utilize the mechanisms of loop-loop promotion and facilitated tracking to survive in complex environments. Our studies provide insights into the understanding of gene expression regulation mechanism from the view of energy consumption.


Conflict of interest statement

The authors declare that they have no competing interests.

Figures

Figure 1
Figure 1
Schematic diagram for two interacting DNA loops. (A) Three fundamental biological structures, where two pairs: Gene1/Gene2 (yellow dock), enhancer/promoter (blue dock), may form two distinct topologies. (B) Physical structures for respective DNA–looping interactions in (A), which consider the possibility of looping. (C) Theoretical model by mapping the physical models into a 4-state model of gene expression, where transition rates between active and inactive states may depend the loop lengths along the DNA lines (called looping rates), and the grey loop with arrow represents free energy flow. (D) Free energy difference between unlooped and looped states.
Figure 2
Figure 2
(A) Comparison probability distributions between analytical (solid line) and numerical (empty circles) results, where parameter values are set as λ12 = 0.4, λ21 = 0.2 λ23 = 0.2 λ32 = 0.3, λ34 = 0.1, λ43 = 0.1, λ41 = 0.5, λ14 = 0.5, μ 1 = 20 μ 2 = 40 and δ = 1. (B) Free energies at 4 states of nested loops structure, where the free energy of the OFF1 state is set as 2 and energy differences between the states (denoted by ΔFi, i=1,2,3,4) are indicated. Parameter values are set as d 1 = 500, d 2 = 300 and λ12 = λ32 = λ34 = λ41 = 0.3.
Figure 3
Figure 3
The effect of a DNA loop length on the free energy dissipation rate (energy) (no unit), the mRNA expression level, and the free energy dissipation rate(mean energy) (no unit). Where parameter values in all the cases are set μ1 = 40, μ2 = 80, δ = 1, γ = 0, d 2 = 300, λ12 = λ32 = λ34 = λ41 = 0.3, and d 1 ∈ (50, 1000).
Figure 4
Figure 4
The effect of the promotion (i.e., μ1<μ2) of two DNA loops on free energy dissipation and mRNA expression level. (A) The dissipation rate of free energy vs the transcription rate (μ2); (B) The mean mRNA expression level vsμ2; and (C) The mean free energy consumption vs μ2. In all the cases, parameter values are set as μ1=40,μ2(40,100),δ=1,γ=0,d2=300,d1=500, λ12=λ32=λ34=λ41=0.3.
Figure 5
Figure 5
The effect of the suppression (i.e., μ1>μ2) of two DNA loops on free energy dissipation and mRNA expression level. (A) The dissipation rate of free energy vs the transcription rate (μ2); (B) The mean mRNA expression level vs μ2; and (C) The mean free energy consumption vs μ2. In all the cases, except for μ2(10,40), other parameter values are set as the same as in Fig. 4.
Figure 6
Figure 6
The dependences of energy dissipation rate and the mean energy dissipation rate on the length of the blue loop. Dashed lines corresponding to the facilitated-tracking model (γ0) whereas solid lines to the directing looping model (γ=0). In all the cases, parameter values are set as μ1=40,μ2=80,δ=1,γ=0.1,d2(10,600),d1=1000, λ12=λ32=λ34=λ41=0.3.
Figure 7
Figure 7
Comparison between the results for tracking and those for no tracking. (A) and (B), the free energy consumption rate/mean free energy consumption rate vs the transcription rate μ2, where the blue DNA loop is assumed to enhance the expression of the yellow DNA loop, μ1=40, and μ2(40,80); (C) and (D), the free energy consumption rate/mean free energy consumption rate vs the transcription rate μ2, where the blue DNA loop is assumed to repress the expression of the yellow DNA loop, μ1=40, and μ2(10,40). In all the cases, the other parameter values are set as δ=1,γ=0.1,d2=600,d1=1000, andλ12=λ32=λ34=λ41=0.3.
Figure 8
Figure 8
Three–dimensional pseudo diagrams for dependences of free energy dissipation rate/the mean free energy dissipation rate on both the transcriptional rate and the tracking ratio. (A) and (B) the blue loop promotes the transcription rate of the yellow loop, where parameters are set as μ1=40, μ2(40,80), δ=1,γ(0.1,0.5),d2=600,d1=1000, λ12=λ32=λ34=λ41=0.3, k1=40e0.05d1+1,k2=4, (C) and (D) the blue loop suppresses the transcription rate of the yellow loop, except for μ2(10,40), other parameter values are set as the same as in (A).

Similar articles

References

    1. Ptashne M. Gene regulation by proteins acting nearby and at a distance. Nature. 1986;322:697–701. doi: 10.1038/322697a0. - DOI - PubMed
    1. Whalen S, Truty RM, Pollard KS. Enhancer-promoter interactions are encoded by complex genomic signatures on looping chromatin. Nat. Genet. 2016;48:488–496. doi: 10.1038/ng.3539. - DOI - PMC - PubMed
    1. Grossman SR, et al. Systematic dissection of genomic features determining transcription factor binding and enhancer function. Proc. Natl. Acad. Sci. USA. 2017;114:E1291–E1300. doi: 10.1073/pnas.1621150114. - DOI - PMC - PubMed
    1. Dao LTM, et al. Genome-wide characterization of mammalian promoters with distal enhancer functions. Nat. Genet. 2017;49:1073–1081. doi: 10.1038/ng.3884. - DOI - PubMed
    1. Krivega I, Dean A. Enhancer and promoter interactions-long distance calls. Curr. Opin. Genet. Dev. 2012;22:79–85. doi: 10.1016/j.gde.2011.11.001. - DOI - PMC - PubMed

Publication types

LinkOut - more resources