Beyond detoxification: a role for mouse mEH in the hepatic metabolism of endogenous lipids
- PMID: 28975360
- PMCID: PMC5696502
- DOI: 10.1007/s00204-017-2060-4
Beyond detoxification: a role for mouse mEH in the hepatic metabolism of endogenous lipids
Abstract
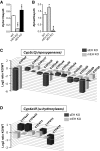
Microsomal and soluble epoxide hydrolase (mEH and sEH) fulfill apparently distinct roles: Whereas mEH detoxifies xenobiotics, sEH hydrolyzes fatty acid (FA) signaling molecules and is thus implicated in a variety of physiological functions. These epoxy FAs comprise epoxyeicosatrienoic acids (EETs) and epoxy-octadecenoic acids (EpOMEs), which are formed by CYP epoxygenases from arachidonic acid (AA) and linoleic acid, respectively, and then are hydrolyzed to their respective diols, the so-called DHETs and DiHOMEs. Although EETs and EpOMEs are also substrates for mEH, its role in lipid signaling is considered minor due to lower abundance and activity relative to sEH. Surprisingly, we found that in plasma from mEH KO mice, hydrolysis rates for 8,9-EET and 9,10-EpOME were reduced by 50% compared to WT plasma. This strongly suggests that mEH contributes substantially to the turnover of these FA epoxides-despite kinetic parameters being in favor of sEH. Given the crucial role of liver in controlling plasma diol levels, we next studied the capacity of sEH and mEH KO liver microsomes to synthesize DHETs with varying concentrations of AA (1-30 μM) and NADPH. mEH-generated DHET levels were similar to the ones generated by sEH, when AA concentrations were low (1 μM) or epoxygenase activity was curbed by modulating NADPH. With increasing AA concentrations sEH became more dominant and with 30 μM AA produced twice the level of DHETs compared to mEH. Immunohistochemistry of C57BL/6 liver slices further revealed that mEH expression was more widespread than sEH expression. mEH immunoreactivity was detected in hepatocytes, Kupffer cells, endothelial cells, and bile duct epithelial cells, while sEH immunoreactivity was confined to hepatocytes and bile duct epithelial cells. Finally, transcriptome analysis of WT, mEH KO, and sEH KO liver was carried out to discern transcriptional changes associated with the loss of EH genes along the CYP-epoxygenase-EH axis. We found several prominent dysregulations occurring in a parallel manner in both KO livers: (a) gene expression of Ephx1 (encoding for mEH protein) was increased 1.35-fold in sEH KO, while expression of Ephx2 (encoding for sEH protein) was increased 1.4-fold in mEH KO liver; (b) Cyp2c genes, encoding for the predominant epoxygenases in mouse liver, were mostly dysregulated in the same manner in both sEH and mEH KO mice, showing that loss of either EH has a similar impact. Taken together, mEH appears to play a leading role in the hydrolysis of 8,9-EET and 9,10-EpOME and also contributes to the hydrolysis of other FA epoxides. It probably profits from its high affinity for FA epoxides under non-saturating conditions and its close physical proximity to CYP epoxygenases, and compensates its lower abundance by a more widespread expression, being the only EH present in several sEH-lacking cell types.
Keywords: EET; EpOME; Lipid signaling; Liver; Microsomal epoxide hydrolase.
Conflict of interest statement
This work was supported by the Swiss National Foundation (Grant PDFMP_127330, M.A.).
Figures


Similar articles
-
Distribution of soluble and microsomal epoxide hydrolase in the mouse brain and its contribution to cerebral epoxyeicosatrienoic acid metabolism.Neuroscience. 2009 Oct 6;163(2):646-61. doi: 10.1016/j.neuroscience.2009.06.033. Epub 2009 Jun 18. Neuroscience. 2009. PMID: 19540314
-
Generation and characterization of epoxide hydrolase 3 (EPHX3)-deficient mice.PLoS One. 2017 Apr 6;12(4):e0175348. doi: 10.1371/journal.pone.0175348. eCollection 2017. PLoS One. 2017. PMID: 28384353 Free PMC article.
-
Epoxide hydrolases in the rat epididymis: possible roles in xenobiotic and endogenous fatty acid metabolism.Toxicol Sci. 2004 Apr;78(2):187-95. doi: 10.1093/toxsci/kfh066. Epub 2004 Jan 21. Toxicol Sci. 2004. PMID: 14737000
-
Crosstalk between adenosine receptors and CYP450-derived oxylipins in the modulation of cardiovascular, including coronary reactive hyperemic response.Pharmacol Ther. 2022 Dec;240:108213. doi: 10.1016/j.pharmthera.2022.108213. Epub 2022 May 18. Pharmacol Ther. 2022. PMID: 35597366 Review.
-
Soluble epoxide hydrolase: gene structure, expression and deletion.Gene. 2013 Sep 10;526(2):61-74. doi: 10.1016/j.gene.2013.05.008. Epub 2013 May 20. Gene. 2013. PMID: 23701967 Free PMC article. Review.
Cited by
-
Tissue-, Region-, and Gene-Specific Induction of Microsomal Epoxide Hydrolase Expression and Activity in the Mouse Intestine by Arsenic in Drinking Water.Drug Metab Dispos. 2024 Jun 17;52(7):681-689. doi: 10.1124/dmd.124.001720. Drug Metab Dispos. 2024. PMID: 38719743 Free PMC article.
-
Inhibition of Soluble Epoxide Hydrolase Does Not Promote or Aggravate Pulmonary Hypertension in Rats.Cells. 2023 Feb 20;12(4):665. doi: 10.3390/cells12040665. Cells. 2023. PMID: 36831332 Free PMC article.
-
Adaptation and evolution of the sea anemone Alvinactis sp. to deep-sea hydrothermal vents: A comparison using transcriptomes.Ecol Evol. 2022 Sep 20;12(9):e9309. doi: 10.1002/ece3.9309. eCollection 2022 Sep. Ecol Evol. 2022. PMID: 36188500 Free PMC article.
-
Deletion of microsomal epoxide hydrolase gene leads to increased density in cerebral vasculature and enhances cerebral blood flow in mice.J Cereb Blood Flow Metab. 2025 Apr 12:271678X251333234. doi: 10.1177/0271678X251333234. Online ahead of print. J Cereb Blood Flow Metab. 2025. PMID: 40219924 Free PMC article.
-
Epoxide hydrolase 1 (EPHX1) hydrolyzes epoxyeicosanoids and impairs cardiac recovery after ischemia.J Biol Chem. 2018 Mar 2;293(9):3281-3292. doi: 10.1074/jbc.RA117.000298. Epub 2018 Jan 3. J Biol Chem. 2018. PMID: 29298899 Free PMC article.
References
-
- Arand M, Marowsky A. Microsomal epoxide hydrolase is not a 2-arachidonyl glycerol hydrolase. Matters. 2016
MeSH terms
Substances
Grants and funding
LinkOut - more resources
Full Text Sources
Other Literature Sources
Research Materials
Miscellaneous

