

Detecting small-study effects and funnel plot asymmetry in meta-analysis of survival data: A comparison of new and existing tests
- PMID: 28975717
- PMCID: PMC5873397
- DOI: 10.1002/jrsm.1266
Detecting small-study effects and funnel plot asymmetry in meta-analysis of survival data: A comparison of new and existing tests
Abstract
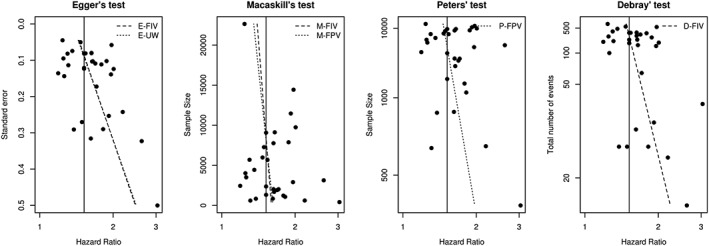
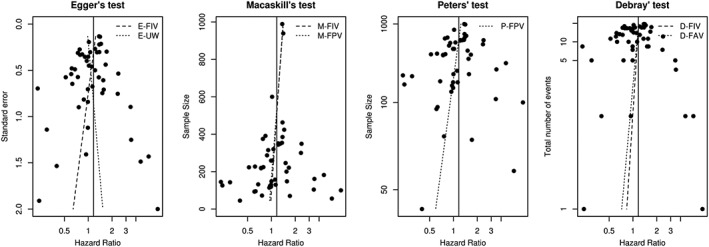
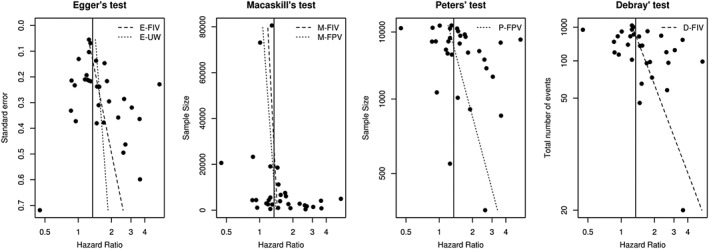
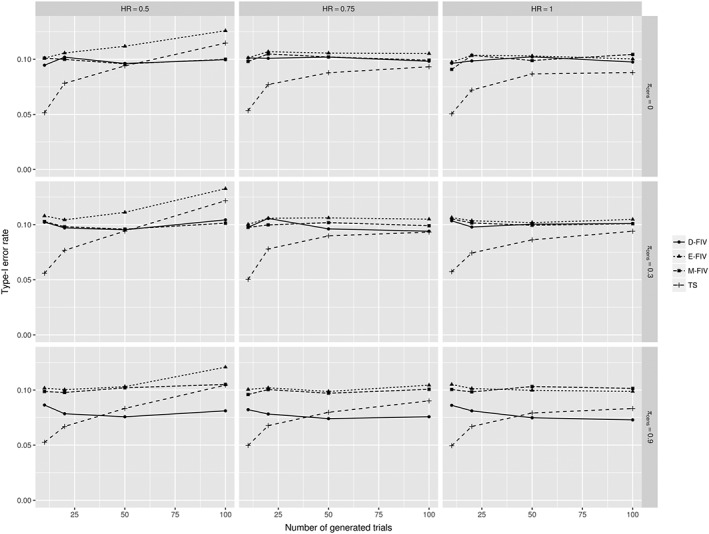
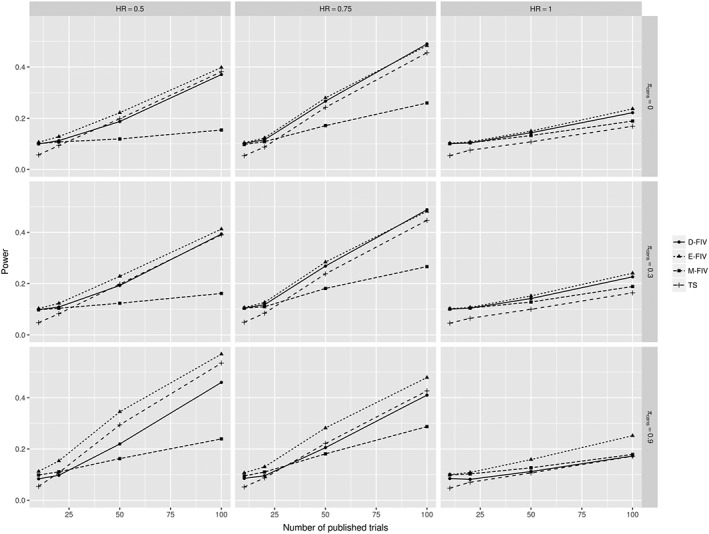
Small-study effects are a common threat in systematic reviews and may indicate publication bias. Their existence is often verified by visual inspection of the funnel plot. Formal tests to assess the presence of funnel plot asymmetry typically estimate the association between the reported effect size and their standard error, the total sample size, or the inverse of the total sample size. In this paper, we demonstrate that the application of these tests may be less appropriate in meta-analysis of survival data, where censoring influences statistical significance of the hazard ratio. We subsequently propose 2 new tests that are based on the total number of observed events and adopt a multiplicative variance component. We compare the performance of the various funnel plot asymmetry tests in an extensive simulation study where we varied the true hazard ratio (0.5 to 1), the number of published trials (N=10 to 100), the degree of censoring within trials (0% to 90%), and the mechanism leading to participant dropout (noninformative versus informative). Results demonstrate that previous well-known tests for detecting funnel plot asymmetry suffer from low power or excessive type-I error rates in meta-analysis of survival data, particularly when trials are affected by participant dropout. Because our novel test (adopting estimates of the asymptotic precision as study weights) yields reasonable power and maintains appropriate type-I error rates, we recommend its use to evaluate funnel plot asymmetry in meta-analysis of survival data. The use of funnel plot asymmetry tests should, however, be avoided when there are few trials available for any meta-analysis.
Keywords: RCT; funnel plot; meta-analysis; publication bias; small-study effects; survival.
© 2017 The Authors. Research Synthesis Methods Published by John Wiley & Sons, Ltd.
Figures
Similar articles
-
Funnel plots may show asymmetry in the absence of publication bias with continuous outcomes dependent on baseline risk: presentation of a new publication bias test.Res Synth Methods. 2020 Jul;11(4):522-534. doi: 10.1002/jrsm.1414. Epub 2020 May 6. Res Synth Methods. 2020. PMID: 32362052
-
Graphical augmentations to sample-size-based funnel plot in meta-analysis.Res Synth Methods. 2019 Sep;10(3):376-388. doi: 10.1002/jrsm.1340. Epub 2019 Feb 7. Res Synth Methods. 2019. PMID: 30664834 Free PMC article.
-
Quantifying the risk of error when interpreting funnel plots.Syst Rev. 2015 Mar 11;4:24. doi: 10.1186/s13643-015-0004-8. Syst Rev. 2015. PMID: 25875027 Free PMC article.
-
Exploring and accounting for publication bias in mental health: a brief overview of methods.Evid Based Ment Health. 2014 Feb;17(1):11-5. doi: 10.1136/eb-2013-101700. Evid Based Ment Health. 2014. PMID: 24477532 Review.
-
Subgroup analyses in randomised controlled trials: quantifying the risks of false-positives and false-negatives.Health Technol Assess. 2001;5(33):1-56. doi: 10.3310/hta5330. Health Technol Assess. 2001. PMID: 11701102 Review.
Cited by
-
Comparison of clinical profiles between takotsubo syndrome and acute coronary syndrome: a systematic review and meta-analysis.Heart Fail Rev. 2020 Sep;25(5):847-860. doi: 10.1007/s10741-019-09846-6. Heart Fail Rev. 2020. PMID: 31446536
-
TP53 oncogenic variants as prognostic factors in individuals with glioblastoma: a systematic review and meta-analysis.Front Neurol. 2024 Dec 18;15:1490246. doi: 10.3389/fneur.2024.1490246. eCollection 2024. Front Neurol. 2024. PMID: 39744115 Free PMC article.
-
Renal effects and safety of tirzepatide in subjects with and without diabetes: A systematic review and meta-analysis.World J Diabetes. 2025 Feb 15;16(2):101282. doi: 10.4239/wjd.v16.i2.101282. World J Diabetes. 2025. PMID: 39959269 Free PMC article.
-
The effectiveness of metabolic resistance training versus traditional cardio on athletic performance: a systematic review and meta-analysis.Front Physiol. 2025 Mar 20;16:1551645. doi: 10.3389/fphys.2025.1551645. eCollection 2025. Front Physiol. 2025. PMID: 40182689 Free PMC article.
-
Housing and Support Intervention and Mortality Among Homeless Adults With Mental Illnesses: A Secondary Analysis of a Randomized Clinical Trial.JAMA Netw Open. 2025 Jul 1;8(7):e2524302. doi: 10.1001/jamanetworkopen.2025.24302. JAMA Netw Open. 2025. PMID: 40742585 Free PMC article. Clinical Trial.
References
-
- Rothstein H, Sutton AJ, Borenstein M. (Eds.) Chapter 10. Publication Bias in Meta‐Analysis: Prevention, Assessment and Adjustments. Chichester, England; Hoboken, NJ: Wiley; 2005.
-
- Ioannidis JP, Contopoulos‐Ioannidis DG, Lau J. Recursive Cumulative Meta‐analysis: a diagnostic for the evolution of total randomized evidence from group and individual patient data. J Clin Epidemiol. 1999;52:281‐291. - PubMed
-
- Sterne JAC, Harbord RM. Funnel plots in meta‐analysis. The Stat J. 2004;4:127‐141.
-
- Sterne JAC, Sutton AJ, Ioannidis JP, et al. Recommendations for examining and interpreting funnel plot asymmetry in meta‐analyses of randomised controlled trials. BMJ. 2011;343:d4002. - PubMed
-
- Deeks JJ, Higgins JPT, Altman DG. Chapter 9: Analysing data and undertaking meta‐analyses In: Higgins JP, Green S, eds. Cochrane Handbook for Systematic Reviews of Interventions. 5.1.0, Vol. 9: Cochrane; 2011. www.handbook.cochrane.org.
MeSH terms
Substances
LinkOut - more resources
Full Text Sources
Other Literature Sources
