. 2017 Oct 12;550(7675):270-274.
doi: 10.1038/nature24037. Epub 2017 Oct 4.

Cancer drug addiction is relayed by an ERK2-dependent phenotype switch

Affiliations

Cancer drug addiction is relayed by an ERK2-dependent phenotype switch

Xiangjun Kong et al. Nature. .

Abstract

Observations from cultured cells, animal models and patients raise the possibility that the dependency of tumours on the therapeutic drugs to which they have acquired resistance represents a vulnerability with potential applications in cancer treatment. However, for this drug addiction trait to become of clinical interest, we must first define the mechanism that underlies it. We performed an unbiased CRISPR-Cas9 knockout screen on melanoma cells that were both resistant and addicted to inhibition of the serine/threonine-protein kinase BRAF, in order to functionally mine their genome for 'addiction genes'. Here we describe a signalling pathway comprising ERK2 kinase and JUNB and FRA1 transcription factors, disruption of which allowed addicted tumour cells to survive on treatment discontinuation. This occurred in both cultured cells and mice and was irrespective of the acquired drug resistance mechanism. In melanoma and lung cancer cells, death induced by drug withdrawal was preceded by a specific ERK2-dependent phenotype switch, alongside transcriptional reprogramming reminiscent of the epithelial-mesenchymal transition. In melanoma cells, this reprogramming caused the shutdown of microphthalmia-associated transcription factor (MITF), a lineage survival oncoprotein; restoring this protein reversed phenotype switching and prevented the lethality associated with drug addiction. In patients with melanoma that had progressed during treatment with a BRAF inhibitor, treatment cessation was followed by increased expression of the receptor tyrosine kinase AXL, which is associated with the phenotype switch. Drug discontinuation synergized with the melanoma chemotherapeutic agent dacarbazine by further suppressing MITF and its prosurvival target, B-cell lymphoma 2 (BCL-2), and by inducing DNA damage in cancer cells. Our results uncover a pathway that underpins drug addiction in cancer cells, which may help to guide the use of alternating therapeutic strategies for enhanced clinical responses in drug-resistant cancers.


Conflict of interest statement

The authors declare no competing financial interests.

Figures

Extended Data Figure 1
Extended Data Figure 1. Drug addiction phenotype in acquired drug resistance melanoma cells
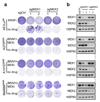
Acquired BRAFi resistant 451LuBR cell were cultured in the presence or absence of 1 μM BRAFi; acquired BRAFi + MEKi resistant A375BMR, A101DBMR and Mel888BMR cells were cultured in the presence or absence of 0.5 μM BRAFi + 0.05 μM MEKi. Photographs were taken after 7 days. The images shown here are representative of three independent biological experiments.
Extended Data Figure 2
Extended Data Figure 2. Generation of a diverse melanoma cell line panel with distinct drug resistance mechanisms
(a) 451Lu and 451LuBR cells were treated with increasing concentrations of the BRAFi dabrafenib (0, 0.01, 0.1, 1 and 10 μM) for 6 hours. Total cell lysates were subjected to immunoblotting with indicated antibodies. ERK1/2 served as a loading control. (b) A375 and A375BMR cells were treated with increasing concentrations of the BRAFi dabrafenib + MEKi trametinib (0 + 0, 0.01 + 0.001, 0.1 + 0.01 and 1 + 0.1 μM) for 6 hours. Total cell lysates were subjected to immunoblotting with indicated antibodies. ERK1/2 served as a loading control. (c) Quantification of BRAF amplification by qPCR on genomic DNA of A375 and A375BMR cells. CRAF was included as a negative control. CT values were normalized to LINE. P-value calculated by unpaired two-sided Student’s t-test; Data in graphs are mean ± s.d. from three technical replicates; Confidence interval 95%. (d) Mel888 and Mel888BMR cells were treated with vehicle or 0.5 μM BRAFi + 0.05 μM MEKi for 6 hours. Total cell lysates were subjected to immunoblotting with indicated antibodies. ERK1/2 served as a loading control. For gel source images, see Supplementary Fig. 1. Data in a-d are representative of three independent biological experiments.
Extended Data Figure 3
Extended Data Figure 3. Disruption of MEK1 rescues drug addiction phenotype in 451LuBR cell
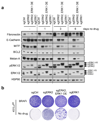
(a) 451LuBR, A375BMR, A101DBMR and Mel888BMR cells were infected with lentivirus expressing sgRNAs targeting either genes encoding MEK1 (sgMEK1), MEK2 (sgMEK2) or a scrambled sequence (sgCtrl). Cells were seeded in the presence or absence of MAPK inhibitors, and fixed, stained and photographed after 14 days (BRAFi or BRAFi + MEKi group) or 21 days (no drug group). (b) Cell lysates from (a) were subjected to immunoblotting using the indicated antibodies. HSP90 served as a loading control. For gel source images, see Supplementary Fig. 1. Data in a and b are representative of three independent biological experiments.
Extended Data Figure 4
Extended Data Figure 4. ERK rebound contributes to drug holiday lethality irrespective of drug resistance mechanism
(a) Four parental sensitive cell lines were cultured without MAPK inhibitors and their drug-resistant counterparts were cultured either in the presence (-) or absence of MAPK inhibitors for the indicated number of days. Total cell lysates were subjected to immunoblotting with indicated antibodies. HSP90 served as a loading control. (b) 451LuBR cells were cultured in the presence of either 1 μM BRAFi, a high concentration (5 μM) of ERKi, a low concentration (0.05 μM) of ERKi, or with vehicle control (no drug). A375BMR, A101DBMR and Mel888BMR cells were cultured with either 0.5 μM BRAFi + 0.05 μM MEKi, 5 μM ERKi, 0.05 μM ERKi or with vehicle control (no drug). Cells were fixed, stained and photographed after 14 days. For gel source images, see Supplementary Fig. 1. Data in a and bare representative of two independent biological experiments.
Extended Data Figure 5
Extended Data Figure 5. Drug addiction is relayed by an MITF-dependent phenotype switch
(a) A375BMR cells were cultured in the absence of 0.5 μM BRAFi + 0.05 μM MEKi for 0, 6, 24 and 48 hours and 451LuBR cells were cultured in the absence of 1 μM BRAFi for 0, 1, 3 and 5 days. Total RNA was isolated and subjected to sequencing analysis. Unsupervised clustering of the 200 most variably expressed genes is represented for the first (0 hours / days) and last time points (48 hours / 5 days) in a heat map. (b) Sequence data in (a; all time points) were subjected to gene set enrichment analysis to determine the correlation of the indicated gene sets with the drug addiction effect in A375BMR and 451LuBR cells. For p-value calculation, see Methods. (c) 451LuBR and A101DBMR cells were infected with lentivirus encoding sgRNAs targeting genes encoding cJUN (sgJUN) or a scrambled sequence (sgCtrl). Cells were seeded in the presence or absence of MAPK inhibitors, and fixed, stained and photographed after 14 days (BRAFi or BRAFi+MEKi group) or 21 days (no drug group). (d) Total cell lysates of the samples in (c) were subjected to immunoblotting analysis with indicated antibodies. HSP90 served as a loading control. (e) 451LuBR and A101DBMR cells were cultured in the presence or absence of the MAPK inhibitors for 24 hours and then subjected to a transwell migration assay. The cells that migrated through the membrane were fixed, stained and photographed after 8 (A101DBMR) or 24 (451LuBR) hours. (f) Quantification of the migration capacity (e) from three representative images from each sample; P-value calculated by unpaired two-sided Student’s t-test; Data in graphs are mean ± s.d. For gel source images, see Supplementary Fig. 1. Data in c, d and e are representative of two independent biological experiments.
Extended Data Figure 6
Extended Data Figure 6. Phenotype switch is not observed in non drug-addicted cells upon drug withdrawal
(a) D10BMR cells were cultured with either 1 μM BRAFi + 0.1 μM MEKi, 0.5 μM BRAFi + 0.05 μM MEKi or with vehicle control (no drug); SK-Mel-28BR were cultured with either 3 μM BRAFi dabrafenib, 1 μM dabrafenib or with vehicle control (no drug); Mel888PLXR and A375PLXR were cultured with either 3 μM BRAFi PLX4720, 1 μM PLX4720 or with vehicle control (no drug); Cells were fixed, stained and photographed after 10 days. (b) Total cell lysates of the samples in (a) at day 3 were subjected to immunoblotting analysis with indicated antibodies. HSP90 served as a loading control. For gel source images, see Supplementary Fig. 1. Data in a and b are representative of two independent biological experiments.
Extended Data Figure 7
Extended Data Figure 7. ERK2 and JUNB act in an MITF-dependent genetic phenotype switching program controlling drug addiction
(a) Mel888BMR cells were infected with lentivirus harboring control scramble sgRNA (sgCtrl), JUNB sgRNA (sgJUNB) or ERK2 sgRNA (sgERK2). Cells were cultured in the presence or absence of 0.5 μM BRAFi + 0.05 μM MEKi for 5 days. Total RNA was isolated and subjected to sequencing analysis. Unsupervised clustering of the 200 most variably expressed genes are represented in a heat map. (b) Genes involved in phenotype switching were selected from the sequence data in (a) and are represented in a heat map. (c) Sequence data in (a) were subjected to gene set enrichment analysis to determine the correlation of the indicated gene sets with the extent of rescue of the drug addiction phenotype by sgJUNB and sgERK2 in Mel888BMR cells. dw, drug withdrawal. For p-value calculation, see Methods.
Extended Data Figure 8
Extended Data Figure 8. Pharmacologic ERK inhibition blocks phenotype switch in drug-addicted cells upon drug withdrawal
(a) Mel888BMR, A101DBMR and A375BMR cells were cultured with either 0.5 μM BRAFi + 0.05 μM MEKi, vehicle or 0.05 μM ERKi, 451LuBR cells were cultured with either 1 μM BRAFi, vehicle or 0.05 μM ERKi for 3 days. Total cell lysates were subjected to immunoblotting with indicated antibodies. HSP90 served as a loading control. (b) Photographs were taken from cells in (a) at day 3. (c) Mel888 MEK1T55delinsRT and A375 MEK1T55delinsRT cells were culture in the presence of either 0.3 μM BRAFi, low concentration (0.05 μM) of ERKi or vehicle control (no drug). Cells were fixed, stained and photographed after 10 days. (d) Total cell lysates from cells in (c) at day 5 were subjected to immunoblotting with indicated antibodies. HSP90 served as a loading control. (e) HCC827CLR cells were cultured in the presence of either 1 μM EGFR TKI CL-387,785, a high concentration (5 μM) of ERKi, a low concentration (0.5 μM) of ERKi, or with vehicle control (no drug). Cells were fixed, stained and photographed after 14 days. For gel source images, see Supplementary Fig. 1. Data in a-e are representative of three independent biological experiments.
Extended Data Figure 9
Extended Data Figure 9. ERK2 and ERK1 have distinct functions in drug addiction
(a) 451LuBR control cells (sgCtrl), ERK2 knockout cell (sgERK2), ERK1 (v5-tagged)-overexpressing sgERK2 cells (sgERK2, ERK1 OE) and ERK1 knockout cells (sgERK1) were cultured in the presence or absence of 1 μM BRAFi for up to 6 d. Total cell lysates were subjected to immunoblotting analysis with indicated antibodies. HSP90 served as a loading control. (b) Cells described in (a) were cultured in the presence or absence of BRAFi, and fixed, stained and photographed after 14 days (BRAFi group) or 21 days (no drug group). For gel source images, see Supplementary Fig. 1. Data in a and b are representative of two independent biological experiments.
Extended Data Figure 10
Extended Data Figure 10. Dynamic phenotype of drug resistance and drug addiction in melanoma
(a) Schematic flow chart indicating drug withdrawal resistant cells were generated from drug-addicted cells with long-term drug withdrawal. (b) Parental (A375, 451Lu and A101D) cells, acquired drug resistant (A375BMR, 451LuBR and A101DBMR) and spontaneous developed drug withdrawal-resistant (A375WR, 451LuWR and A101DWR) cells were cultured with either MAPKi or vehicle. Cells were fixed, stained and photographed after 14 days. (c) Total cell lysates from cells in (b) were subjected to immunoblotting with pERK and ERK antibodies after 6 hours of treatment. For gel source images, see Supplementary Fig. 1. Data in b and c are representative of three independent biological experiments.
Figure 1
Figure 1. Genome-wide CRISPR-Cas9 knockout screen to break cancer drug addiction identifies several signaling pathway components
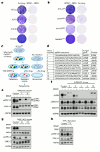
a, BRAF mutant melanoma cells treated with 1 μM dabrafenib (451Lu) or 0.5 μM dabrafenib + 0.05 μM trametinib (A375, A101D and Mel888) and stained 10 d later. b, BRAFi-resistant 451LuBR cells were cultured with or without 1 μM dabrafenib; BRAFi + MEKi-resistant A375BMR, A101DBMR and Mel888BMR cells with or without 0.5 μM dabrafenib + 0.05 μM trametinib and stained after 2 (treated) or 3 wks (untreated). c-d, Screen outline and hits for which the same target gene was found in more than 2 independent screen clones. e-h, Control cells and screen clones as indicated, following dabrafenib or no treatment, were analyzed by immunoblotting. KO, knockout. For gel source images, see Supplementary Fig. 1. Data in a, b, e, f, g and h are representative of 3 independent biological experiments.
Figure 2
Figure 2. Conserved drug addiction pathway despite different therapy resistance mechanisms
a, MEK1 exon 2 sequence of 451Lu and 451LuBR cells. b, Fluorescence In Situ Hybridization on metaphase spreads of A375 and A375BMR cells using probes for BRAF (red) and a chromosome 7 centromeric region (green). c, RT-PCR on cDNA from Mel888 and Mel888BMR cells using BRAF exon 18 forward and exon 10 reverse primers. A BRAF exon 9-10 amplification serves as a control. d, A101D and A101DBMR cells were treated with increasing concentrations of dabrafenib + trametinib (0 + 0, 0.01 + 0.001, 0.1 + 0.01, 1 + 0.1 and 10 + 1 μM) and immunoblotted. e-j, A melanoma cell line panel was infected with lentivirus expressing sgRNAs targeting the indicated genes or a control sgRNA. Cells were cultured with or without drugs and stained (e, g, i) or immunoblotted (f, h, j). k, A375BMR cells ablated for the indicated genes were s.c. injected into both flanks of immune-deficient NSG mice. Mice (n=5/group) received 30 mg/kg dabrafenib and 0.3 mg/kg trametinib from the first day of tumor injection onwards. After 7 days, treatment was discontinued for all mice. The graph represents fold change in tumor volume normalized on the volume on the day of treatment discontinuation. Data in graphs are mean ± s.e.m. ***, p<0.001 by unpaired two-sided Student’s t-test. For tumor volume measurements, see Supplementary table 3. For gel source images, see Supplementary Fig. 1. Data in b-j are representative of three independent biological experiments.
Figure 3
Figure 3. ERK2 and JUNB act in an MITF-dependent genetic phenotype switch controlling drug addiction
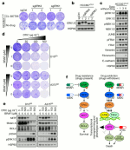
a, A375BMR cells were cultured with or without 0.5 μM dabrafenib + 0.05 μM trametinib for 0, 6, 24 and 48 h, 451LuBR cells with or without 1 μM dabrafenib for 0, 1, 3 and 5 d, and analyzed for RNA expression. Phenotype switch genes were selected from the sequence data and the t0 and the last time points are represented in a heat map. b, Sequence data from a (all time points) were subjected to Gene Set Enrichment Analysis. For p-value calculation, see Methods. c, Drug-addicted melanoma cell line panel was cultured with or without MAPK inhibitors for the indicated amount of time and immunoblotted. d, AXL immunostaining of a sample cohort of BRAFi-resistant patients on (n=17) or off (n=10) treatment. Samples in the “off drug” group were taken at a maximum of 3 months after drug discontinuation. Indicated in grey are 2 patients who had already received a first cycle of ipilimumab at the time of biopsy; the other patients did not receive any treatment at time of biopsy. Data in graphs are mean ± s.d.; P-value calculated by two-sided Mann–Whitney test; Confidence interval 95%. e-f, Cells expressing empty vector or MITF cDNA were cultured with or without inhibitors for 5 d and immunoblotted (e) or stained 2-3 wks later (f). g-h, 451LuBR cells ablated for the indicated genes were cultured with or without dabrafenib and photographed (g) or immunoblotted (h) 3d later. i, Tumors from 2k were immunostained 18 d after drug discontinuation. Scale bar, 50 μm. For gel source images, see Supplementary Fig. 1. Data in c, e, f, g and h are representative of 3 independent biological experiments.
Figure 4
Figure 4. Conservation of drug addiction mechanism in human lung cancer cells and drug addiction synergizes with melanoma alkylating agent dacarbazine in tumor cell elimination
a-b, HCC827CLR lung cancer cells ablated for the indicated genes were cultured with or without EGFR TKI CL-387,785 and stained 14 d later (a) or immunoblotted (b). c, HCC827CLR cells were cultured with or without CL-387,785 for the indicated amount of time and immunoblotted. d-e, Moderately drug-addicted D10BR and A375BR melanoma cells were cultured in the presence of the indicated concentrations of dabrafenib and dacarbazine (DTIC) and stained 10 d later (d) or immunoblotted (e). For gel source images, see Supplementary Fig. 1. Data in a-e are representative of three independent biological experiments. f, Model for ERK2-dependent phenotype switch driving cancer drug addiction, in the context of drug pressure and resistance (left), and drug withdrawal causing addiction-associated lethality irrespective of drug resistance mechanism (right).

Comment in

References

    1. Suda K, et al. Conversion from the "oncogene addiction" to ‘drug addiction’ by intensive inhibition of the EGFR and MET in lung cancer with activating EGFR mutation. Lung Cancer. 2012;76:292–299. - PubMed
    1. Sun C, et al. Reversible and adaptive resistance to BRAF(V600E) inhibition in melanoma. Nature. 2014;508:118–122. - PubMed
    1. Moriceau G, et al. Tunable-combinatorial mechanisms of acquired resistance limit the efficacy of BRAF/MEK cotargeting but result in melanoma drug addiction. Cancer Cell. 2015;27:240–256. - PMC - PubMed
    1. Thakur Das M, et al. Modelling vemurafenib resistance in melanoma reveals a strategy to forestall drug resistance. Nature. 2013;494:251–255. - PMC - PubMed
    1. Seifert H, et al. Prognostic markers and tumour growth kinetics in melanoma patients progressing on vemurafenib. Melanoma Res. 2016;26:138–144. - PubMed

Publication types

MeSH terms

Substances