. 2017 Oct 19;550(7676):402-406.
doi: 10.1038/nature24050. Epub 2017 Oct 4.

Cytoplasmic chromatin triggers inflammation in senescence and cancer

Affiliations

Cytoplasmic chromatin triggers inflammation in senescence and cancer

Zhixun Dou et al. Nature. .

Abstract

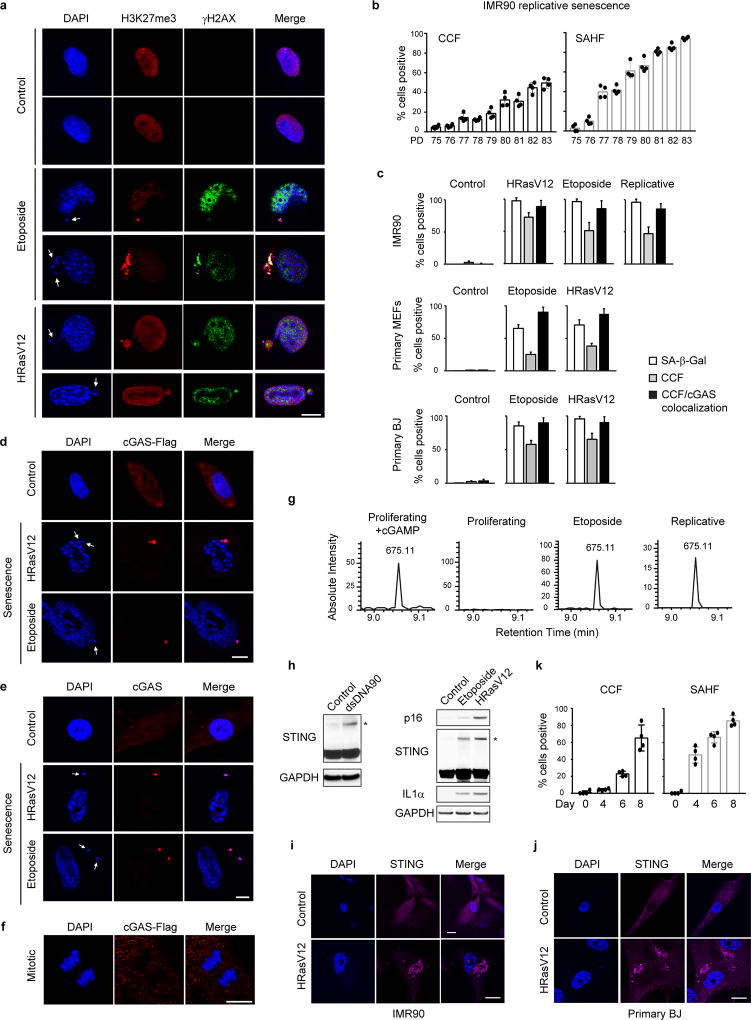
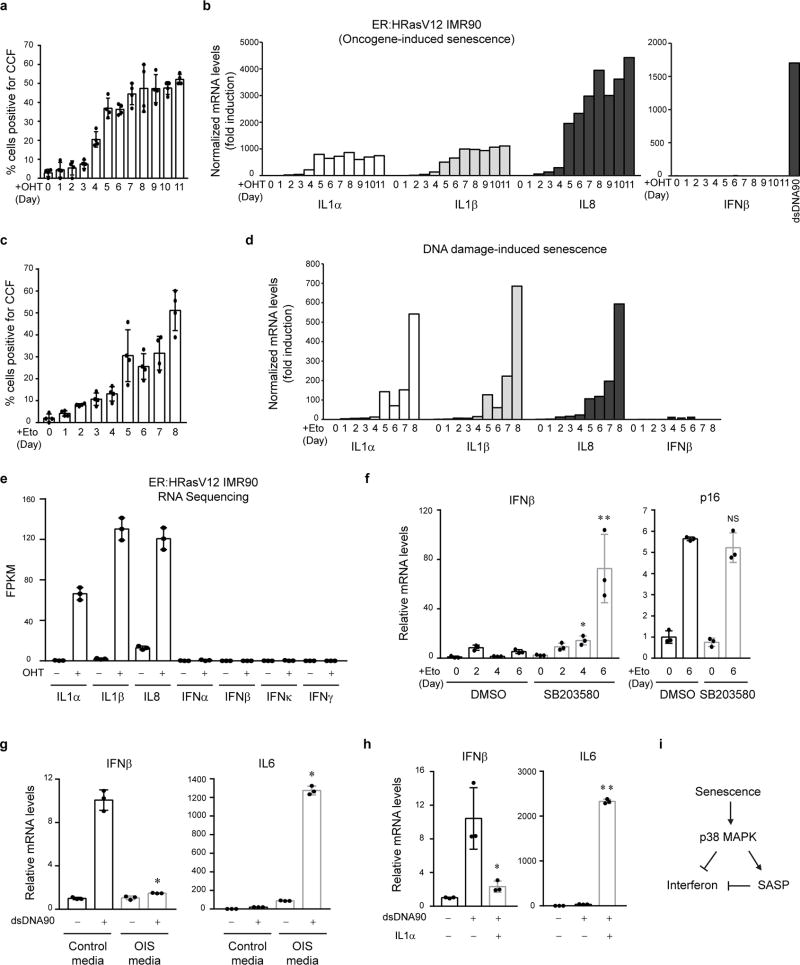
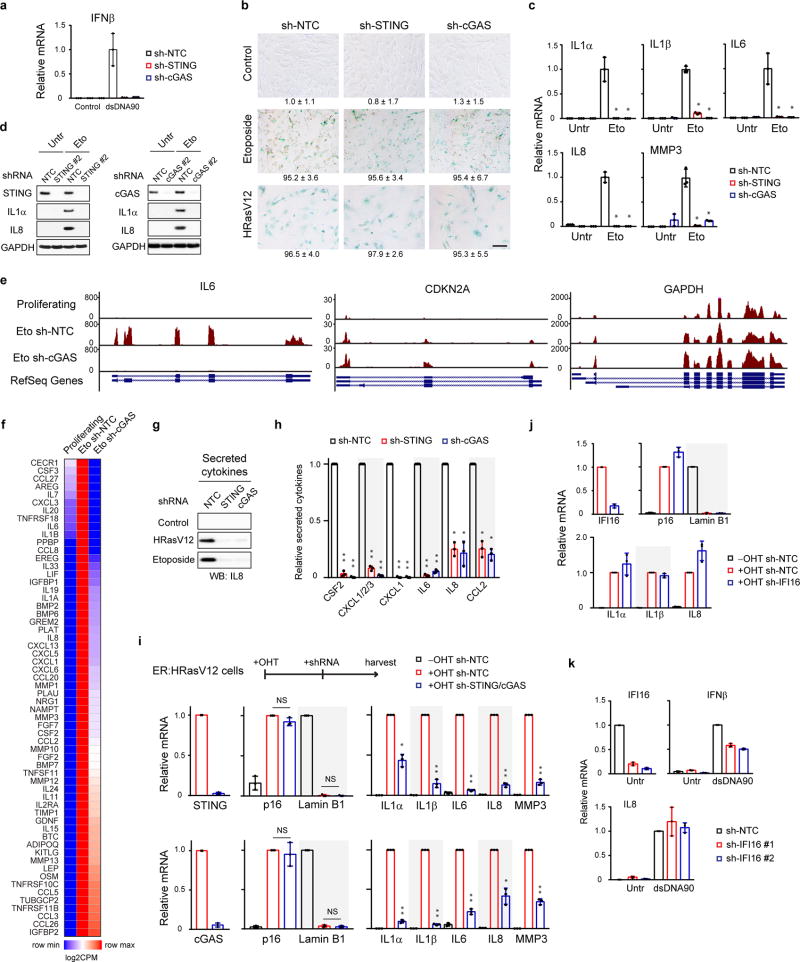
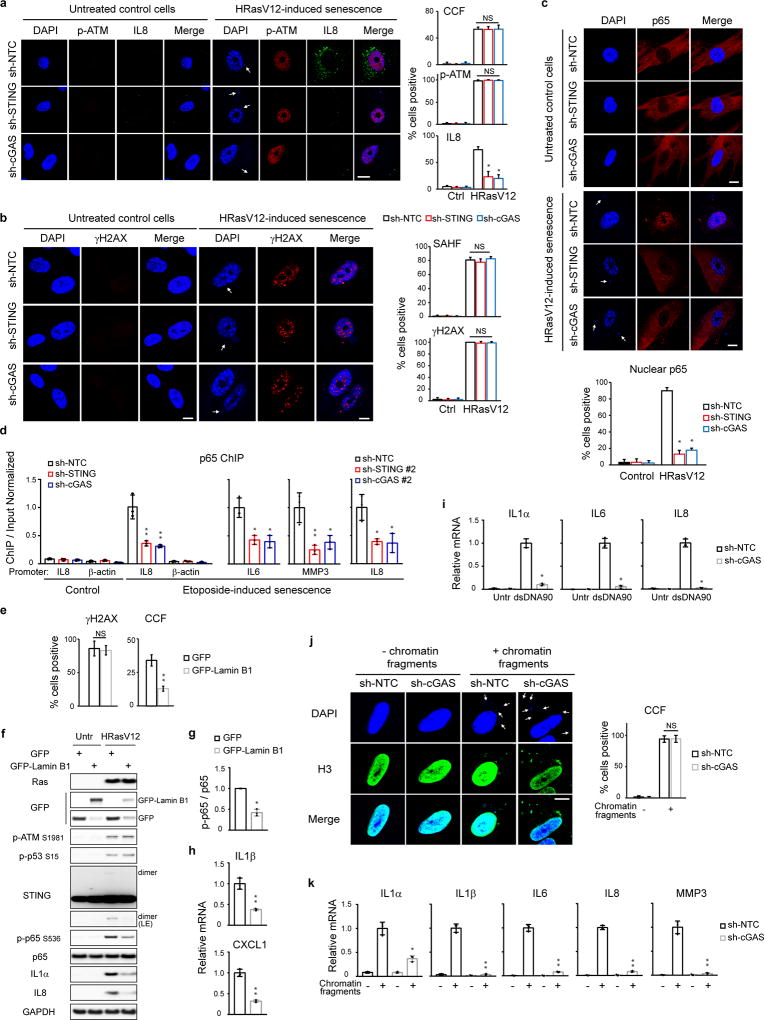
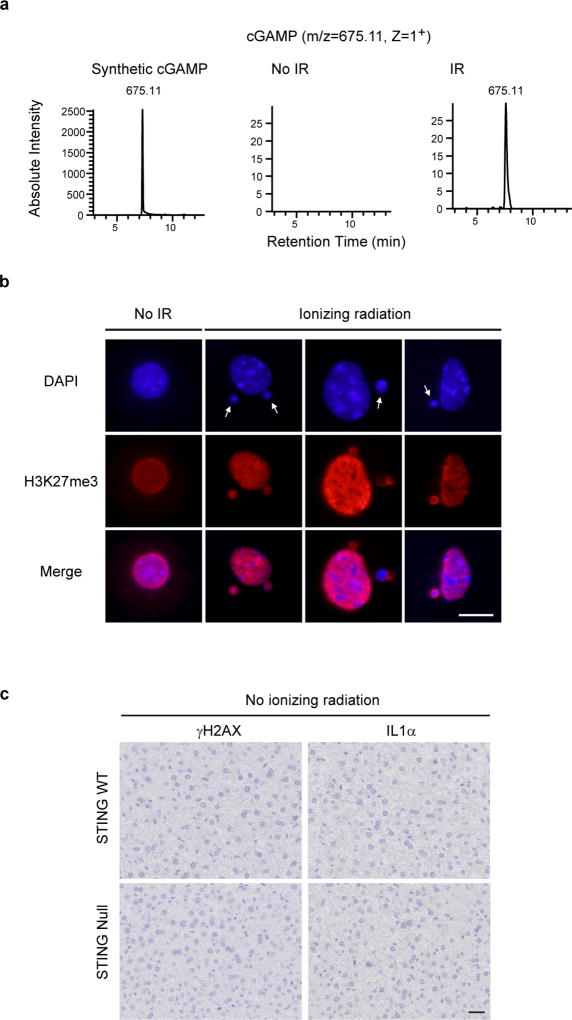
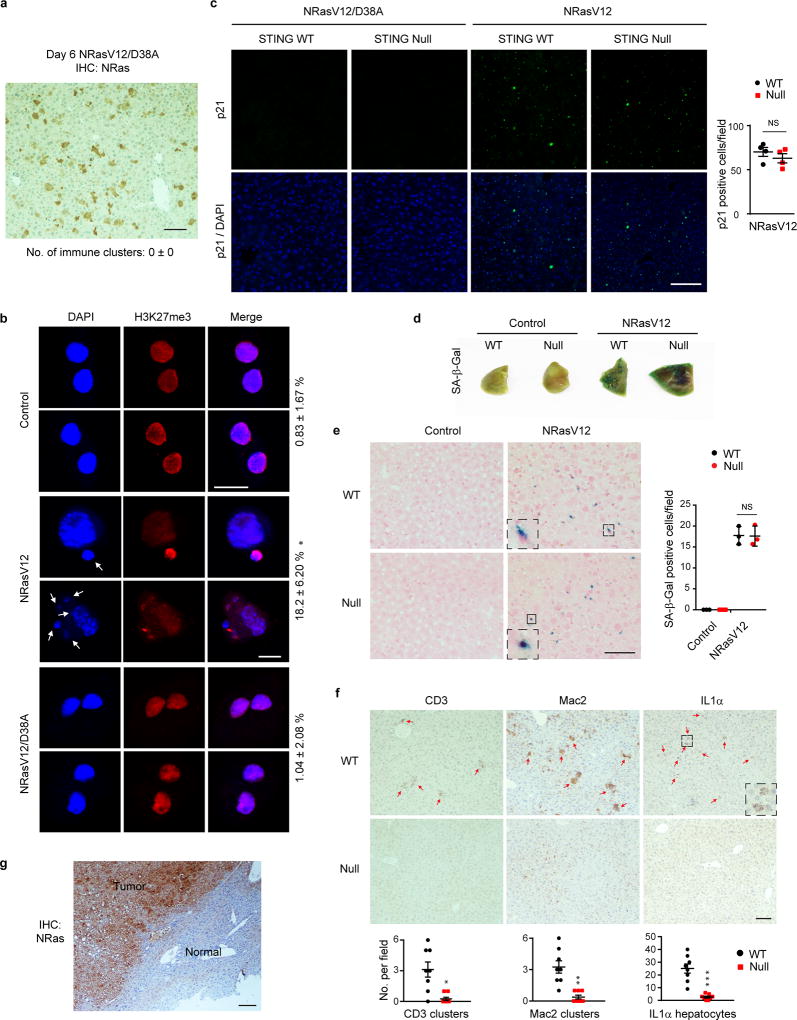
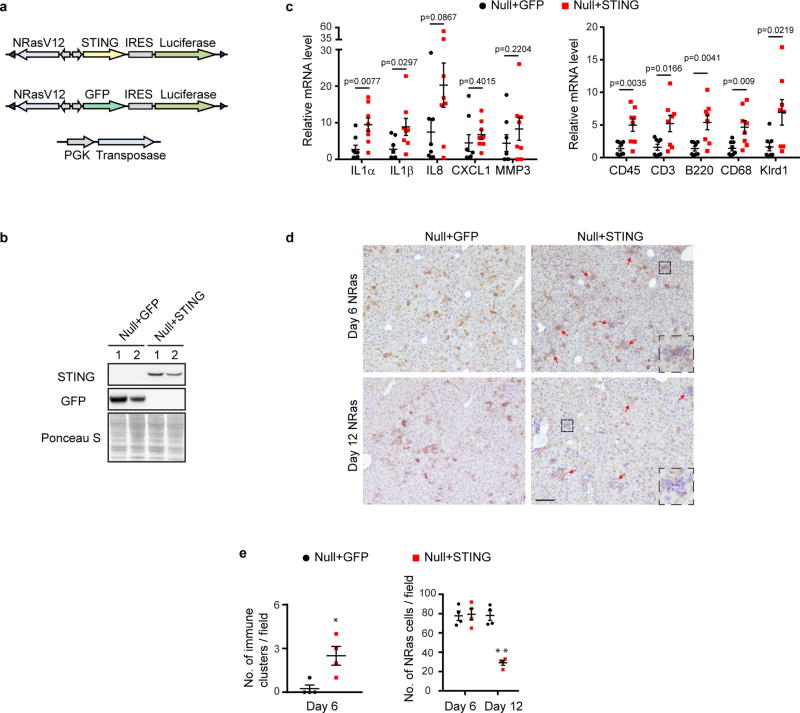
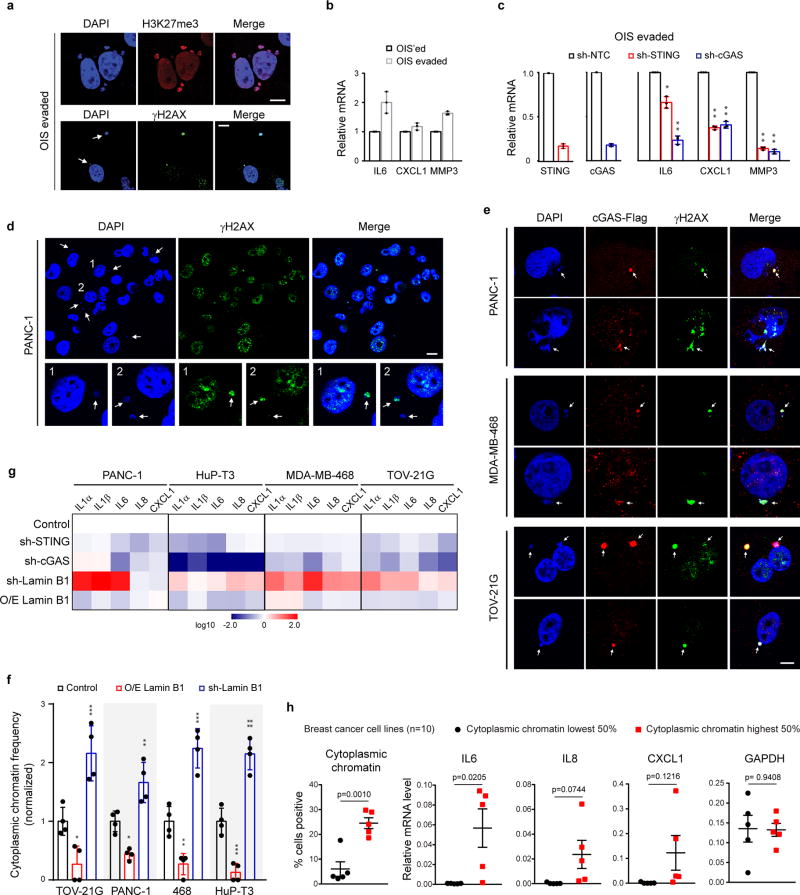
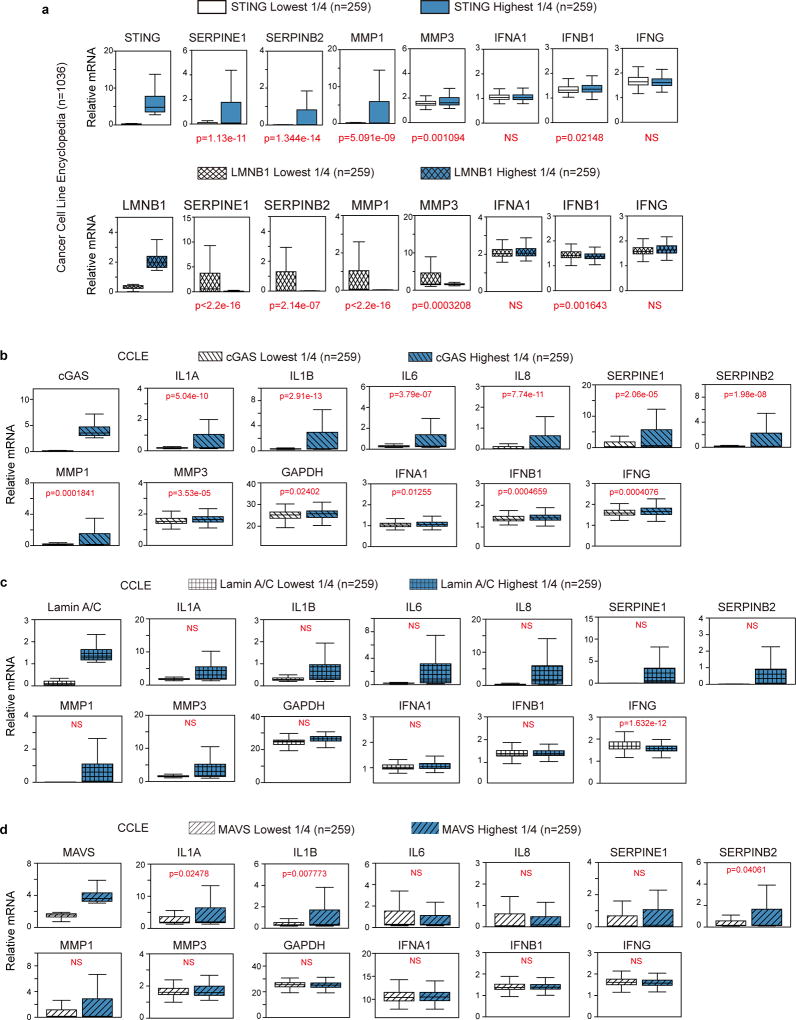
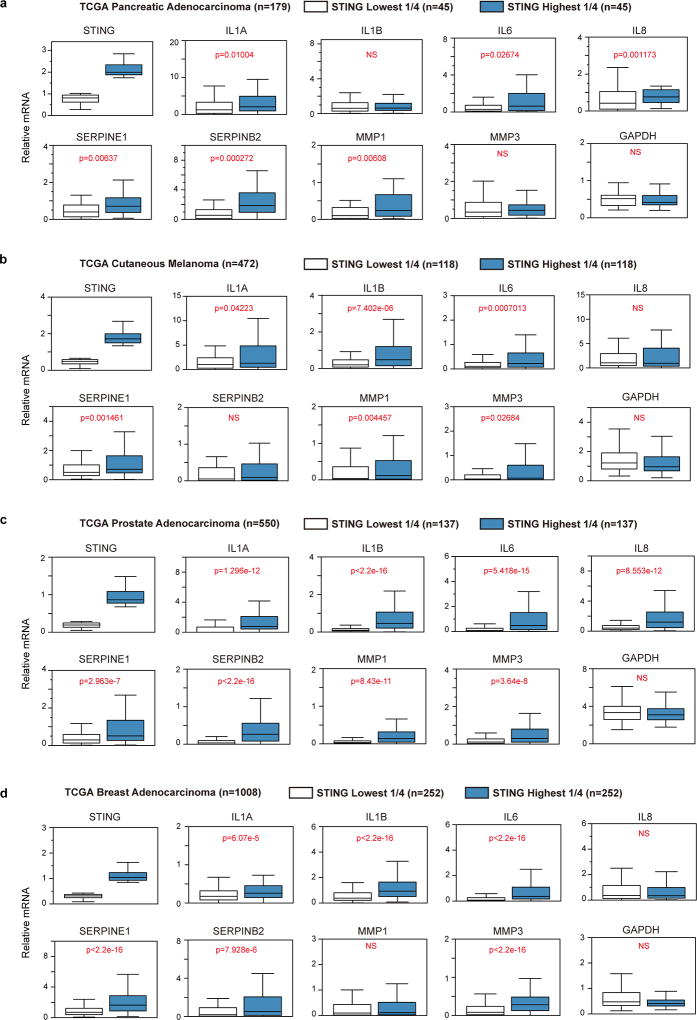
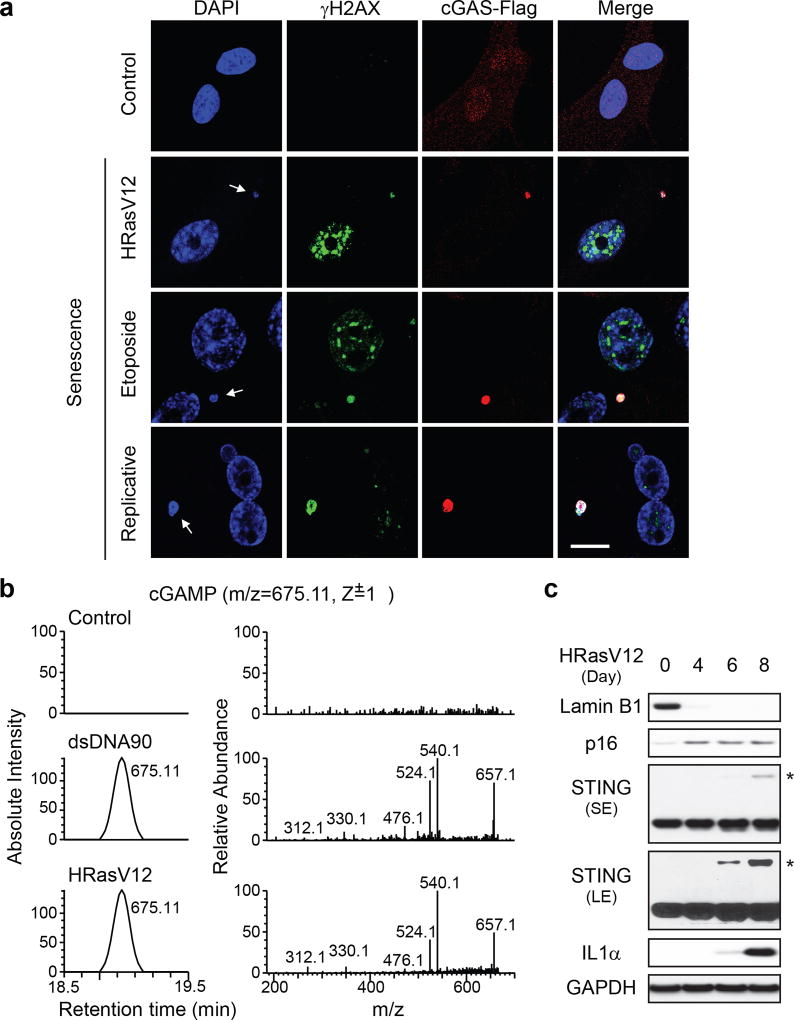
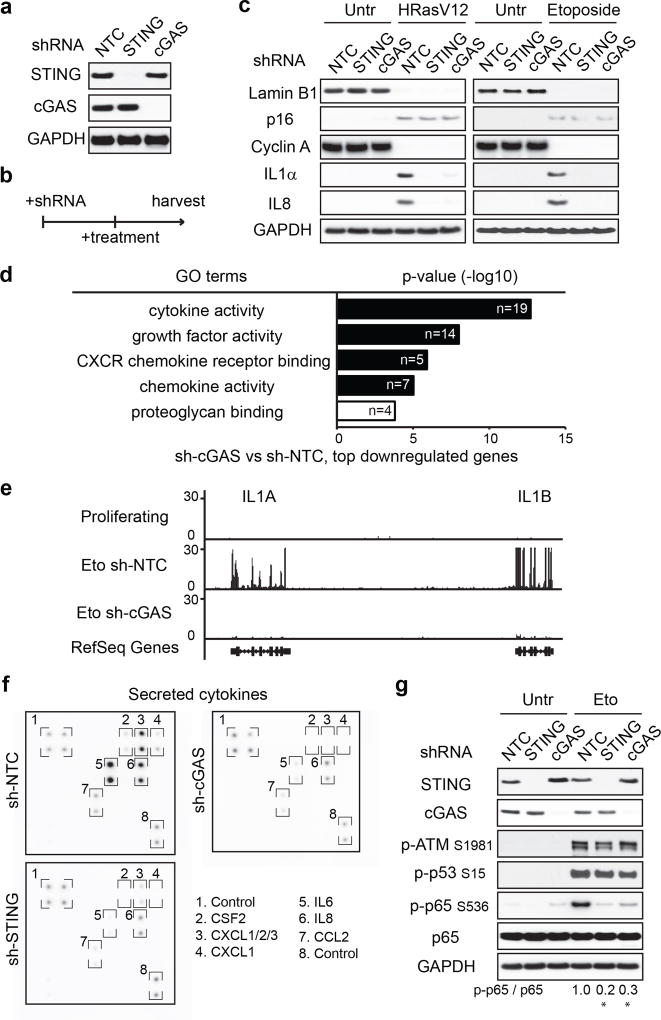
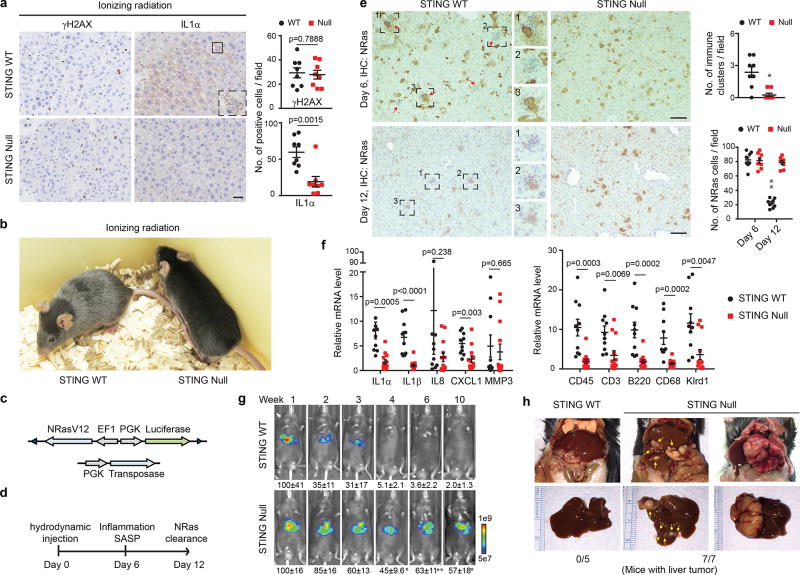
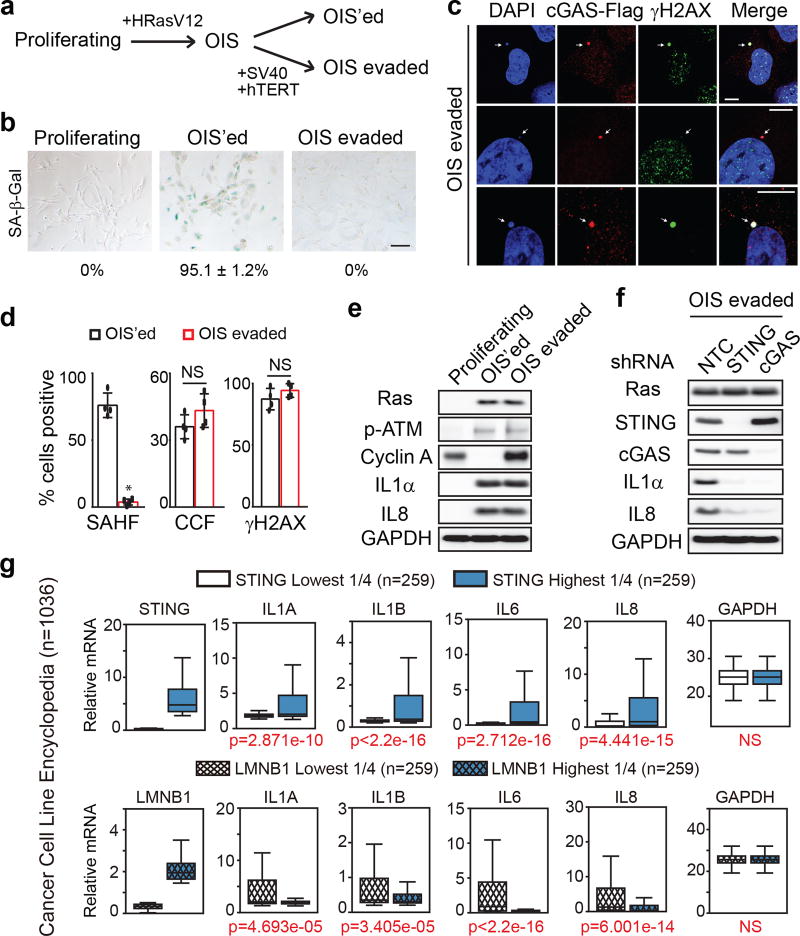
Chromatin is traditionally viewed as a nuclear entity that regulates gene expression and silencing. However, we recently discovered the presence of cytoplasmic chromatin fragments that pinch off from intact nuclei of primary cells during senescence, a form of terminal cell-cycle arrest associated with pro-inflammatory responses. The functional significance of chromatin in the cytoplasm is unclear. Here we show that cytoplasmic chromatin activates the innate immunity cytosolic DNA-sensing cGAS-STING (cyclic GMP-AMP synthase linked to stimulator of interferon genes) pathway, leading both to short-term inflammation to restrain activated oncogenes and to chronic inflammation that associates with tissue destruction and cancer. The cytoplasmic chromatin-cGAS-STING pathway promotes the senescence-associated secretory phenotype in primary human cells and in mice. Mice deficient in STING show impaired immuno-surveillance of oncogenic RAS and reduced tissue inflammation upon ionizing radiation. Furthermore, this pathway is activated in cancer cells, and correlates with pro-inflammatory gene expression in human cancers. Overall, our findings indicate that genomic DNA serves as a reservoir to initiate a pro-inflammatory pathway in the cytoplasm in senescence and cancer. Targeting the cytoplasmic chromatin-mediated pathway may hold promise in treating inflammation-related disorders.


Figures

Extended Data Figure 1
Extended Data Figure 1. CCF-cGAS-STING activation in senescence
a, Confocal microscopy analyses of primary MEFs. CCF indicated by arrows. b, Quantification of IMR90 undergoing replicative senescence. PD: population doubling. c, Microscopy-based quantification of parameters as indicated. d–f, Confocal microscopy analyses of BJ (d), IMR90 stained for endogenous cGAS (e), and mitotic IMR90 (f). g, cGAMP detection by nano-LC-MS. MS2 spectra were confirmed for cGAMP. h, IMR90 were analyzed by immunoblotting. STING blots were performed under non-reducing condition. * indicates STING dimer. i–j, Confocal microscopy images of STING in IMR90 (i) and BJ (j). k, Cells as in Fig. 1c were quantified under microscopy. Bar graphs show mean values of four different fields with over 200 cells and s.d. Scale bars: 10 µm.
Extended Data Figure 2
Extended Data Figure 2. Interferon genes are repressed in senescent human fibroblasts
a–b, ER:HRasV12 IMR90 were induced by OHT and quantified for CCF (a) or analyzed by RT-qPCR (b). c–d, IMR90 were treated with etoposide and analyzed similarly as above. Results shown in b and d were from triplicate technical replicates, and were normalized to the untreated sample. Bar graphs (a and c) show mean values of four different fields with over 200 cells and s.d. e, RNA-seq values of indicated genes. n=3; error bars: s.d. f, IMR90 were treated with a p38 inhibitor. *p<0.005, **p<0.0001, compared to DMSO. g, Cultured media from proliferating or senescent IMR90 were administered to proliferating cells, followed by dsDNA90 transfection. *p<0.0001, compared to control media. h, IMR90 were incubated with recombinant IL1α and transfected with dsDNA90. *p<0.01, **p<0.0001, compared to no-IL1α transfected groups. f–h shows RT-qPCR analyses with mean values and s.d.; n=3; unpaired two-tailed Student’s t-test. i, Schematic illustration of interferon repression in senescence.
Extended Data Figure 3
Extended Data Figure 3. CCF-cGAS-STING pathway activates the SASP
a, Cells transfected with dsDNA90 were analyzed by RT-qPCR. b, Cells as in Fig. 2c were stained for SA-β-Gal and quantified. c, IMR90 were analyzed by RT-qPCR. *p<0.0001, compared to sh-NTC etoposide. d, IMR90 were analyzed by immunoblotting. e, Track views of indicated genes from RNA-seq. f, Heatmap representation of SASP genes. g, Cultured media were analyzed by IL8 immunoblotting. h, Related to Fig. 2f, quantification of secreted cytokines. *p<0.001, **p<0.0001, comparing to sh-NTC. i–j, RT-qPCR analyses of established senescent cells. *p<0.005, **p<0.0001, compared to +OHT sh-NTC. j, IFI16 does not regulate the SASP. k, IFI16 plays a regulatory but not essential role upon dsDNA90 transfection. Bar graphs show mean values with s.d.; n=3; one-way ANOVA coupled with Tukey’s post hoc test for c and h; unpaired two-tailed Student’s t-test for i.
Extended Data Figure 4
Extended Data Figure 4. Role of CCF-cGAS-STING in SASP activation
a–c, IMR90 were analyzed by confocal microscopy. *p<0.005, compared to sh-NTC HRasV12. d, p65 ChIP-qPCR analyses. *p<0.05, **p<0.01, compared to sh-NTC. e–h, IMR90 overexpressed with Lamin B1 were analyzed by immunofluorescence (e), immunoblotting (f–g), or RT-qPCR (h). *p<0.01, **p<0.001. i, IMR90 were transfected with dsDNA90 and analyzed 4 days later for RT-qPCR. *p<0.0001. j–k, IMR90 were transfected with chromatin fragments, stained for H3, quantified for CCF (j), and analyzed by RT-qPCR (k). *p<0.005, **p<0.0001, compared to sh-NTC transfected. Bar graphs for a–c, e, and j are the average values of four different fields with over 200 cells. Error bars are s.d.; n=3 unless noted; one-way ANOVA coupled with Tukey’s post hoc test (a–d); unpaired two-tailed Student’s t-test (e, g–k). Scale bars: 10 µm.
Extended Data Figure 5
Extended Data Figure 5. Characterization of IR in mouse liver
a, Detection of cGAMP in IR hepatocytes by nano-LC-MS. b, Control or IR hepatocytes of WT mice were isolated and stained as indicated. Representative confocal images are shown. CCF are indicated by arrows. Scale bar: 5 µm. c, Related to Fig. 3a, IHC staining in no IR control liver.
Extended Data Figure 6
Extended Data Figure 6. STING promotes Ras-induced SASP in the liver
a, Immunohistochemistry of WT liver injected with NRasV12/D38A mutant. b, Hepatocytes of injected WT mice were isolated on day 6 and stained. CCF-positive hepatocytes were quantified. Results are average values of four different fields with over 200 cells; *p<0.001, compared to control and NRasV12/D38A. c, Liver was analyzed on day 6 for p21. n=4 mice. d–e, SA-β-Gal analyses of liver on day 6. n=3 mice, mean with s.e.m for e. f, Liver was analyzed by immunohistochemistry on day 6 and quantified. n=8 mice; *p<0.005, **p<0.001, ***p<0.0005. g, Liver tumor stained for NRas. One-way ANOVA coupled with Tukey’s post hoc test (b) and unpaired two-tailed Student’s t-test for all others. Scale bars: 10 µm for b and 100 µm for all others. Error bars are s.e.m.
Extended Data Figure 7
Extended Data Figure 7. Re-expression of STING in the null liver rescues the SASP
a, Illustration of constructs used for hydrodynamic injection. b, Liver was harvested on day 6 and analyzed by immunoblotting. c, Liver was harvested on day 6 and analyzed by RT-qPCR. n=8 mice. d, Immunohistochemistry analyses of liver. Regions with clusters of immune cells are indicated with red arrows, and a representative region is shown in inset. Scale bar: 100 µm. e, Quantification of immune cell clusters and NRas hepatocytes per field. n=4 mice, *p<0.05, **p<0.0005. Unpaired two-tailed Student’s t-test. Error bars: s.e.m.
Extended Data Figure 8
Extended Data Figure 8. Cytoplasmic chromatin promotes proinflammatory responses in OIS-evaded and cancer cells
a, OIS-evaded IMR90 were analyzed by confocal microscopy. b–c, OIS-evaded IMR90 were analyzed by RT-qPCR. n=3, *p<0.05, **p<0.0001, compared to sh-NTC. d–e, Cancer cells were imaged under confocal microscopy; cytoplasmic chromatin indicated by arrows. f, Cytoplasmic chromatin were quantified and presented as normalized values from four different fields with over 200 cells. *p<0.05, **p<0.01, ***p<0.005, ****p<0.0001, compared to control. g, The four cell lines were stably infected as indicated, analyzed by RT-qPCR, and presented as a heatmap. h, Ten breast cancer cell lines were analyzed for cytoplasmic chromatin and pro-inflammatory genes. Cell lines with the lowest and highest 50% of cytoplasmic chromatin were grouped and the cytokine expression levels compared. Error bars: s.e.m. for h and s.d. for all others; one-way ANOVA coupled with Tukey’s post hoc test (c and f); unpaired two-tailed Student’s t-test (h). Scale bars: 10 µm.
Extended Data Figure 9
Extended Data Figure 9. CCLE analyses of pro-inflammatory gene expression
a, Related to Fig. 4g, additional genes associated with STING or Lamin B1. b, Analyses of cGAS with pro-inflammatory gene expression profiles. Samples with the highest 25% and the lowest 25% of cGAS expression were selected, grouped, and the numbers of samples are indicated. c, Lamin A/C does not show negative correlation with inflammatory genes. d, MAVS does not correlate with pro-inflammatory gene expression. Statistical significance is judged by one-sided Wilcoxon Rank Sum test. P values are shown for each comparison. NS: non-significant (p>0.05). See Methods for additional details.
Extended Data Figure 10
Extended Data Figure 10. STING associates with pro-inflammatory gene expression in human cancers
Boxplots of TCGA RNA expression profiles in pancreatic adenocarcinoma (a), cutaneous melanoma (b), prostate adenocarcinoma (c), and breast adenocarcinoma (d). In each cancer type, samples with the highest 25% and the lowest 25% of STING expression were selected, grouped, and the numbers of samples are indicated. Pro-inflammatory gene expression levels were then analyzed between STING high and STING low groups. Statistical significance is judged by one-sided Wilcoxon Rank Sum test. P values are shown for each comparison. NS: non-significant (p>0.05). See Methods for additional details.
Figure 1
Figure 1. CCF activates cGAS-STING pathway in cellular senescence
a, Primary IMR90 stably expressing Flag-tagged cGAS were treated as indicated, and imaged under a confocal microscopy. CCF are indicated by arrows. Scale bar: 10 µm. b, Detection of cGAMP by nano-LC-MS. (Left) Cell metabolites were fractionated by HPLC, and the presence of cGAMP at the m/z of 675.11 (z=1+) was measured. (Right) Tandem mass (MS2) spectra of the detected cGAMP. c, IMR90 cell lysates were subjected to immunoblotting. STING blots were performed under non-reducing condition. * indicates STING dimer. SE, short exposure; LE, long exposure.
Figure 2
Figure 2. CCF-cGAS-STING pathway promotes the SASP
a, IMR90 as indicated were analyzed by immunoblotting. b, Schematic illustration of experimental design. c, IMR90 were analyzed by immunoblotting for senescence and SASP markers. d, GO analysis from RNA-seq, showing the most significant GO terms and the number of genes. e, Track views of IL1 gene loci. f, Cytokine-array analyses of secreted factors in etoposide-induced senescent IMR90. g, IMR90 cell lysates were analyzed by immunoblotting. Quantification of p-p65 normalized to total p65 is shown. * p<0.01, compared to Eto NTC condition, n=3 independent experiments, one-way ANOVA coupled with Tukey’s post hoc test.
Figure 3
Figure 3. STING mediates SASP in mice
a, One-week post IR, liver was analyzed by immunohistochemistry and quantified; n=8 mice. Scale bar: 20 µm. b, Representative images of mice three-month post IR. c–d, Schematic illustration of constructs and experimental design. e, Immunohistochemistry analyses of liver. Clusters of immune cells are highlighted. Scale bar: 100 µm. n=8 mice, *p<0.005, **p<0.0001. f, Liver was harvested on day 6 and analyzed by RT-qPCR. n=10 mice for WT; n=13 mice for null. g, Luminescent imaging of mice. n=3 mice, * p<0.05, ** p<0.01. h, Representative images of liver tumors. Graphs showing mean values with s.e.m.; unpaired two-tailed Student’s t-test.
Fig. 4
Fig. 4. Cytoplasmic chromatin mediates pro-inflammatory responses in senescence evasion and cancer
a, Scheme of experimental design. b, SA-β-Gal images of the three cell types. c, Confocal microscopy analyses of OIS-evaded cells. Scale bar: 10 µm. d, Quantification of cells for parameters as indicated. Results are the average values of four different fields with over 200 cells. Error bars: s.d.; *p<0.0001; NS: non-significant; unpaired two-tailed Student’s t-test. e–f, Cells as indicated were analyzed by immunoblotting. g, CCLE analyses of STING and Lamin B1 with inflammatory gene expression profiles.

Comment in

References

    1. Sen P, Shah PP, Nativio R, Berger SL. Epigenetic Mechanisms of Longevity and Aging. Cell. 2016;166:822–839. doi: 10.1016/j.cell.2016.07.050. S0092-8674(16)31000-5 [pii] - DOI - PMC - PubMed
    1. Benayoun BA, Pollina EA, Brunet A. Epigenetic regulation of ageing: linking environmental inputs to genomic stability. Nat Rev Mol Cell Biol. 2015;16:593–610. doi: 10.1038/nrm4048. nrm4048 [pii] - DOI - PMC - PubMed
    1. Berger SL. The complex language of chromatin regulation during transcription. Nature. 2007;447:407–412. doi: 10.1038/nature05915. doi:nature05915 [pii] - DOI - PubMed
    1. Ivanov A, et al. Lysosome-mediated processing of chromatin in senescence. J Cell Biol. 2013;202:129–143. doi: 10.1083/jcb.201212110. jcb.201212110 [pii] - DOI - PMC - PubMed
    1. Dou Z, et al. Autophagy mediates degradation of nuclear lamina. Nature. 2015;527:105–109. doi: 10.1038/nature15548. nature15548 [pii] - DOI - PMC - PubMed

Publication types

MeSH terms