. 2017 Nov 2;45(19):11070-11087.
doi: 10.1093/nar/gkx722.

Developmentally regulated higher-order chromatin interactions orchestrate B cell fate commitment

Affiliations

Developmentally regulated higher-order chromatin interactions orchestrate B cell fate commitment

Ravi Boya et al. Nucleic Acids Res. .

Abstract

Genome organization in 3D nuclear-space is important for regulation of gene expression. However, the alterations of chromatin architecture that impinge on the B cell-fate choice of multi-potent progenitors are still unclear. By integrating in situ Hi-C analyses with epigenetic landscapes and genome-wide expression profiles, we tracked the changes in genome architecture as the cells transit from a progenitor to a committed state. We identified the genomic loci that undergo developmental switch between A and B compartments during B-cell fate determination. Furthermore, although, topologically associating domains (TADs) are stable, a significant number of TADs display structural alterations that are associated with changes in cis-regulatory interaction landscape. Finally, we demonstrate the potential roles for Ebf1 and its downstream factor, Pax5, in chromatin reorganization and transcription regulation. Collectively, our studies provide a general paradigm of the dynamic relationship between chromatin reorganization and lineage-specific gene expression pattern that dictates cell-fate determination.


Figures

Figure 1.
Figure 1.
Chromatin compartmentalization is closely associated with gene activity. (A) Iteratively corrected intra-chromosomal contact count matrix of chromosome 2, representing the frequency of interactions at 1 Mb resolution. The first principal components (PC1) indicate the chromatin state on a linear genomic scale. (B) Distribution of genes in A and B compartments for both pre-pro-B and pro-B cell types (***P < 0.001). (C) A and B compartments that are defined by PC1 were integrated with active methylation marks (H3K4me1, H3K4me3 and H3K9/14ac). Normalized heat maps were generated by employing Matrix2png. Rows represent individual chromosomes, whereas the columns represent normalized count of respective methylation mark. (D) Comparative analysis of transcript levels of genes, based on RNA-Seq, present in A and B compartments (***P < 0.001) for both pre-pro-B and pro-B cells. (E) Comparative analysis of transcript abundance of genes that relocate from B to A compartment (left panel) and A to B compartment (right panel) during differentiation of pre-pro-B cells into pro-B cells (***P < 0.001). (F, G) Iteratively corrected contact count matrices derived from genomic regions comprising Satb2 (chr1) and Satb1 (chr17) for both pre-pro-B and pro-B cells. The PC1 values indicate the chromatin state of respective genomic loci. Dotted boxes represent genomic regions of Satb2 and Satb1.
Figure 2.
Figure 2.
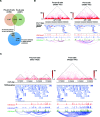
TADs are dynamic and undergo structural reorganization during early B cell development. (A) Venn diagram indicating the number of promoters interacting with cis-regulatory elements that are present in the stable TADs with similar AP values in both pre-pro-B and pro-B cells. The pie chart represents the number of common promoters tethered to same (grey) or cell type-specific (blue) enhancers. (B) Comparative analysis of promoter-cis-regulatory interactions between stable TADs with similar AP values spanning a genomic region (106.04–107 Mb) of chromosome 11. TADs are mapped with active epigenetic marks, H3K4me3 (enriched at promoter regions), H3K4me1 and H3K4me2 (enriched at enhancers) as determined by ChIP-Seq in both pre-pro-B and pro-B cells. TADs were defined by domain calling approach and are highlighted by dotted lines. The genomic positions of promoter-cis-regulatory interactions within the TADs are represented by arcs. Polg2 (black) and Cd79b (blue) interactions are highlighted (C) Comparative analysis of promoter-cis-regulatory interactions between merged TAD (pro-B cells) and its counter TADs (pre-pro-B cells) spanning the genomic region (112.20–115.64 Mb) of chromosome 5. TADs are demarcated by domain calling approach and highlighted by dotted lines. TADs were mapped with active epigenetic marks: H3K4me3 (for promoters) and H3K4me1 and H3K4me2 (for enhancers) as determined by ChIP-Seq in both pre-pro-B and pro-B cells. Promoter-cis-regulatory interactions are represented by blue arcs.
Figure 3.
Figure 3.
Comparative analysis of structural organization of TADs between pre-pro-B and pro-B cells. (A) Pearson's Correlation Coefficient for directionality index (DI) calculated for stable as well as dynamic TADs (merged and unique) between pre-pro-B and pro-B cells. (B) Genome-wide comparative analysis of 3D spatial distances between start and end regions of merged TADs in pro-B cells and their counter regions in pre-pro-B cells (**P < 0.01) (left panel). Similar analysis of 3D spatial distances for stable TADs in both pre-pro-B and pro-B cells (n.s. = not significant) (right panel).
Figure 4.
Figure 4.
Validation of TADs reorganization by 3C analysis. Comparative analysis of 3D spatial distances and promoter-cis-regulatory interactions between merged TAD (pro-B cells) and its counter TADs (pre-pro-B cells) spanning the genomic region (69.72–71.16 Mb) of chromosome 12. 3D models generated by AutoChrom3D were colored distinctly based on minor TADs in pre-pro-B cells and the same color code is given for corresponding genomic regions of merged TAD in pro-B cells. The start and end regions of merged TAD in pro-B cells and its counter regions in pre-pro-B cells are highlighted by green and red respectively in the back bone 3D structure and the spatial distance between these regions is indicated in Å units. 3D models were generated at 8 kb resolution (upper panel). TADs were demarcated by domain calling approach and highlighted by dotted lines. TADs were mapped with active epigenetic marks H3K4me3 (for promoters), and H3K4me1 and H3K4me2 (for enhancers) as determined by ChIP-Seq in both pre-pro-B and pro-B cells. Promoter-cis-regulatory interactions are represented by horizontal lines (middle panel). 3C analysis of interaction frequency between ends of merged TAD (Chr12: 69.72–71.16 Mb) in pro-B cells and its counter regions in pre-pro-B cells. HindIII restriction sites are shown above the 3C plots. The location of primers used for measuring cross-linking frequency is indicated by red arrows (lower panel).
Figure 5.
Figure 5.
TADs represent chromatin subunits of coordinate gene expression. (A) Histogram representing chromatin state of TADs as defined by Principal Component Analysis (PCA). (B) Comparative analysis of Pearson's correlation coefficient (PCC) for gene-pairs present in the same TAD against gene-pairs present in other TADs (*P < 0.05, ***P < 0.001) in pre-pro-B and pro-B cells. PCC was calculated by considering microarray measurements of hematopoietic stem cells (HSCs), common Lymphoid Progenitors (CLPs) and pro-B cells (pro-B.FrBC.BM). (C, D) Representation of Pearson's correlation coefficient for gene-pairs present in two different TADs spanning genomic region (53.96–55.92 Mb) of chromosome 17 and (57.88–61.56 Mb) of chromosome 18 for pre-pro-B and pro-B cells respectively. Blue represents positive correlation whereas red represents negative correlation. Each dotted box represents an individual TAD.
Figure 6.
Figure 6.
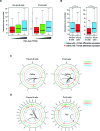
cis-regulatory interaction landscape determines differential gene expression pattern. (A) Box plots showing the relation between the number of cis-regulatory elements that are interacting with promoters and their expression levels, in pre-pro-B and pro-B cells. Transcript levels of genes were measured by RNA-Seq. (B) Box plots representing comparative analysis of promoter-cis-regulatory interactions for a set of genes with ≥10-fold differential expression in pre-pro-B cells (right panel) and in pro-B cells (left panel) (***P<0.001). (C, D) Circos plots showing promoter-cis-regulatory interactome of Cd24a (Chr11:43.3–44.1 Mb) and Flt3 (Chr5:14.68–14.89 Mb) in pre-pro-B (left panel) and pro-B cells (right panel). Black arcs represent promoter-cis-regulatory interactions.
Figure 7.
Figure 7.
Validation of promoter–enhancer interactions by 3C analysis. (A) Ccl3 locus, overlaid with various epigenetic marks as determined by ChIP-Seq in both pre-pro-B and pro-B cells (upper panel). Interaction frequency between promoter region of Ccl3 and its distant putative enhancer located at 64 kb upstream of promoter in both pre-pro-B and pro-B cells (lower panel) was measured by 3C-qPCR analyses. Data are representative of two independent biological experiments (error bars, S.E.). (B) Relative transcript levels of Ccl3 as measured by quantitative RT-PCR in pre-pro-B cells and pro-B cells. Hprt was used as endogenous control and values were normalized against pro-B cells as a reference control. Data are representative of two independent biological experiments (error bars, S.E.).
Figure 8.
Figure 8.
Ebf1 regulates B lineage-specific gene expression pattern in part by binding at cis-regulatory interacting elements. (A) Venn diagram representing the motifs of the TFs (Ebf1 and Pax5) binding at the promoters and respective cis-regulatory elements. (B) Box plot representing genome-wide comparative analysis of transcript levels of genes with or without Ebf1/Pax5 binding sites in the promoter-cis-regulatory interacting elements (***P < 0.001). (C) Heat maps showing correlation between transcript levels of genes and Ebf1 and/or Pax5 binding events in the promoter-cis-regulatory interacting elements. (D) Heat maps showing the genome-wide expression patterns of B lineage-specific genes (fold change ≥ 2; P-value < 0.05) obtained by microarray analysis of pre-pro-B cells (Ebf1−/− progenitors) transduced with Ebf1 or Pax5. (E) Venn diagram indicating the number of genes that are regulated by Ebf1 and/or Pax5. Up headed arrow represents activated, down headed arrow represents repressed genes. (F) Venn diagram representing the percentage of upregulated targets of Ebf1 and/or Pax5 that are involved in cis-regulatory interactions in pro-B cells. (G) Venn diagrams representing the percentage of Ebf1 or Pax5 target genes containing Ebf1 and/or Pax5 binding sites within the cis-regulatory sequences that are involved in long-range interactions.

Similar articles

Cited by

References

    1. Gibcus J.H., Dekker J.. The hierarchy of the 3D genome. Mol. Cell. 2013; 49:773–782. - PMC - PubMed
    1. Lieberman-Aiden E., van Berkum N.L., Williams L., Imakaev M., Ragoczy T., Telling A., Amit I., Lajoie B.R., Sabo P.J., Dorschner M.O. et al. Comprehensive mapping of long-range interactions reveals folding principles of the human genome. Science. 2009; 326:289–293. - PMC - PubMed
    1. Dekker J., Rippe K., Dekker M., Kleckner N.. Capturing chromosome conformation. Science. 2002; 295:1306–1311. - PubMed
    1. Dostie J., Richmond T.A., Arnaout R.A., Selzer R.R., Lee W.L., Honan T.A., Rubio E.D., Krumm A., Lamb J., Nusbaum C. et al. Chromosome Conformation Capture Carbon Copy (5C): a massively parallel solution for mapping interactions between genomic elements. Genome Res. 2006; 16:1299–1309. - PMC - PubMed
    1. Fullwood M.J., Liu M.H., Pan Y.F., Liu J., Xu H., Mohamed Y.B., Orlov Y.L., Velkov S., Ho A., Mei P.H. et al. An oestrogen-receptor-alpha-bound human chromatin interactome. Nature. 2009; 462:58–64. - PMC - PubMed

MeSH terms