. 2017 Nov 16;45(20):11658-11672.
doi: 10.1093/nar/gkx762.

A pathway for low zinc homeostasis that is conserved in animals and acts in parallel to the pathway for high zinc homeostasis

Affiliations

A pathway for low zinc homeostasis that is conserved in animals and acts in parallel to the pathway for high zinc homeostasis

Nicholas Dietrich et al. Nucleic Acids Res. .

Abstract

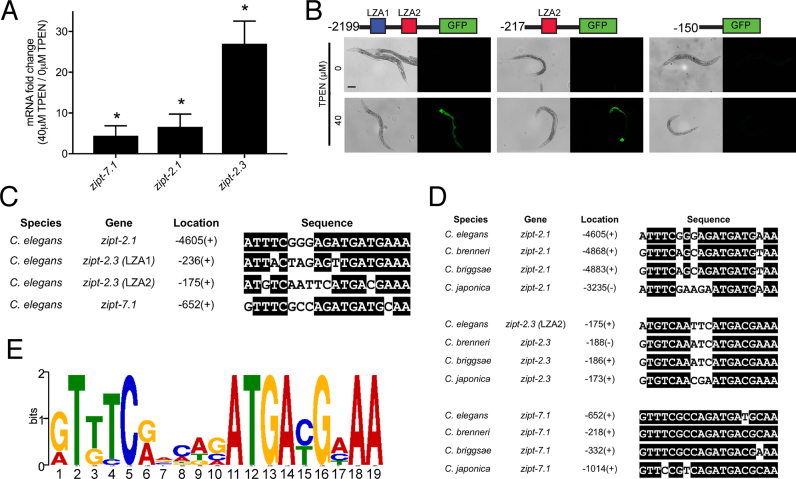
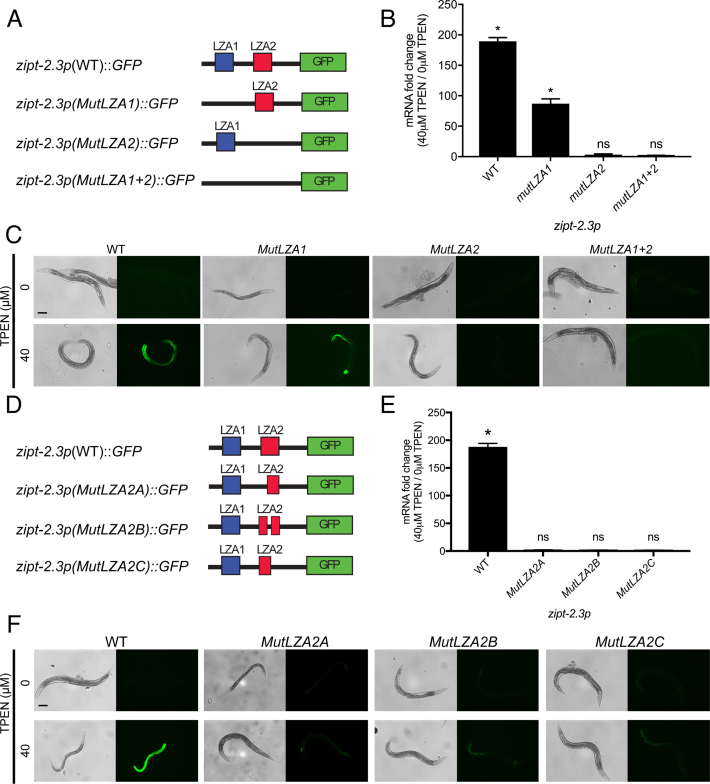
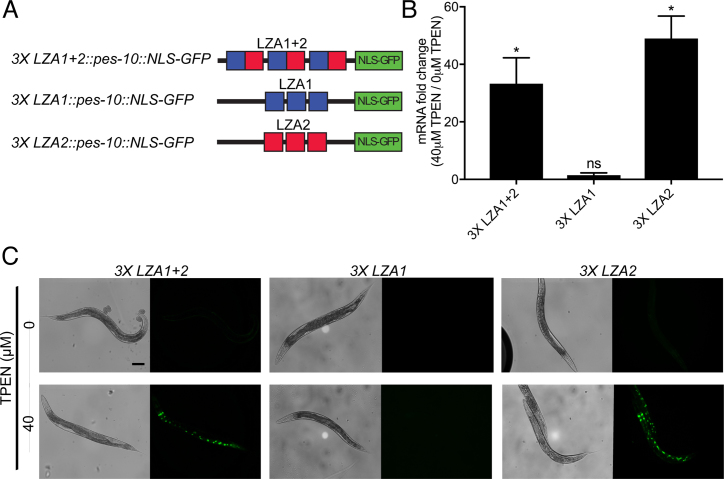
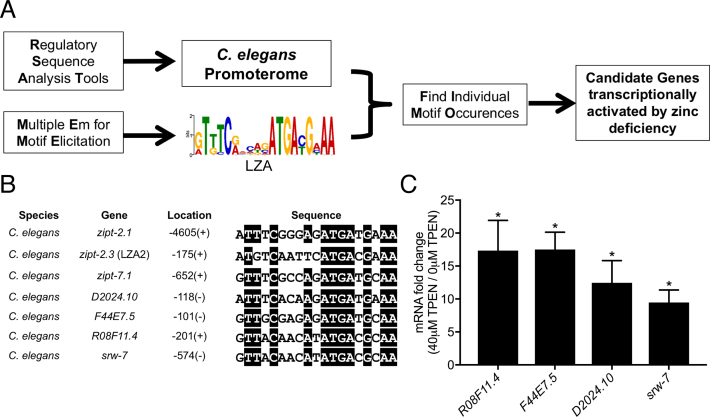
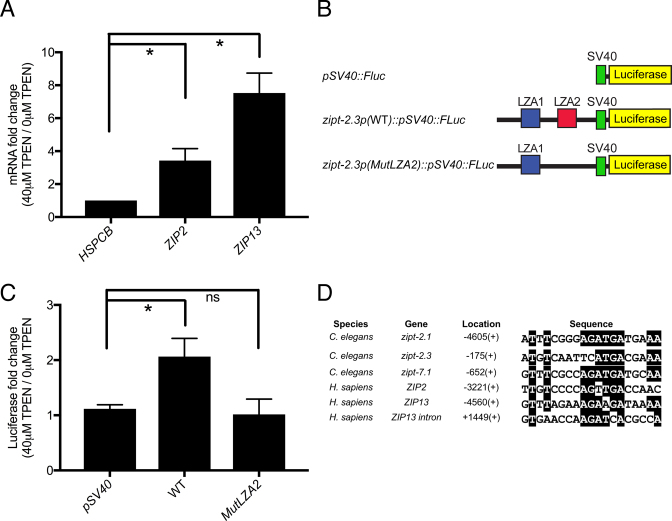
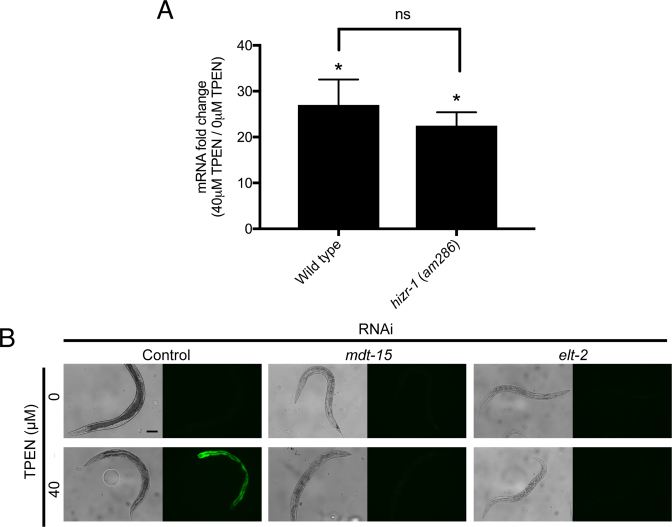
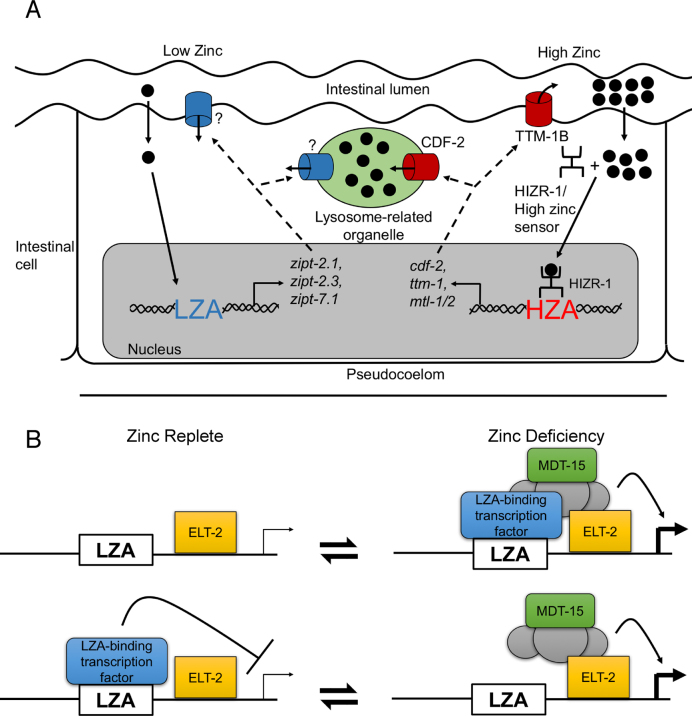
The essential element zinc plays critical roles in biology. High zinc homeostasis mechanisms are beginning to be defined in animals, but low zinc homeostasis is poorly characterized. We investigated low zinc homeostasis in Caenorhabditis elegans because the genome encodes 14 evolutionarily conserved Zrt, Irt-like protein (ZIP) zinc transporter family members. Three C. elegans zipt genes were regulated in zinc-deficient conditions; these promoters contained an evolutionarily conserved motif that we named the low zinc activation (LZA) element that was both necessary and sufficient for activation of transcription in response to zinc deficiency. These results demonstrated that the LZA element is a critical part of the low zinc homeostasis pathway. Transcriptional regulation of the LZA element required the transcription factor ELT-2 and mediator complex member MDT-15. We investigated conservation in mammals by analyzing LZA element function in human cultured cells; the LZA element-mediated transcriptional activation in response to zinc deficiency in cells, suggesting a conserved pathway of low zinc homeostasis. We propose that the pathway for low zinc homeostasis, which includes the LZA element and ZIP transporters, acts in parallel to the pathway for high zinc homeostasis, which includes the HZA element, HIZR-1 transcription factor and cation diffusion facilitator transporters.


Figures

Figure 1.
Figure 1.
Identification of the LZA element. (A) A population of mixed-stage, wild-type animals were cultured with 0 or 40 μM TPEN for 16 h. RNA was analyzed by qRT-PCR. Values are the ratio of mRNA levels at 40 μM TPEN/0 μM TPEN, an indication of transcriptional activation and are the average of three biological replicates; error bars display standard deviation. Each gene displayed significantly increased mRNA levels at 40 μM TPEN (*P < 0.05). (B) Diagrams of the zipt-2.3 promoter region (not to scale) extending 2199, 217 or 150 bp upstream of the translation start site fused to the GFP coding region. Boxes show LZA1 element (blue) and LZA2 element (red). Transgenic animals containing these constructs were cultured with 0 or 40 μM TPEN for 16 h and imaged with bright field to display worms (left) or fluorescence to display GFP expression (right). Scale bar indicates 100 μm. (C) An alignment of LZA elements from the promoters of Caenorhabditis elegans zipt-2.1, zipt-2.3 and zipt-7.1. Identical residues are highlighted in black. Location is the position of the first base pair of the LZA element relative to the ATG start codon, and +/− refers to the orientation relative to the DNA strand that is transcribed. (D) Sequence alignments of LZA elements in the promoter regions of zipt-2.1, zipt-2.3 and zipt-7.1 in the Caenorhabditis species elegans, brenneri, briggsae and japonica identified by MEME. For zipt-2.3, the LZA2 element in C. elegans is conserved in three other species, and the LZA1 element is not conserved. (E) A position weight matrix of the LZA element based on 12 motifs shown in D. The height of each nucleotide represents the frequency scaled in bits.
Figure 2.
Figure 2.
The LZA element was necessary for transcriptional activation of zipt-2.3 in response to zinc deficiency. (A and D) Diagrams (not to scale) of the zipt-2.3 promoter beginning at base pair −2199 and extending to the ATG translation start codon (black line). Boxes show LZA1 element (blue), LZA2 element (red) and the coding region of green fluorescent protein (green). Mutations created by randomizing the sequence of LZA1 or LZA2 elements are indicated by black lines. MutLZA2A, B and C affect base pairs 1–6, 7–14 and 15–19, respectively, of the 19 bp LZA weight matrix shown in Figure 1E. (B and E) A mixed stage population of transgenic animals containing multicopy arrays of the reporter constructs were cultured on medium with 40 μM TPEN to induce zinc deficiency or control, zinc replete medium (0 μM TPEN). GFP mRNA levels were analyzed by qRT-PCR. Bars depict the change in mRNA levels as the ratio between 40 and 0 μM TPEN, with positive values indicating transcriptional activation in zinc-deficient conditions. Values represent the average and error bars are the standard deviation of three independent biological replicates (*P < 0.01). (C and F) Images show transgenic animals at the young adult stage cultured with 0 or 40 μM TPEN; bright field images (left) show worm morphology, and fluorescent images (right) show GFP fluorescence. GFP signals were captured with identical settings and exposure times. Scale bar indicates 100 μm.
Figure 3.
Figure 3.
The LZA element was sufficient to mediate transcriptional activation in response to zinc deficiency in a heterologous promoter. (A) Diagrams (not to scale) of the pes-10 promoter (black line). Boxes show the LZA1 element (blue), the LZA2 element (red) and the coding region of green fluorescent protein with a nuclear localization sequence (green). (B) A mixed stage population of transgenic animals containing multicopy arrays of the reporter constructs were cultured on medium with 40 μM TPEN to induce zinc deficiency or control, zinc replete medium (0 μM TPEN). GFP mRNA levels were analyzed by qRT-PCR. Bars depict the change in mRNA levels as the ratio between 40 and 0μM TPEN, with positive values indicating transcriptional activation in zinc-deficient conditions. Values represent the average and standard deviation of 3 independent biological replicates (*P < 0.01). (C) Images show transgenic animals at the young adult stage cultured with 0 or 40 μM TPEN; bright field images (left) show worm morphology, and fluorescent images (right) show GFP fluorescence. GFP signals were captured with identical settings and exposure times. Green puncta are the nuclei of intestinal cells. Scale bar indicates 100 μm.
Figure 4.
Figure 4.
The LZA element can be used to predict genes regulated by zinc deficiency in Caenorhabditis elegans. (A) An overview of the strategy used to identify candidate genes regulated by zinc deficiency. The Regulatory Sequence Analysis Tools database was used to obtain the predicted promoters of all C. elegans genes (C. elegans promoterome). MEME was used to generate the LZA weight matrix. The Find Individual Motif Occurrences program was used to search the promoterome for matches to the LZA weight matrix, generating a list of candidate genes. (B) Sequence alignments of the LZA elements in the promoter regions of C. elegans genes zipt-7.1, zipt-2.1 and zipt-2.3, which were used to generate the LZA weight matrix, and D2024.10, F44E7.5, R08F11.4 and srw-7, which were identified in the genome-wide LZA element search. Identical residues are highlighted in black. (C) A population of mixed-stage, wild-type animals were cultured with 0 or 40 μM TPEN for 16 h. RNA was analyzed by qRT-PCR. Values are the ratio of mRNA levels at 40 μM TPEN/ 0 μM TPEN, an indication of transcriptional activation, and are the average of three biological replicates; error bars display standard deviation. Each gene displayed significantly increased mRNA levels at 40 μM TPEN (*P < 0.01).
Figure 5.
Figure 5.
The LZA element functioned in human cells. (A) HEK293T cells were cultured in growth medium containing 0 or 40 μM TPEN for 3 h, and RNA was analyzed by qRT-PCR. Values are the ratio of mRNA levels at 40 μM TPEN/ 0 μM TPEN, an indication of transcriptional activation and are the average of three biological replicates and the standard deviation. In response to zinc deficiency, transcripts of the control gene Heat Shock Protein 90 Alpha Family Class B Member 1 (HSPCB) did not accumulate, whereas transcripts of ZIP2 and ZIP13 displayed significant accumulation (*P < 0.01). (B) Diagrams (not to scale) of the SV40 promoter (green) driving expression of the coding region of Firefly luciferase protein (yellow). The zipt-2.3 promoter region extended from −2199 to the ATG start codon (black line) and was cloned upstream of the SV40 promoter. Boxes show the LZA1 element (blue) and the LZA2 element (red); the LZA2 element was mutated by randomizing the order of 24 base pairs (MutLZA2). (C) Plasmids were co-transfected with a plasmid expressing renilla luciferase as a control for transfection efficiency into HEK293T cells. Forty-eight hours post-transfection, cells were incubated with 0 or 40 μM TPEN for 3 h and extracts were analyzed for firefly and renilla luciferase enzyme activity. Values are the ratio of normalized firefly luciferase enzyme activity at 40 μM TPEN/0 μM TPEN, an indication of transcriptional activation and are the average of three biological replicates and the standard deviation (*P < 0.01). (D) Sequence alignments of the LZA elements in the promoter regions of Caenorhabditis elegans genes zipt-7.1, zipt-2.1 and zipt-2.3, which were used to generate the LZA weight matrix, the promoter regions of human ZIP2 and ZIP13, and the intron of human ZIP13, which were identified in gene-specific searches for LZA elements. Identical residues are highlighted in black. Location is the position of the first base pair of the LZA element relative to the ATG start codon, and +/− refers to the orientation relative to the DNA strand that is transcribed.
Figure 6.
Figure 6.
mdt-15 and elt-2 were necessary for transcriptional activation of zipt-2.3 in zinc-deficient conditions. (A) Populations of mixed-stage, wild-type or hizr-1(am286) animals were cultured with 0 or 40 μM TPEN for 16 h. RNA was analyzed by qRT-PCR. Values are the ratio of mRNA levels at 40 μM TPEN/0 μM TPEN, an indication of transcriptional activation, and are the average of three biological replicates and the standard deviation. zipt-2.3 mRNA displayed significant accumulation to similar levels in both genotypes. (B) Transgenic animals containing zipt-2.3p(WT)::GFP were cultured on the indicated RNAi bacteria from the L1 to the young adult stage and then transferred to medium containing 0 or 40 μM TPEN for 16 h. Bright field images (left) show worm morphology, and fluorescent images (right) show GFP fluorescence. GFP signals were captured with identical settings and exposure times. Scale bar indicates 100 μm.
Figure 7.
Figure 7.
Models of transcriptional regulation during zinc deficiency. (A) Diagram of an intestinal cell flanked by the intestinal lumen (above) and the pseudocoelom (below). Two dietary zinc-conditions are illustrated: deficiency (left) and excess (right). Zinc (black circles) enters the intestinal cell, and an undefined sensing mechanism causes activation of LZA element containing promoters. ZIPT proteins (blue) might localize to the plasma membrane or lysosome related organelles (LRO, green), but the subcellular localization has not been established. During zinc excess, the HIZR-1 nuclear receptor causes activation of HZA element containing promoters and the CDF-2 protein (red) localizes to the LRO where it functions to store zinc, and the TTM-1B protein (red) localizes to the plasma membrane where it functions to excrete zinc. (B) Two models of LZA element mediated transcriptional regulation. In the upper model, a proposed LZA element binding protein (blue box) is a transcriptional activator that interacts with the LZA element in response to zinc deficiency; this triggers assembly of a transcriptional activation complex including MDT-15 (green box). ELT-2 (yellow box) constitutively binds GATA elements and is permissive for intestinal cell expression. Stimulation is shown by an arrow and thick transcription start site. In the lower model, the LZA-element binding protein is a transcriptional repressor that interacts with the LZA element during zinc-replete conditions. Repression is shown by a bar and thin transcription start site; zinc deficiency abrogates the binding interaction, allowing assembly of a transcriptional activation complex. These two models are not mutually exclusive, since the LZA element binding protein might be converted from a repressor in zinc-replete conditions to an activator in zinc-deficient conditions.

Similar articles

Cited by

References

    1. Gaither L.A., Eide D.J.. Eukaryotic zinc transporters and their regulation. Biometals. 2001; 14:251–270. - PubMed
    1. Vallee B.L., Falchuk K.H.. The biochemical basis of zinc physiology. Physiol. Rev. 1993; 73:79–118. - PubMed
    1. Andreini C., Banci L., Ivano B., Rosato A.. Counting the zinc-proteins encoded in the human genome. J. Proteome Res. 2005; 5:196–201. - PubMed
    1. Yamasaki S., Sakata-Sogawa K., Hasegawa A., Suzuki T., Kabu K., Sato E., Kurosaki T., Yamashita S., Tokunaga M., Nishida K. et al. . Zinc is a novel intracellular second messenger. J. Cell Biol. 2007; 177:637–645. - PMC - PubMed
    1. Kim A.M., Bernhardt M.L., Kong B.Y., Ahn R.W., Vogt S., Woodruff T.K., O’Halloran T. V.. Zinc sparks are triggered by fertilization and facilitate cell cycle resumption in mammalian eggs. ACS Chem. Biol. 2011; 6:716–723. - PMC - PubMed

MeSH terms

LinkOut - more resources