p53 controls expression of the DNA deaminase APOBEC3B to limit its potential mutagenic activity in cancer cells
- PMID: 28977491
- PMCID: PMC5737468
- DOI: 10.1093/nar/gkx721
p53 controls expression of the DNA deaminase APOBEC3B to limit its potential mutagenic activity in cancer cells
Abstract
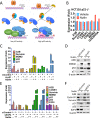
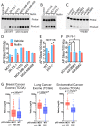
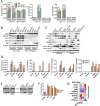
Cancer genome sequencing has implicated the cytosine deaminase activity of apolipoprotein B mRNA editing enzyme catalytic polypeptide-like (APOBEC) genes as an important source of mutations in diverse cancers, with APOBEC3B (A3B) expression especially correlated with such cancer mutations. To better understand the processes directing A3B over-expression in cancer, and possible therapeutic avenues for targeting A3B, we have investigated the regulation of A3B gene expression. Here, we show that A3B expression is inversely related to p53 status in different cancer types and demonstrate that this is due to a direct and pivotal role for p53 in repressing A3B expression. This occurs through the induction of p21 (CDKN1A) and the recruitment of the repressive DREAM complex to the A3B gene promoter, such that loss of p53 through mutation, or human papilloma virus-mediated inhibition, prevents recruitment of the complex, thereby causing elevated A3B expression and cytosine deaminase activity in cancer cells. As p53 is frequently mutated in cancer, our findings provide a mechanism by which p53 loss can promote cancer mutagenesis.
© The Author(s) 2017. Published by Oxford University Press on behalf of Nucleic Acids Research.
Figures


Similar articles
-
Induction of APOBEC3B expression by chemotherapy drugs is mediated by DNA-PK-directed activation of NF-κB.Oncogene. 2021 Feb;40(6):1077-1090. doi: 10.1038/s41388-020-01583-7. Epub 2020 Dec 15. Oncogene. 2021. PMID: 33323971 Free PMC article.
-
Mutation Processes in 293-Based Clones Overexpressing the DNA Cytosine Deaminase APOBEC3B.PLoS One. 2016 May 10;11(5):e0155391. doi: 10.1371/journal.pone.0155391. eCollection 2016. PLoS One. 2016. PMID: 27163364 Free PMC article.
-
The DNA deaminase APOBEC3B interacts with the cell-cycle protein CDK4 and disrupts CDK4-mediated nuclear import of Cyclin D1.J Biol Chem. 2019 Aug 9;294(32):12099-12111. doi: 10.1074/jbc.RA119.008443. Epub 2019 Jun 19. J Biol Chem. 2019. PMID: 31217276 Free PMC article.
-
APOBEC3B: pathological consequences of an innate immune DNA mutator.Biomed J. 2015 Mar-Apr;38(2):102-10. doi: 10.4103/2319-4170.148904. Biomed J. 2015. PMID: 25566802 Review.
-
[APOBEC3B-induced mutagenesis in cancers].Seikagaku. 2016 Oct;88(5):576-81. Seikagaku. 2016. PMID: 29624320 Review. Japanese. No abstract available.
Cited by
-
A comprehensive molecular characterization of a claudin-low luminal B breast tumor.Biol Direct. 2024 Aug 16;19(1):66. doi: 10.1186/s13062-024-00482-1. Biol Direct. 2024. PMID: 39152485 Free PMC article.
-
SARS-CoV-2 infection heightens the risk of developing HPV-related carcinoma in situ and cancer.Discov Oncol. 2025 Aug 14;16(1):1552. doi: 10.1007/s12672-025-03403-4. Discov Oncol. 2025. PMID: 40813533 Free PMC article.
-
Pan-cancer transcriptomic analysis dissects immune and proliferative functions of APOBEC3 cytidine deaminases.Nucleic Acids Res. 2019 Feb 20;47(3):1178-1194. doi: 10.1093/nar/gky1316. Nucleic Acids Res. 2019. PMID: 30624727 Free PMC article.
-
Structural Analysis of the Active Site and DNA Binding of Human Cytidine Deaminase APOBEC3B.J Chem Theory Comput. 2019 Jan 8;15(1):637-647. doi: 10.1021/acs.jctc.8b00545. Epub 2018 Dec 11. J Chem Theory Comput. 2019. PMID: 30457868 Free PMC article.
-
Comprehensive analysis of mutational signatures reveals distinct patterns and molecular processes across 27 pediatric cancers.Nat Cancer. 2023 Feb;4(2):276-289. doi: 10.1038/s43018-022-00509-4. Epub 2023 Jan 26. Nat Cancer. 2023. PMID: 36702933 Free PMC article.
References
-
- Chiu Y.L., Greene W.C.. The APOBEC3 cytidine deaminases: an innate defensive network opposing exogenous retroviruses and endogenous retroelements. Annu. Rev. Immunol. 2008; 26:317–353. - PubMed
-
- Franchini D.M., Petersen-Mahrt S.K.. AID and APOBEC deaminases: balancing DNA damage in epigenetics and immunity. Epigenomics. 2014; 6:427–443. - PubMed
-
- Ramiro A.R., Barreto V.M.. Activation-induced cytidine deaminase and active cytidine demethylation. Trends Biochem. Sci. 2015; 40:172–181. - PubMed
MeSH terms
Substances
Grants and funding
LinkOut - more resources
Full Text Sources
Other Literature Sources
Research Materials
Miscellaneous

