. 2017 Nov 2;45(19):11121-11130.
doi: 10.1093/nar/gkx728.

DNA residence time is a regulatory factor of transcription repression

Affiliations

DNA residence time is a regulatory factor of transcription repression

Karen Clauß et al. Nucleic Acids Res. .

Abstract

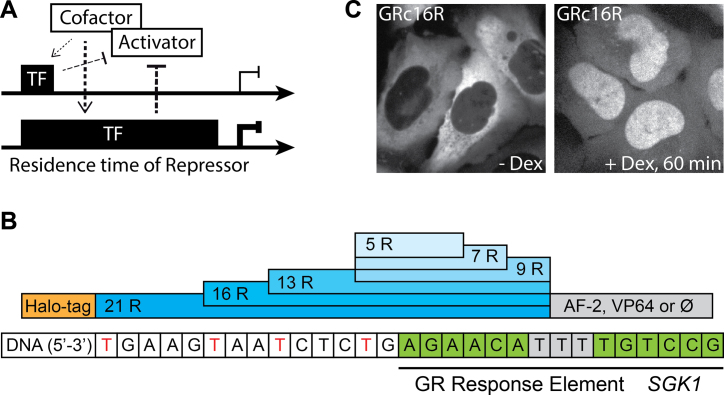
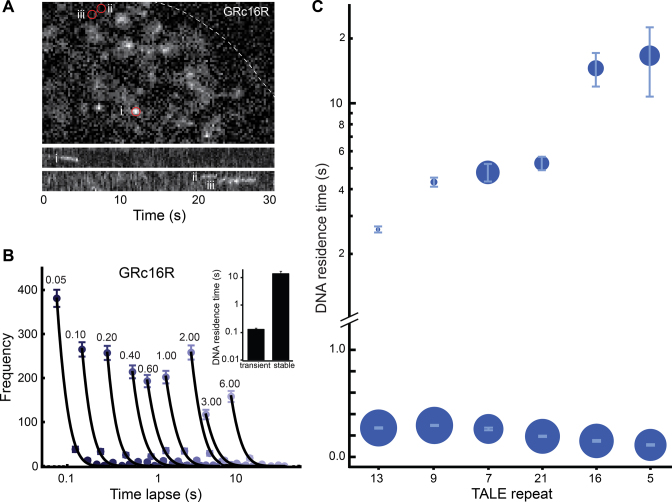
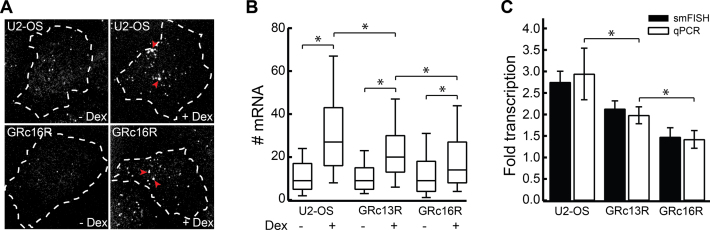
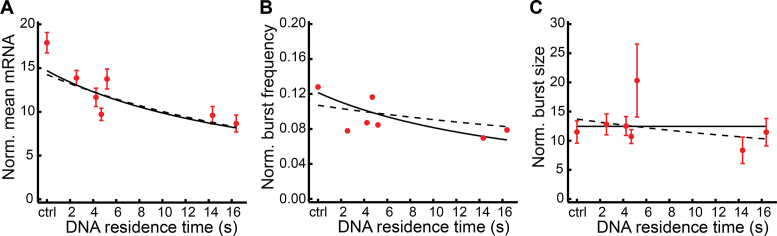
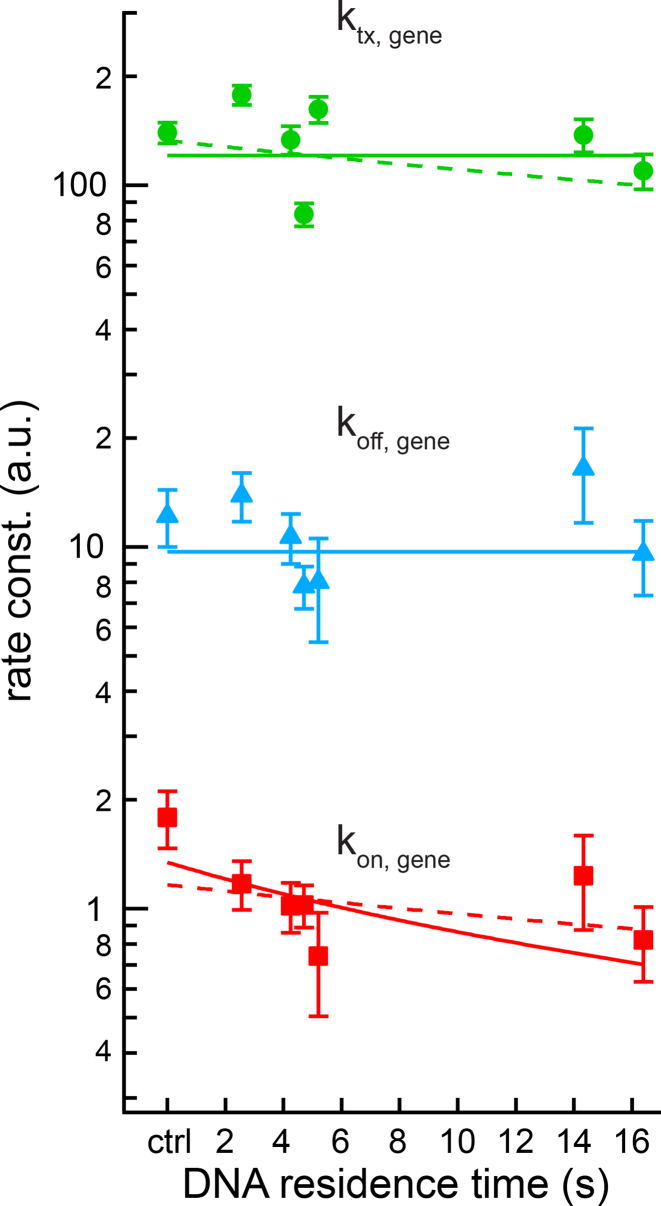
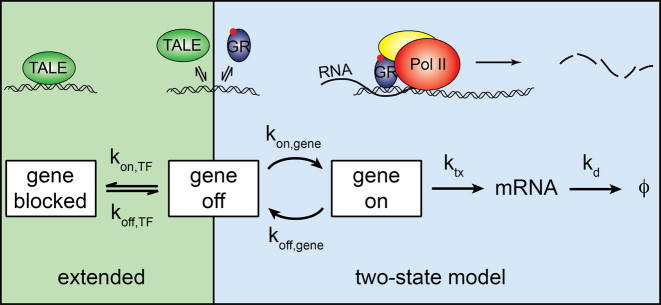
Transcription comprises a highly regulated sequence of intrinsically stochastic processes, resulting in bursts of transcription intermitted by quiescence. In transcription activation or repression, a transcription factor binds dynamically to DNA, with a residence time unique to each factor. Whether the DNA residence time is important in the transcription process is unclear. Here, we designed a series of transcription repressors differing in their DNA residence time by utilizing the modular DNA binding domain of transcription activator-like effectors (TALEs) and varying the number of nucleotide-recognizing repeat domains. We characterized the DNA residence times of our repressors in living cells using single molecule tracking. The residence times depended non-linearly on the number of repeat domains and differed by more than a factor of six. The factors provoked a residence time-dependent decrease in transcript level of the glucocorticoid receptor-activated gene SGK1. Down regulation of transcription was due to a lower burst frequency in the presence of long binding repressors and is in accordance with a model of competitive inhibition of endogenous activator binding. Our single molecule experiments reveal transcription factor DNA residence time as a regulatory factor controlling transcription repression and establish TALE-DNA binding domains as tools for the temporal dissection of transcription regulation.


Figures

Figure 1.
Figure 1.
Design of TALE-TF constructs. (A) Potential regulatory effect of transcription factor (TF) DNA residence time on gene transcription. Long DNA binding of a transcription repressor might lead to enhanced repression efficiency compared to short DNA binding due to more efficient competitive inhibition of an activator or recruitment of co-factors. (B) Domain structure of the TALE-based TFs. After a N-terminal HaloTag varying numbers of TALE DBD repeat domains recognizing the GR response element of SGK1 are inserted, followed by a C-terminal domain (AF-2 of GR or VP64) or no domain (⊘). (C) U2-OS cells expressing GRc16R labeled with TMR in the absence (left panel) and presence (right panel) of 1 μM Dex.
Figure 2.
Figure 2.
DNA residence times of GRcXR are dependent on the number of TALE repeat domains. (A) Upper panel: fluorescence image of TMR-labeled GRc16R in a U2-OS cell nucleus (dashed line) upon induction with 1 μM Dex and 561 nm laser excitation at 50 ms camera integration time. The image is taken from Movie S1. Lower panels: kymographs of regions (i)–(iii) highlighted by circles in the upper panel. (B) Histograms of fluorescent ‘on’ times of TMR-labeled GRc16R at different time-lapse conditions (n = 442 (0.05 s); n = 313 (0.10 s); n = 315 (0.20 s); n = 260 (0.40 s); n = 248 (0.60 s); n = 255 (1.00 s); n = 306 (2.00 s); n = 142 (3.00 s); n = 183 (6.00 s)). Numbers denote the time-lapse time in s. Lines are a global fit by an exponential decay model with two off-rate constants (Equation (14) in Supplementary Information). Inset: DNA residence times of GRc16R extracted from the fit. Error bars denote s.d. (C) DNA residence times of GRcXR. The symbol area is proportional to the frequency of molecules entering a binding mode with the corresponding DNA residence time. GRcXR constructs are ordered by increasing DNA residence time of the long binding population. Error bars denote s.d.
Figure 3.
Figure 3.
GRc13R and GRc16R repress SGK1 transcription. (A) smFISH of SGK1 mRNA in wild-type U2-OS cells (upper panels) and U2-OS cells expressing GRc16R (lower panels) in the absence (left panels) and presence (right panels) of 1 μM Dex. Dashed lines indicate the nuclear membrane. Arrowheads highlight loci of nascent transcription. The contrast was adjusted individually for each panel. (B) mRNA distributions in wild-type U2-OS cells and U2-OS cells expressing GRc13R and GRc16R in absence and presence of 1 μM Dex. (*) indicates a significant difference according to the Wilcoxon–Mann–Whitney two-sample rank test, two tailed, P < 0.05. (C) Fold change of transcription calculated as ratio between the mean number of mRNA molecules upon Dex induction and the mean number of mRNA molecules in absence of Dex for wild-type U2-OS cells (308/304 cells) and U2-OS cells expressing GRc13R (308/294 cells) and (GRc16R (270/211 cells), or from qPCR experiments (triplicates on at least three biological replicates). (*) indicates a significant difference according to Student's t-test, two-tailed, P < 0.05. Error bars denote s.e.m. (smFISH) or s.d. (qPCR).
Figure 4.
Figure 4.
Repression of SGK1 transcription increases with GRcXR DNA residence time. (A) Normalized mean number of SGK1 mRNA molecules as function of DNA residence time in wild-type U2-OS cells as control (ctrl) and U2-OS cells expressing GRcXR (spheres, 308/304, 308/294, 296/316, 267/274, 167/157, 270/211 and 290/283 cells). Error bars denote s.e.m. (B) Normalized burst frequency of SGK1 transcription as function of GRcXR DNA residence time. Cell numbers are as in (A). (C) Normalized burst size of SGK1 transcription as function of GRcXR DNA residence time (70/19, 51/28, 53/29, 69/34, 22/7, 31/12 and 42/20 nascent sites). Error bars denote s.e.m. Lines are calculated based on a model in which the on-rate constant of a two-state gene transcription model is a function of GRcXR DNA residence time (continuous lines) or in which both the on-rate constant and the transcription rate constant are a function of GRcXR DNA residence time (dashed lines).
Figure 5.
Figure 5.
Rate constants of the two-state model of SGK1 transcription. On-rate constant (squares), off-rate constant (triangles) and transcription rate constant (spheres) were calculated from the measured values of mean SGK1 mRNA, burst frequency and burst size (Figure 4A–C), refer to one allele, are normalized to the SGK1 degradation rate constant and are plotted as function of GRcXR DNA residence time (ctrl denotes wild-type U2-OS cells without GRcXR expression) (Supplementary Information). Error bars denote s.e.m. Lines are fits based on a model in which the on-rate constant is a function of GRcXR DNA residence time (Equation (12) in Supplementary Information, reduced formula image) and off-rate and transcription rate are constant with respect to GRcXR DNA residence time (continuous lines) or a global fit in which both the on-rate constant and the transcription rate constant are a function of GRcXR DNA residence time (Equations (12) and (13) in Supplementary Information, reduced formula image) and the off-rate is constant with respect to GRcXR DNA residence time (dashed line).
Figure 6.
Figure 6.
Model of SGK1 transcription repression by TALE-TF constructs. TALE-TF binds to and unbinds from the GRE of SGK1 with rate constants formula image and formula image competitive to endogenous GR. If TALE-TF is bound, it prevents gene activation by competitive inhibition of GR DNA binding, and the gene assumes a blocked state (left shade) in addition to the ‘off’- and ‘on’-states of the two-state model of gene transcription (right shade). formula image: rate constant of SGK1 activation, formula image: rate constant of SGK1 deactivation, formula image: transcription rate constant of SGK1, formula image: degradation rate constant of SGK1. Cartoons illustrate the different states of the extended two-state model.

References

    1. Voss T.C., Hager G.L.. Dynamic regulation of transcriptional states by chromatin and transcription factors. Nat. Rev. Genet. 2013; 15:69–81. - PMC - PubMed
    1. Levine M., Manley J.L.. Transcriptional repression of eukaryotic promoters. Cell. 1989; 59:405–408. - PubMed
    1. Gaston K., Jayaraman P.S.. Transcriptional repression in eukaryotes: repressors and repression mechanisms. Cell. Mol. Life Sci. 2003; 60:721–741. - PMC - PubMed
    1. Payankaulam S., Li L.M., Arnosti D.N.. Transcriptional repression: conserved and evolved features. Curr. Biol. 2010; 20:R764–R771. - PMC - PubMed
    1. Hager G.L., McNally J.G., Misteli T.. Transcription dynamics. Mol. Cell. 2009; 35:741–753. - PMC - PubMed

MeSH terms

Substances

LinkOut - more resources