. 2017 Nov 2;45(19):11356-11370.
doi: 10.1093/nar/gkx778.

N6-methyladenosine demethylase FTO targets pre-mRNAs and regulates alternative splicing and 3'-end processing

Affiliations

N6-methyladenosine demethylase FTO targets pre-mRNAs and regulates alternative splicing and 3'-end processing

Marek Bartosovic et al. Nucleic Acids Res. .

Abstract

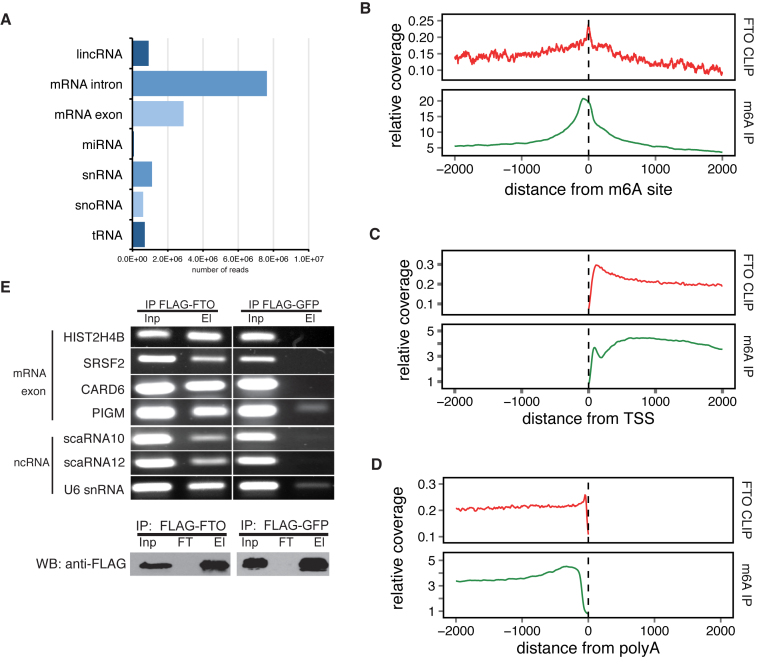
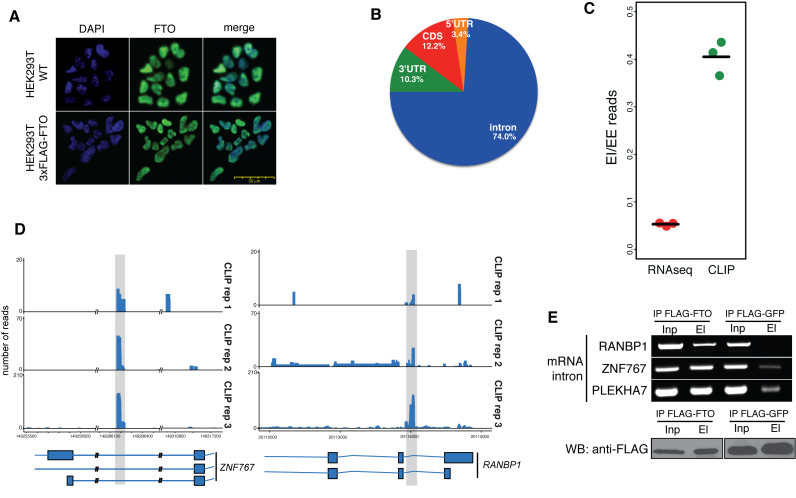
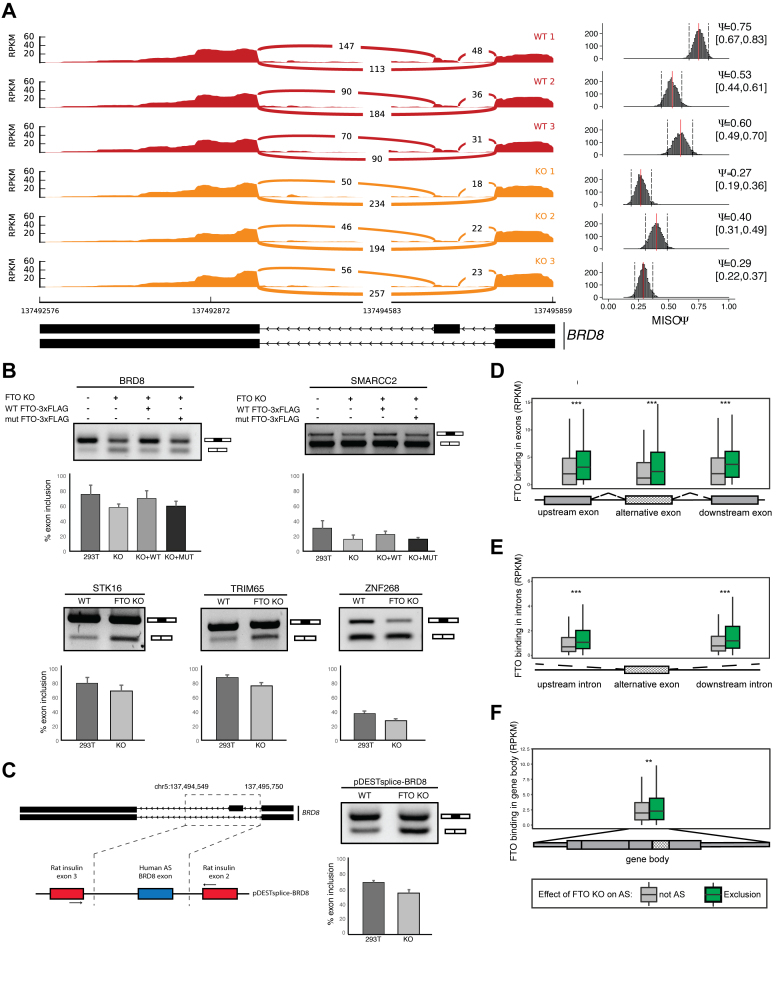
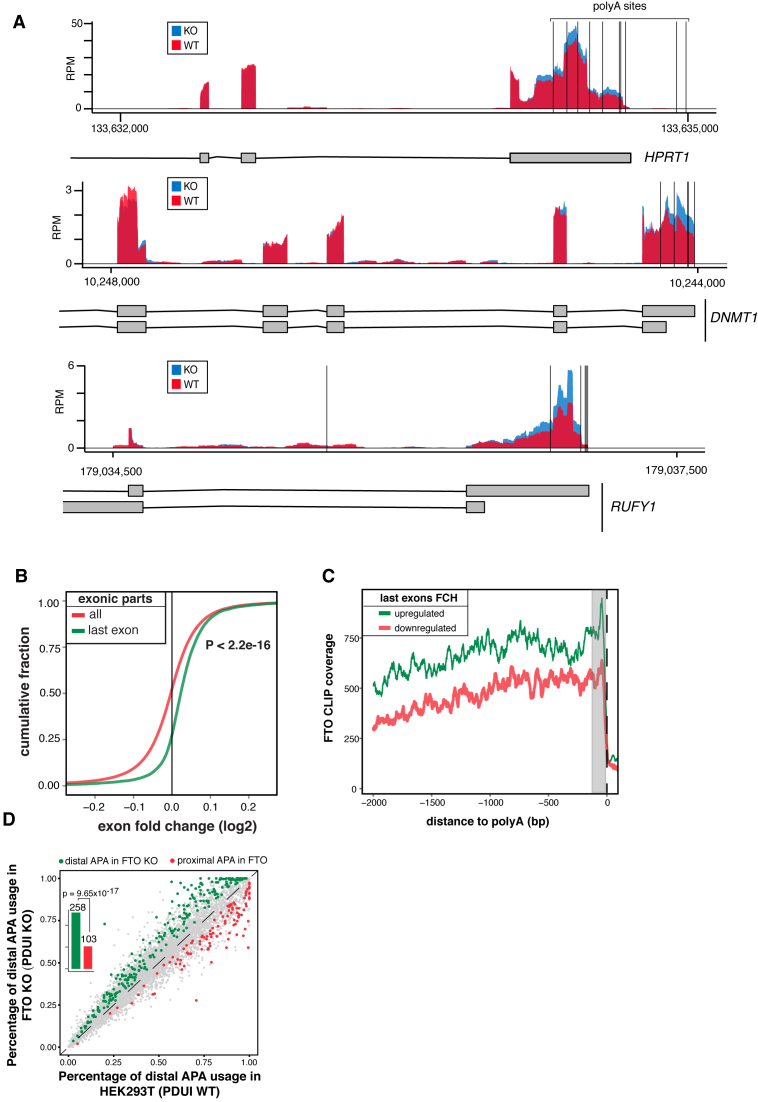
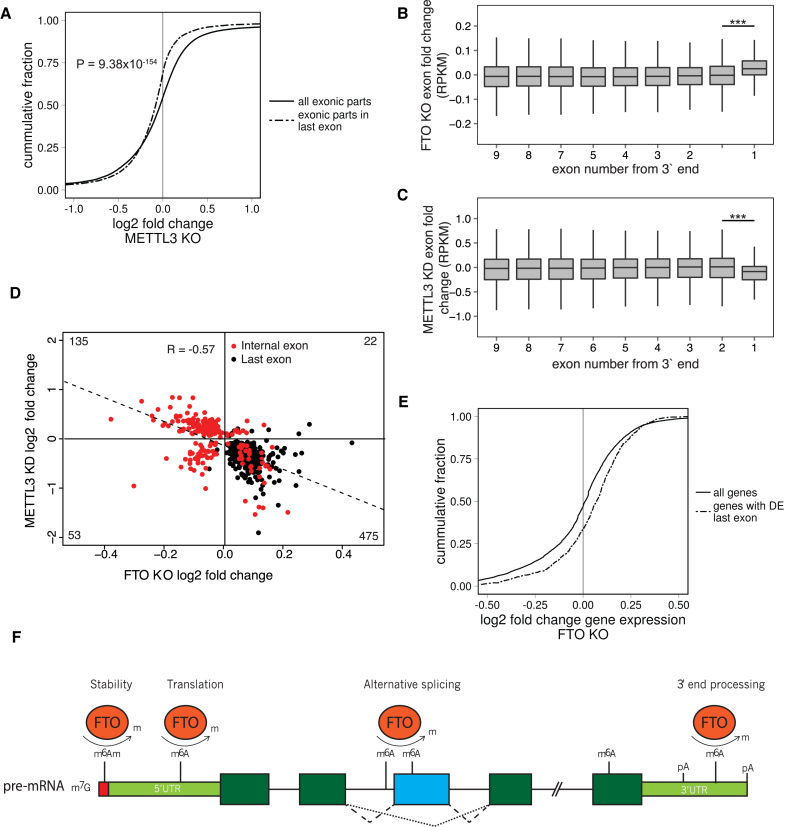
N6-methyladenosine (m6A) is the most abundant base modification found in messenger RNAs (mRNAs). The discovery of FTO as the first m6A mRNA demethylase established the concept of reversible RNA modification. Here, we present a comprehensive transcriptome-wide analysis of RNA demethylation and uncover FTO as a potent regulator of nuclear mRNA processing events such as alternative splicing and 3΄ end mRNA processing. We show that FTO binds preferentially to pre-mRNAs in intronic regions, in the proximity of alternatively spliced (AS) exons and poly(A) sites. FTO knockout (KO) results in substantial changes in pre-mRNA splicing with prevalence of exon skipping events. The alternative splicing effects of FTO KO anti-correlate with METTL3 knockdown suggesting the involvement of m6A. Besides, deletion of intronic region that contains m6A-linked DRACH motifs partially rescues the FTO KO phenotype in a reporter system. All together, we demonstrate that the splicing effects of FTO are dependent on the catalytic activity in vivo and are mediated by m6A. Our results reveal for the first time the dynamic connection between FTO RNA binding and demethylation activity that influences several mRNA processing events.


Figures

Figure 1.
Figure 1.
Identification of FTO targets by CLIP-seq analysis. (A) The distribution of CLIP-seq reads among individual RNA classes. Reads were categorized according to the priority table (See methods) (B–D) Metagene distribution of FTO CLIP and m6A-seq reads around positions of m6A (B), transcription start site (TSS) (C) and poly(A) sites (D). (E) RNA IP confirmation of FTO binding to RNAs identified by CLIP-seq (upper panel). Representative exonic and ncRNA binding sites were selected and gene names are indicated on the left. Western blot analysis of FLAG-FTO immunoprecipitation (IP) efficiency (lower panel). FLAG-GFP was used as a background control. Inp is the whole cell lysate. El is the bound fraction. FT (Flow-through) is the unbound fraction.
Figure 2.
Figure 2.
FTO binds pre-mRNAs in the nucleus. (A) Endogenous FTO and ectopically expressed FLAG-tagged FTO localize to the nucleus in 293T cells. Immunofluorescence detection with anti-FTO antibodies (Green). DNA is stained with DAPI (Blue) (B) Piechart representation of the percentage of CLIP-Seq reads corresponding to particular regions of pre-mRNAs (C) Comparison of the fraction of sequencing reads spanning exon-exon (EE) junctions relative to exon-intron junctions (EI) in FTO CLIP-seq and total RNA-seq. (D) Examples of FTO binding in intronic mRNA regions. Shaded regions highlight FTO binding sites. (E) RIP-PCR confirmation of FTO binding to intronic regions in genes selected based on CLIP-Seq binding sites (upper panel). Western blot (WB) analysis of FLAG-FTO immunoprecipitation (IP) (lower panel). FLAG-GFP was used as a background control. Inp is the whole cell lysate. El is the bound fraction.
Figure 3.
Figure 3.
FTO KO cells display significant changes in expression of protein-coding genes (A) Western blot analysis of FTO expression in control 293T (WT) and FTO KO cell lines. (B) Scatter plot of gene expression in 293T (WT) and FTO KO cell lines. Significantly differentially expressed genes are colored with red (upregulated) and green (downregulated) (C) RT-qPCR analysis of gene expression for genes selected based on RNA-seq differential expression. Bars represent the mean of three biological replicates normalized to the expression of HPRT1 as an internal control and error bars represent standard deviation. Asterisks denote the significance of DE expression measured by qPCR: *P < 0.1, **P < 0.05, ***P < 0.001, n.s. not significant; P-values were calculated by a two-tailed paired Student's t-test (D) Cumulative distribution function of the differential expression of all genes (red) compared to FTO-bound genes identified by CLIP-seq (green).
Figure 4.
Figure 4.
FTO depletion leads to exon skipping events. (A) Graphical representation of RNAseq (sashimi plot) in control and FTO KO cells in a region containing alternative isoforms observed in FTO KO. Histogram of PSI (Percent spliced in) calculated by MISO is shown in the right of the sashimi plot. Ψ represents mean value and 0.95 percent confidence interval is shown in the square brackets. A scheme showing the annotated alternative splice isoforms of BRD8 mRNA is shown below the graphs. (B) Confirmation of the exon skipping events in FTO KO by RT-PCR. PCR primers anneal to exons flanking the skipped exon. The exon inclusion level was examined in 293T cells (WT), 293T cells with KO of both copies of FTO (FTO KO) and rescue cell lines with either WT FTO (KO+WT) or HADA mutant FTO (KO+MUT). (C) The alternative splicing phenotype in 293T cells upon FTO KO is reproduced with a minigene reporter construct (scheme is depicted on the left). The BRD8 exon 20/21 inclusion level was analyzed by RT-PCR from 3 biological replicates. (D–F) Boxplots showing the metagene distribution of FTO binding (RPKM) in the proximity of the 200 most significantly skipped exons. Boxes represent binding in (D) flanking exons, (E) flanking introns or (F) the whole gene body. Asterisks denote significance **P < 1 × 10⁻⁶, ***P < 1 × 10⁻⁸. P-values were calculated by Mann–Whitney U-test.
Figure 5.
Figure 5.
FTO KO leads to upregulation of extended 3′ UTRs (A) Genome browser examples of reads coverage in 293T WT and FTO KO cell lines in genes with changes in expression in the last exon. Vertical black lines represent the position of the annotated alternative poly(A) sites. (B) Cumulative distribution of expression of all exonic parts and last exons calculated by DEXseq. P value was estimated by Mann-Whitney U-test. (C) Metagene analysis of FTO CLIP read coverage around poly(A) sites of genes with upregulated (green) and downregulated (red) 3′ ends. (D) Scatterplot of percentage of distal poly(A) site usage index (PDUI) of 239T WT and FTO KO cell lines. Barplots summarize the number of APA usage events in FTO KO.
Figure 6.
Figure 6.
FTO and METTL3 deficient cell lines show anti-correlated 3′ UTR expression phenotype. (A) Cumulative distribution of expression of all exonic parts and exonic parts originating from last exons in METTL3 KD as calculated by DEXseq. P value is estimated by the Mann-Whitney U-test. (B, C) Boxplot showing differential expression of exonic parts in FTO KO (B) and METTL3 KD (C) based on the exon number from the 3′ end. Significance was calculated by a two-tailed t test. ***P < 1 × 10⁻²⁰. (D) Scatterplot of expression change of exons that were called differentially expressed by DEXSeq in both FTO KO and METTL3 KD. R represents the Pearson correlation coefficient. (E) Cumulative distribution of differential expression of genes which have significantly changed expression of their 3′ terminal exonic part. P value is estimated by the Mann-Whitney U-test. (F). Schematic summary of the reported roles of FTO-dependent m6A and m6Am modifications. Reversible m6Am modification of the nucleotide adjacent to the 7-methylguanosine cap affects mRNA stability (60) and reversible m6A modification on the 5′UTR promotes cap-independent translation initiation under stress conditions (–25). At the pre-mRNA body, FTO regulated m6A modification promotes exon inclusion/skipping, likely depending on the cellular context and interacting splicing factors (19,21). At the 3′UTR, FTO dependent m6A modification potentially regulates APA usage and the length of 3′UTR.

References

    1. Meyer K.D., Saletore Y., Zumbo P., Elemento O., Mason C.E., Jaffrey S.R.. Comprehensive analysis of mRNA methylation reveals enrichment in 3′ UTRs and near stop codons. Cell. 2012; 149:1635–1646. - PMC - PubMed
    1. Dominissini D., Moshitch-Moshkovitz S., Schwartz S., Salmon-Divon M., Ungar L., Osenberg S., Cesarkas K., Jacob-Hirsch J., Amariglio N., Kupiec M. et al. . Topology of the human and mouse m6A RNA methylomes revealed by m6A-seq. Nature. 2012; 485:201–206. - PubMed
    1. Wang Y., Li Y., Toth J.I., Petroski M.D., Zhang Z., Zhao J.C.. N6-methyladenosine modification destabilizes developmental regulators in embryonic stem cells. Nat. Cell Biol. 2014; 16:191–198. - PMC - PubMed
    1. Wang X., Lu Z., Gomez A., Hon G.C., Yue Y., Han D., Fu Y., Parisien M., Dai Q., Jia G. et al. . N6-methyladenosine-dependent regulation of messenger RNA stability. Nature. 2014; 505:117–120. - PMC - PubMed
    1. Schwartz S., Mumbach M.R., Jovanovic M., Wang T., Maciag K., Bushkin G.G., Mertins P., Ter-Ovanesyan D., Habib N., Cacchiarelli D. et al. . Perturbation of m6A writers reveals two distinct classes of mRNA methylation at internal and 5′ sites. Cell Rep. 2014; 8:284–296. - PMC - PubMed

MeSH terms