. 2017 Nov 2;45(19):e162.
doi: 10.1093/nar/gkx712.

Chromosome-scale mega-haplotypes enable digital karyotyping of cancer aneuploidy

Affiliations

Chromosome-scale mega-haplotypes enable digital karyotyping of cancer aneuploidy

John M Bell et al. Nucleic Acids Res. .

Abstract

Genomic instability is a frequently occurring feature of cancer that involves large-scale structural alterations. These somatic changes in chromosome structure include duplication of entire chromosome arms and aneuploidy where chromosomes are duplicated beyond normal diploid content. However, the accurate determination of aneuploidy events in cancer genomes is a challenge. Recent advances in sequencing technology allow the characterization of haplotypes that extend megabases along the human genome using high molecular weight (HMW) DNA. For this study, we employed a library preparation method in which sequence reads have barcodes linked to single HMW DNA molecules. Barcode-linked reads are used to generate extended haplotypes on the order of megabases. We developed a method that leverages haplotypes to identify chromosomal segmental alterations in cancer and uses this information to join haplotypes together, thus extending the range of phased variants. With this approach, we identified mega-haplotypes that encompass entire chromosome arms. We characterized the chromosomal arm changes and aneuploidy events in a manner that offers similar information as a traditional karyotype but with the benefit of DNA sequence resolution. We applied this approach to characterize aneuploidy and chromosomal alterations from a series of primary colorectal cancers.


Figures

Figure 1.
Figure 1.
Overview of linked read sequencing and mega-haplotype analysis. (A) HMW DNA molecules are partitioned into droplets; within the droplets the molecules are associated with unique barcodes and amplified. Then, the partitions are dissolved, sequencing libraries are prepared and Illumina sequencing is performed as usual. After base-calling, the HMW molecules can be reconstructed via the barcodes and then scaffolded together to produce phase blocks. (B) Samples were first sequenced and aligned using conventional short read paired-end sequencing and variant calling was performed with GATK to generate a list of high-quality single nucleotide variant (SNV) calls. The same samples then underwent library preparation with GemCode or Chromium Genome kits (Table 1) and were sequenced. The Long Ranger software was run, using the previously generated SNV calls as reference variants. The phased SNV calls generated by Long Ranger served as input for the mega-haplotyping method.
Figure 2.
Figure 2.
Summary of analysis method. After sequencing, variant files were processed to produce phase blocks (with at least 100 heterozygous phased SNVs). (A) Unique barcodes were counted for each haplotype of each phase block across the chromosome arm. (B) Blocks were normalized by dividing the number of unique barcodes per block by the number of single nucleotide polymorphism (SNPs) per block and non-normal samples were normalized by multiplying each block total by (total unique barcodes in normal sample)/(total unique barcodes in non-normal sample). (C) For each block in each sample, the differencebetween blocks in major and minor haplotypes was calculated. (D) Density distributions of Δ are used to perform a one-sided t-test (with a Bonferroni-adjusted P-value of .001) between normal and tumor, represented byD. (E) For all chromosome arms with P < .001, non-normal blocks are tested against the 97.5% upper confidence limit (v) of the normal Δ distribution. If they fall below this limit, they are not called. For regions >1Mb that pass these tests, the haplotypes are combined across the large blocks to produce mega-haplotypes.
Figure 3.
Figure 3.
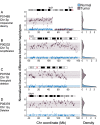
Mega-haplotypes of different samples. The x-axis denotes megabases; the y-axis shows the difference between major and minor haplotypes for each block, normalized for SNV density. The blue blocks indicate the difference between major and minor haplotypes in the normal sample; the dark blocks indicate the difference in the malignant sample. For each sample shown, the density plot to the right reflects the distribution of the haplotype differences. These density distributions are used for the t-test of significant differences. (A) Difference between haplotypes across the only multiple-megabase imbalanced region in Patient 1465. No copy number variation (CNV) is detected in this sample, showing this to be a case of uniparental disomy. (B) Mega-haplotype of the 7q region of Patient 232. Here the imbalance reflects an amplification in Patient 232’s malignant lesion, and the mega-haplotype extends across the entirety of the chromosome arm. (C) Difference between haplotypes across chromosome 18 of Patient 1532. This is a case of aneuploidy as the entire chromosome has been deleted in the tumor. (D) A deletion in the 12q arm of Patient 5378, from a sample of a brain metastasis of a colorectal cancer.
Figure 4.
Figure 4.
Imbalance in terms of copy number in a brain metastasis. This circos plot shows chromosome arms where a large imbalance (>50% of the arm) was called by our method. The X chromosome is included as Patient 5378 was female. The colors reflect the proportion of the haplotype relative to the the entire genome for each haplotype independently. For instance, chromosome X shows amplifications in both haplotypes although the more affected haplotype varies between arms. Chromosome 18 shows deletions of both haplotypes and both arms, with the greatest effect on the minor haplotype of the q arm.

References

    1. Sudmant P.H., Rausch T., Gardner E.J., Handsaker R.E., Abyzov A., Huddleston J., Zhang Y., Ye K., Jun G., Hsi-Yang Fritz M. et al. . An integrated map of structural variation in 2,504 human genomes. Nature. 2015; 526:75–81. - PMC - PubMed
    1. Grimwade D., Walker H., Oliver F., Wheatley K., Harrison C., Harrison G., Rees J., Hann I., Stevens R., Burnett A. et al. . The importance of diagnostic cytogenetics on outcome in AML: analysis of 1,612 patients entered into the MRC AML 10 trial. Blood. 1998; 92:2322–2333. - PubMed
    1. Slovak M.L., Kopecky K.J., Cassileth P.A., Harrington D.H., Theil K.S., Mohamed A., Paietta E., Willman C.L., Head D.R., Rowe J.M. et al. . Karyotypic analysis predicts outcome of preremission and postremission therapy in adult acute myeloid leukemia: a Southwest Oncology Group/Eastern Cooperative Oncology Group study. Blood. 2000; 96:4075–4083. - PubMed
    1. Knutsen T., Padilla-Nash H.M., Wangsa D., Barenboim-Stapleton L., Camps J., McNeil N., Difilippantonio M.J., Ried T.. Definitive molecular cytogenetic characterization of 15 colorectal cancer cell lines. Genes chromosomes Cancer. 2010; 49:204–223. - PMC - PubMed
    1. Reddy U.M., Page G.P., Saade G.R., Silver R.M., Thorsten V.R., Parker C.B., Pinar H., Willinger M., Stoll B.J., Heim-Hall J. et al. . Karyotype versus microarray testing for genetic abnormalities after stillbirth. N. Engl. J. Med. 2012; 367:2185–2193. - PMC - PubMed