. 2017 Nov 1;56(11):1902-1917.
doi: 10.1093/rheumatology/kex270.

Population trends in the incidence and initial management of osteoarthritis: age-period-cohort analysis of the Clinical Practice Research Datalink, 1992-2013

Affiliations

Population trends in the incidence and initial management of osteoarthritis: age-period-cohort analysis of the Clinical Practice Research Datalink, 1992-2013

Dahai Yu et al. Rheumatology (Oxford). .

Abstract

Objective: To determine recent trends in the rate and management of new cases of OA presenting to primary healthcare using UK nationally representative data.

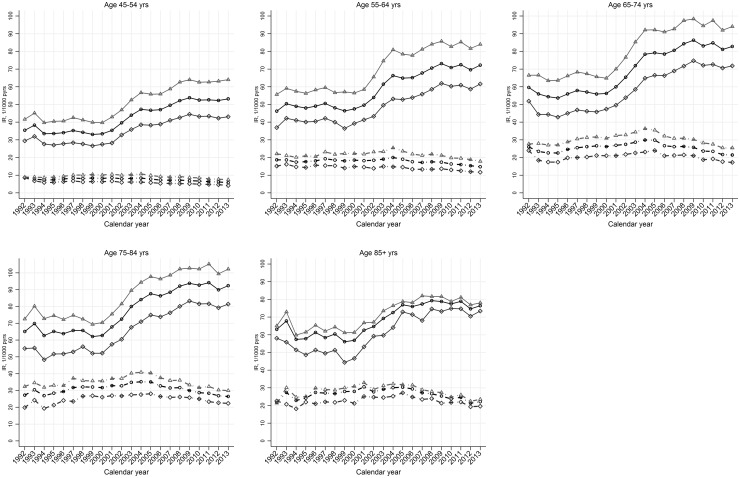
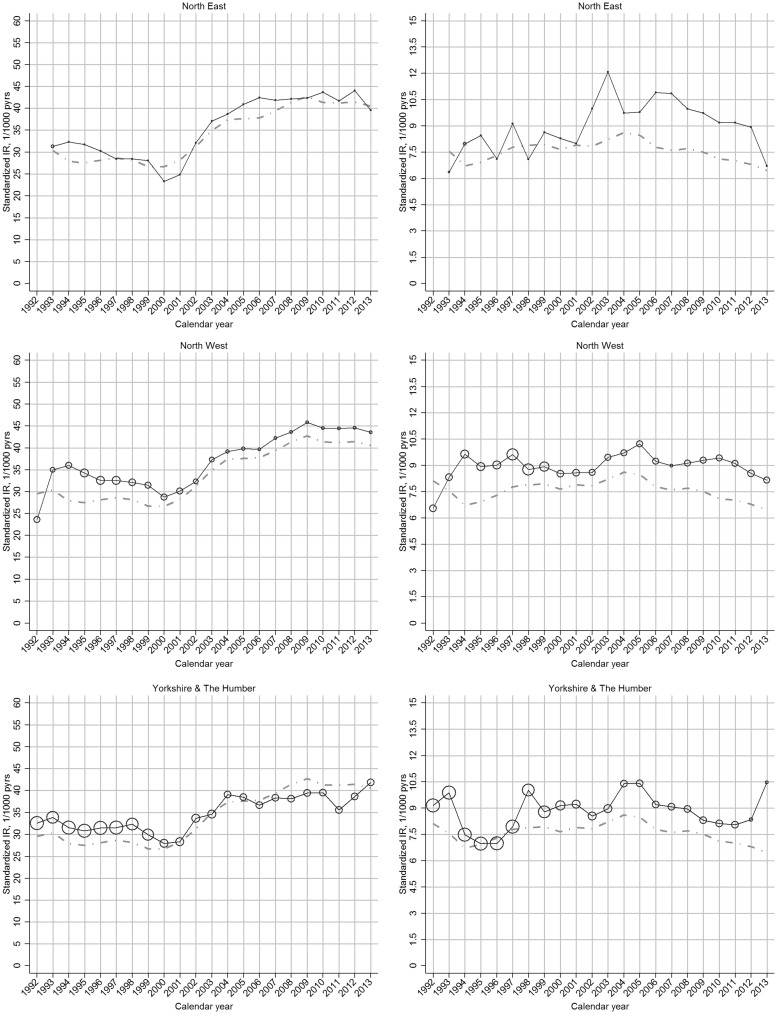
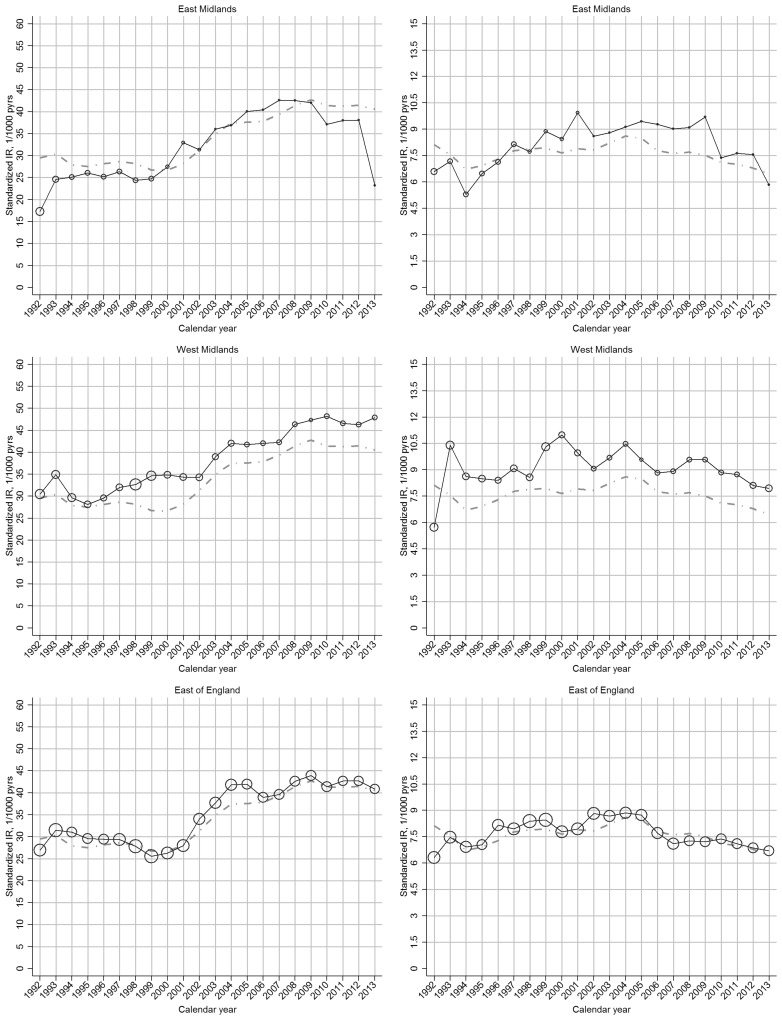
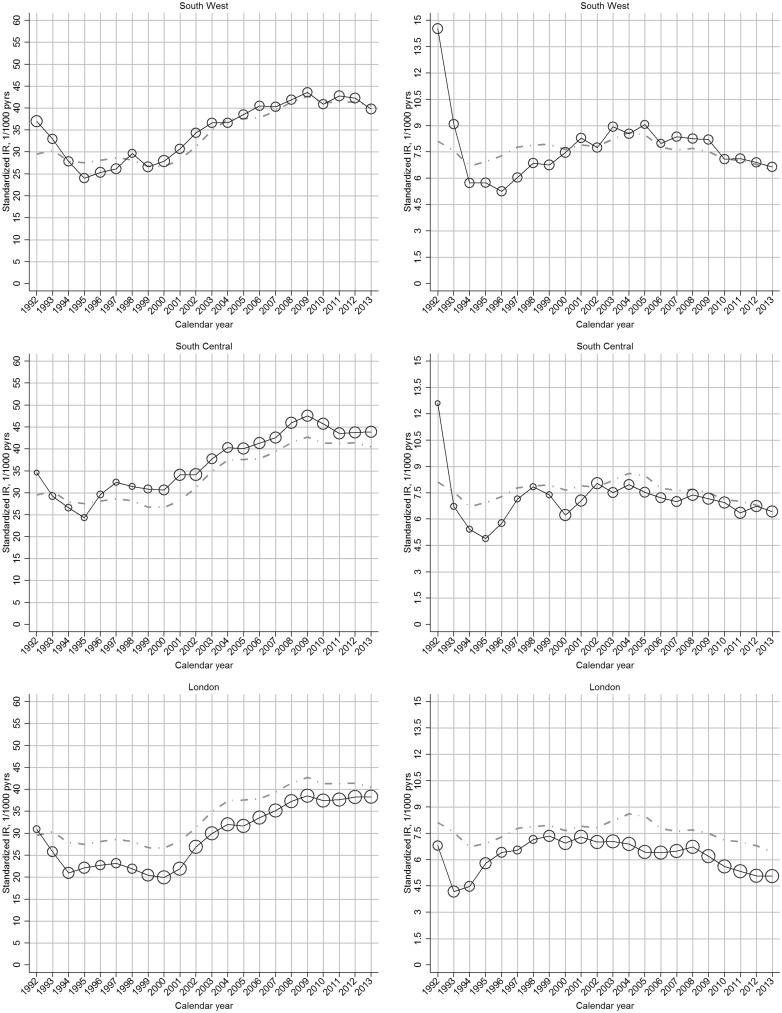
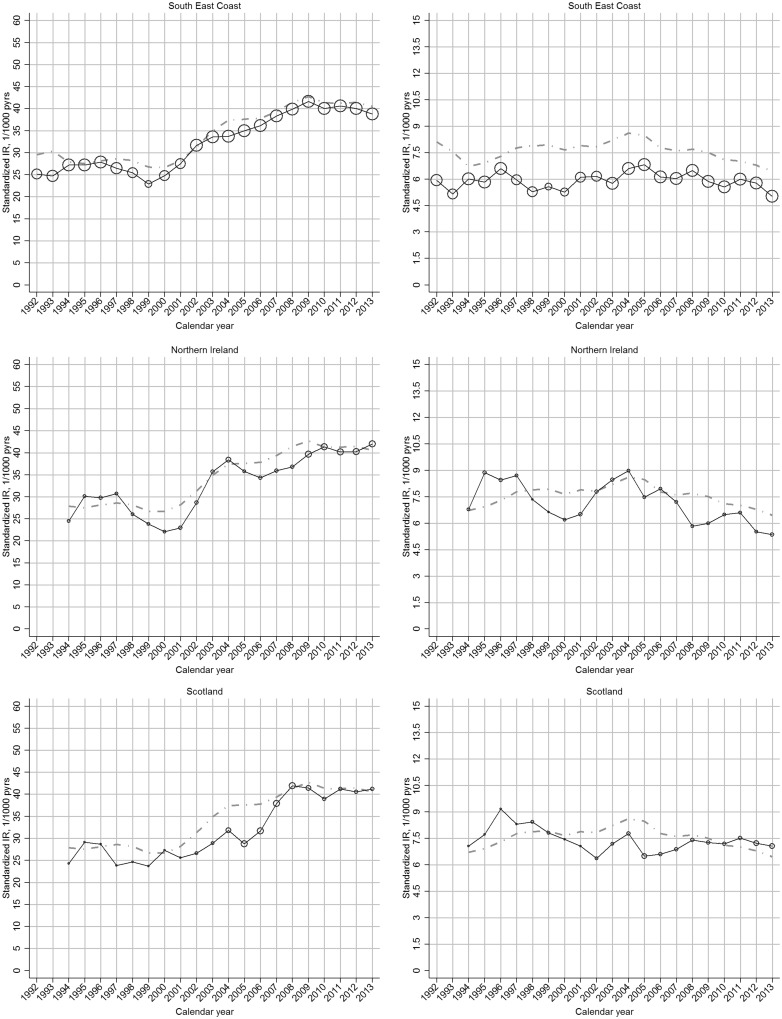
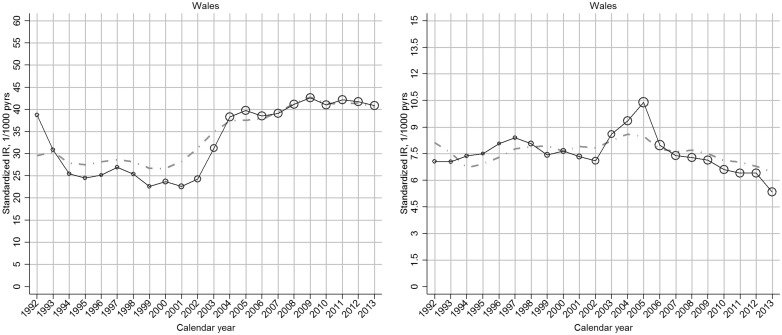
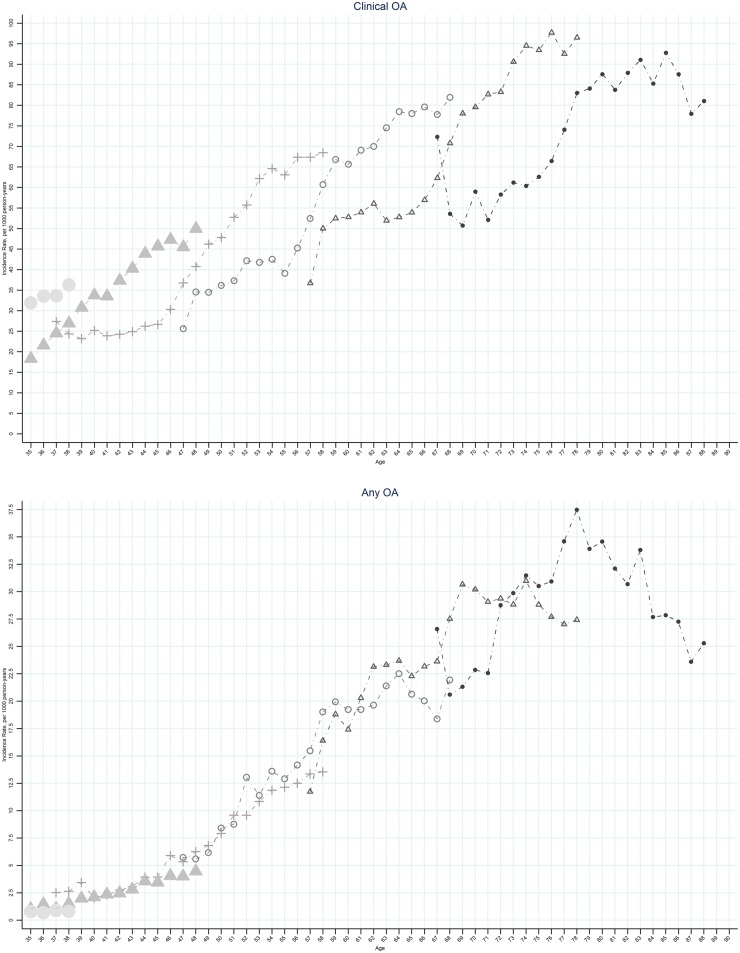
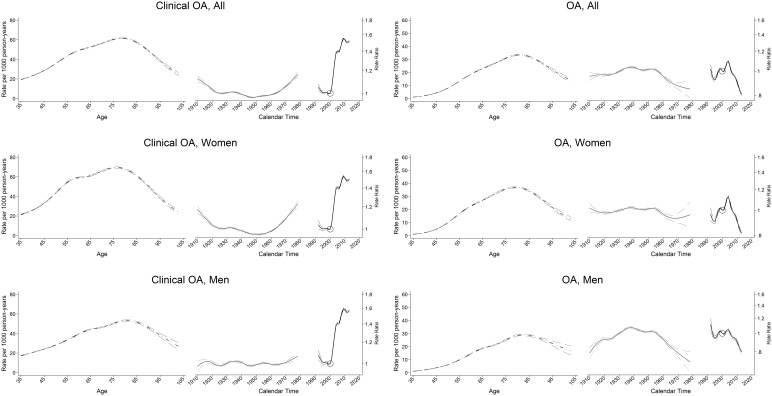
Methods: Using the Clinical Practice Research Datalink we identified new cases of diagnosed OA and clinical OA (including OA-relevant peripheral joint pain in those aged over 45 years) using established code lists. For both definitions we estimated annual incidence density using exact person-time, and undertook descriptive analysis and age-period-cohort modelling. Demographic characteristics and management were described for incident cases in each calendar year. Sensitivity analyses explored the robustness of the findings to key assumptions.

Results: Between 1992 and 2013 the annual age-sex standardized incidence rate for clinical OA increased from 29.2 to 40.5/1000 person-years. After controlling for period effects, the consultation incidence of clinical OA was higher for successive cohorts born after the mid-1950s, particularly women. In contrast, with the exception of hand OA, we observed no increase in the incidence of diagnosed OA: 8.6/1000 person-years in 2004 down to 6.3 in 2013. In 2013, 16.4% of clinical OA cases had an X-ray referral. While NSAID prescriptions fell from 2004, the proportion prescribed opioid analgesia rose markedly (0.1% of diagnosed OA in 1992 to 1.9% in 2013).

Conclusion: Rising rates of clinical OA, continued use of plain radiography and a shift towards opioid analgesic prescription are concerning. Our findings support the search for policies to tackle this common problem that promote joint pain prevention while avoiding excessive and inappropriate health care.

Keywords: analgesics; incidence; osteoarthritis; primary care.


Figures

F<sc>ig</sc>. 1
Fig. 1
Age-specific temporal trend in incidence rate of OA, by gender: UK, 1992–2013 Solid line and dotted line represent the incidence rates for clinical OA and OA, respectively. Light grey triangle, dark grey diamond and black circle indicate estimates for women, men and all, respectively.
F<sc>ig</sc>. 2
Fig. 2
Region-specific temporal trend in incidence rate of OA, by gender: UK, 1992–2013 Left panel: clinical OA; right panel: OA. In each plot, the black line represents the trend of overall incidence in the specific region; the grey line represents the general trend of overall incidence in the UK; the bubble size in each calendar year is determined by the proportion of the overall at-risk population within that region.
F<sc>ig</sc>. 3
Fig. 3
Age-specific incidence rate of OA, by selected birth cohorts: UK, 1992–2013 Left panel: clinical OA; right panel: OA. Small circle indicates the birth cohort 1925; small open triangle indicates the birth cohort 1935; small open circle indicates the births cohort 1945; plus symbol indicates the birth cohort 1955; large solid triangle indicates the birth cohort 1965; large solid circle indicates the birth cohort 1975.
F<sc>ig</sc>. 4
Fig. 4
Age-period-cohort influences on OA incidence, by gender: UK, 1992–2013 Left panel: clinical OA; right panel: OA. The age-specific rates (dark grey curve) are cross-sectional, referring to 2000 (open circle). Adjusted risk ratio (black curve) represents the period effect in 19922013, with 2000 as the reference. Adjusted risk ratio (light grey curve) represents the birth cohort from 1910 to 1980.

Comment in

References

    1. GBD 2015 DALYs and HALE Collaborators. Global, regional, and national disability-adjusted life-years (DALYs) for 315 diseases and injuries and healthy life expectancy (HALE), 1990-2015: a systematic analysis for the Global Burden of Disease Study 2015. Lancet 2016;388:1603–58. - PMC - PubMed
    1. Pabinger C, Geissler A.. Utilization rates of hip arthroplasty in OECD countries. Osteoarthritis Cartilage 2014;22:734–41. - PubMed
    1. Pabinger C, Lothaller H, Geissler A.. Utilization rates of knee-arthroplasty in OECD countries. Osteoarthritis Cartilage 2015;23:1664–73. - PubMed
    1. Kurtz SM, Lau E, Ong KL, Katz JN, Bozic KJ.. Universal health insurance coverage in Massachusetts did not change the trajectory of arthroplasty use or costs. Clin Orthop Relat Res 2016;474:1090–8. - PMC - PubMed
    1. Culliford DJ, Maskell J, Beard DJ. et al. Temporal trends in hip and knee replacement in the United Kingdom: 1991 to 2006. J Bone Joint Surg Br 2010;92:130–5. - PubMed

Publication types

Substances