. 2017 Oct 13;45(18):10403-10414.
doi: 10.1093/nar/gkx738.

Computational characterization of chromatin domain boundary-associated genomic elements

Affiliations

Computational characterization of chromatin domain boundary-associated genomic elements

Seungpyo Hong et al. Nucleic Acids Res. .

Abstract

Topologically associated domains (TADs) are 3D genomic structures with high internal interactions that play important roles in genome compaction and gene regulation. Their genomic locations and their association with CCCTC-binding factor (CTCF)-binding sites and transcription start sites (TSSs) were recently reported. However, the relationship between TADs and other genomic elements has not been systematically evaluated. This was addressed in the present study, with a focus on the enrichment of these genomic elements and their ability to predict the TAD boundary region. We found that consensus CTCF-binding sites were strongly associated with TAD boundaries as well as with the transcription factors (TFs) Zinc finger protein (ZNF)143 and Yin Yang (YY)1. TAD boundary-associated genomic elements include DNase I-hypersensitive sites, H3K36 trimethylation, TSSs, RNA polymerase II, and TFs such as Specificity protein 1, ZNF274 and SIX homeobox 5. Computational modeling with these genomic elements suggests that they have distinct roles in TAD boundary formation. We propose a structural model of TAD boundaries based on these findings that provides a basis for studying the mechanism of chromatin structure formation and gene regulation.


Figures

Figure 1.
Figure 1.
Dataset and schematic illustration of analytical approaches. (A) TADs were retrieved from a previously published study (10), and TAD boundaries were defined as the ends of TADs. The ±150-kb region of TAD boundaries were designated as boundary segments, and the same number of genomic regions located in the TAD—designated as TAD segments—were identified by randomly selecting locations within TADs. (B) Genomic distribution of boundary and TAD segments (the distribution in the whole region of analysis is shown in Supplementary Figure S1). (C) Signals corresponding to each genomic element were mapped onto the boundary and TAD segments. The collective distributions of genomic elements in these segments were compared in order to identify TAD boundary-enriched genomic elements. In another approach, signals in each segment were used to generate a predictive model that distinguishes boundary from TAD segments. The model was used to predict the relative importance and predictive power of genomic elements for TAD boundary formation.
Figure 2.
Figure 2.
TAD boundary enrichment. Positional distribution of each genomic element and its enrichment at TAD boundaries. (A) Enrichment of CTCF-binding sites at TAD boundaries. (B) Enrichment of TSS-HK at TAD boundaries. (C) Genomic elements with the 50 highest enrichment scores (the full list is shown in Supplementary Table S2).
Figure 3.
Figure 3.
TAD boundary prediction. Predictive power of position-specific linear models. (A) ROC curves of CTCF-based models. A 5-fold cross-validation approach was used; curves represent models constructed in each cross-validation procedure. (B) True and false positive ratios of CTCF-based models. Levels were measured at the threshold with the highest F1 score. (C) Coefficients of the CTCF model. (D) Top 50 genomic elements with the highest predictive power (the full list is shown in Supplementary Table S4).
Figure 4.
Figure 4.
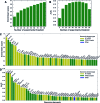
Consensus CTCF-associated genomic elements. (A) Dependency of enrichment score on the number of supporting experiments. (B) Dependency of predictive power on the number of supporting experiments. (C) Genomic elements enriched at consensus CTCFs. (D) Genomic elements predictive of consensus CTCFs (the full list is shown in Supplementary Table S5).
Figure 5.
Figure 5.
Combination of genomic elements. (A) TAD boundary prediction by the best multi-element models identified by PGSA. (B) Graphical representation of genomic elements identified by the PGSA approach. Each genomic element is represented as a node whose size and color are the ‘selection count’ and ‘persistence score’, respectively. Edges were drawn between two genomic elements used by top predictors and the width is the number of models supporting the relationship. (C) Genomic elements used in the top 10 models shown in a matrix-like format. Large columns enclosed by solid lines represent each optimization round, and contain 10 small columns corresponding to the top 10 models. Genomic elements used in a model or column are indicated by a green color. For example, the top-ranked model of the second optimization round, or that with three genomic elements, is composed of DNase and TSS-ALL.
Figure 6.
Figure 6.
Inference of positional preference. Coefficients of each genomic element in the PSLM. (A) Model constructed with four genomic elements (consensus CTCF, H3K36me3, TSS-ALL and DNase-Cluster). (B) Model with four additional genomic elements (RNA polymerase II, and TFs SP1, ZNF274 and SIX5).
Figure 7.
Figure 7.
Model of TAD boundary. CTCFs are highly enriched at boundaries of both contact domains and topologically associated domains. In particular, CTCF-binding sites found in multiple cell lines were closely associated with boundaries. Co-factors such as ZNF143 and YY1 may be involved in the association of the cohesin complex to these sites, whereby two distal regions would be in contact. Unlike contact domain boundaries, multiple CTCF-binding sites were observed at TAD boundaries. Other genomic elements including TSS, H3K36me3 and SIX5 were associated with these boundaries, and the chromatin would assume a more closed conformation. The association of TFs such as SIX5 at the boundaries and SP1 in TADs may have different structural effects on chromatin structure. Consequently, the binding of a distinct set of genomic elements and resultant structural changes in the chromatin would lead to the separation of the boundary and TAD regions; the former can then associate with each other, while two adjacent TADs can be more definitively separated from each other.

References

    1. Luger K., Mäder A.W., Richmond R.K., Sargent D.F., Richmond T.J.. Crystal structure of the nucleosome core particle at 2.8 A resolution. Nature. 1997; 389:251–260. - PubMed
    1. Cremer T., Cremer C.. Chromosome territories, nuclear architecture and gene regulation in mammalian cells. Nat. Rev. Genet. 2001; 2:292–301. - PubMed
    1. Cremer T., Cremer M.. Chromosome territories. Cold Spring Harb. Perspect. Biol. 2010; 2:a003889. - PMC - PubMed
    1. Lieberman-Aiden E., van Berkum N.L., Williams L., Imakaev M., Ragoczy T., Telling A., Amit I., Lajoie B.R., Sabo P.J., Dorschner M.O. et al. . Comprehensive mapping of long-range interactions reveals folding principles of the human genome. Science. 2009; 326:289–293. - PMC - PubMed
    1. Maeshima K., Ide S., Hibino K., Sasai M.. Liquid-like behavior of chromatin. Curr. Opin. Genet. Dev. 2016; 37:36–45. - PubMed

Publication types