

Hexarelin, a Growth Hormone Secretagogue, Improves Lipid Metabolic Aberrations in Nonobese Insulin-Resistant Male MKR Mice
- PMID: 28977588
- PMCID: PMC5659698
- DOI: 10.1210/en.2017-00168
Hexarelin, a Growth Hormone Secretagogue, Improves Lipid Metabolic Aberrations in Nonobese Insulin-Resistant Male MKR Mice
Abstract
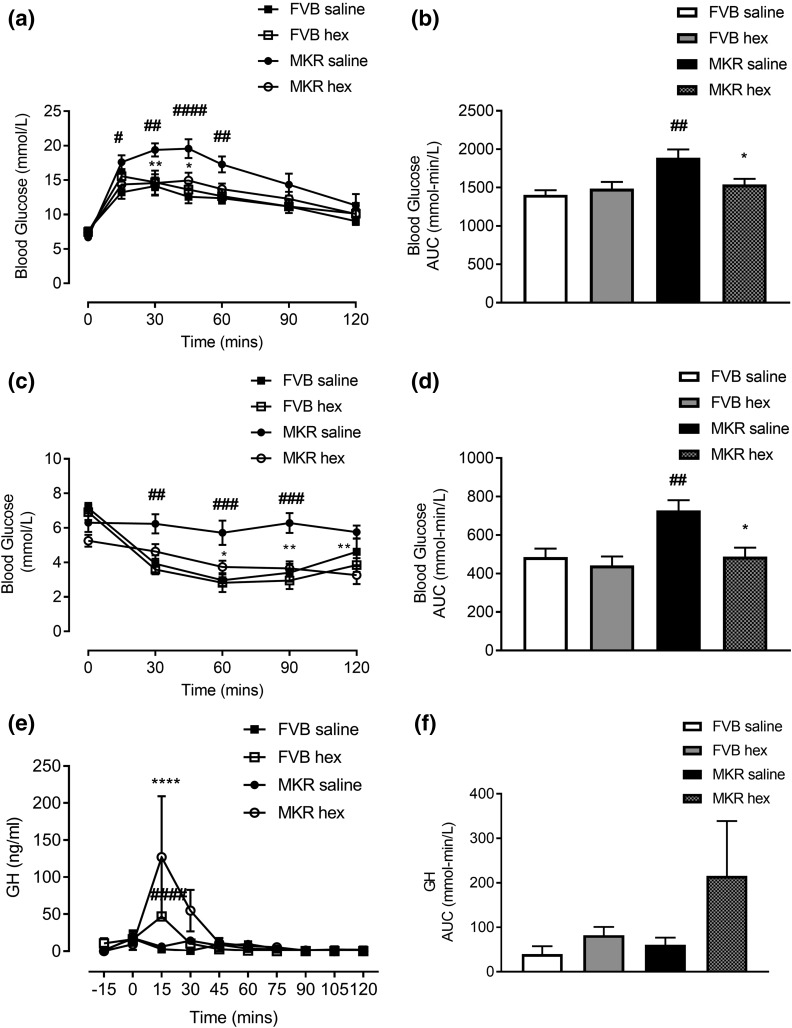
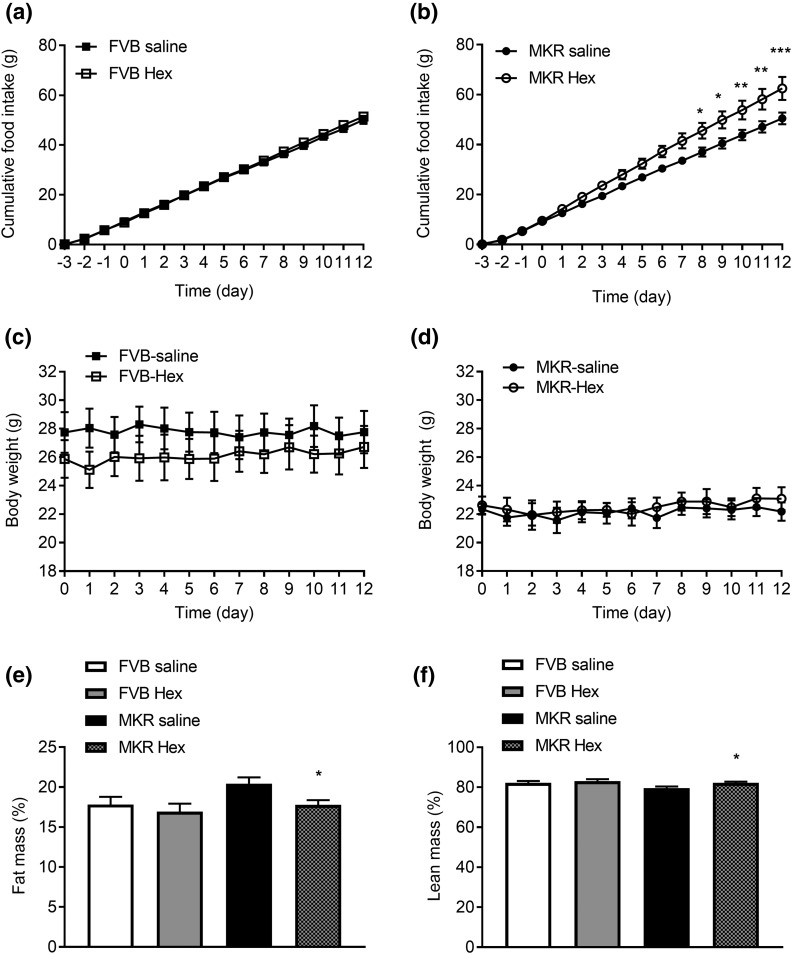
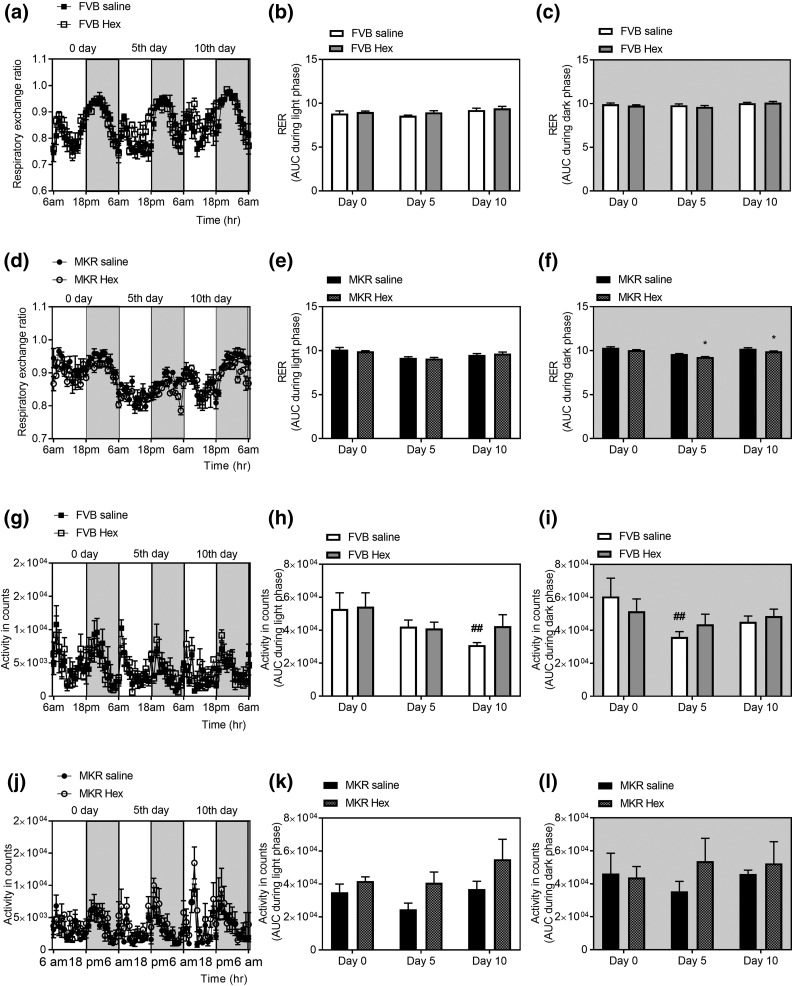
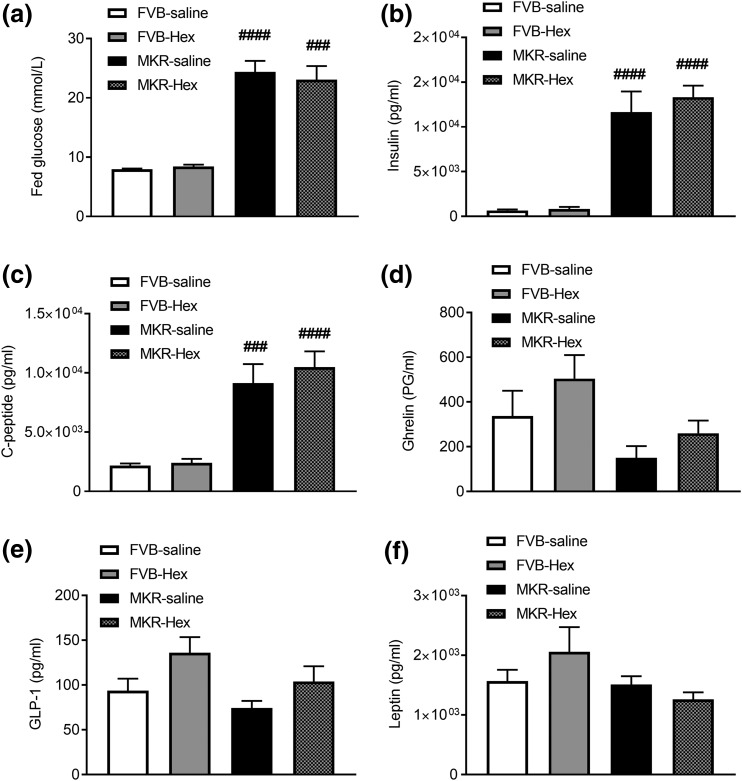
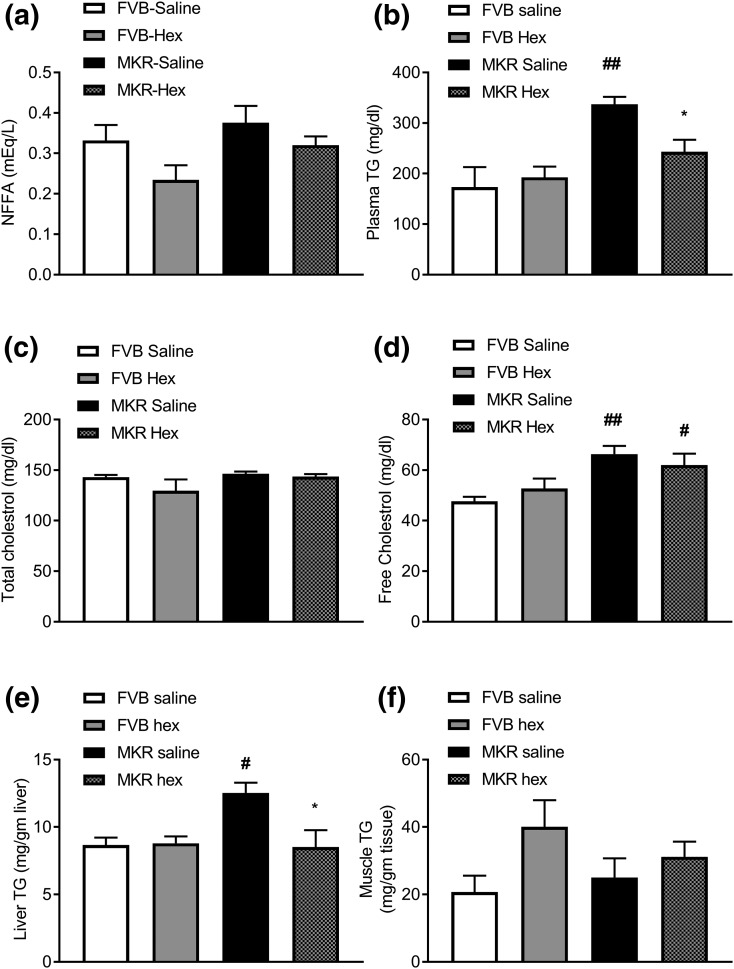
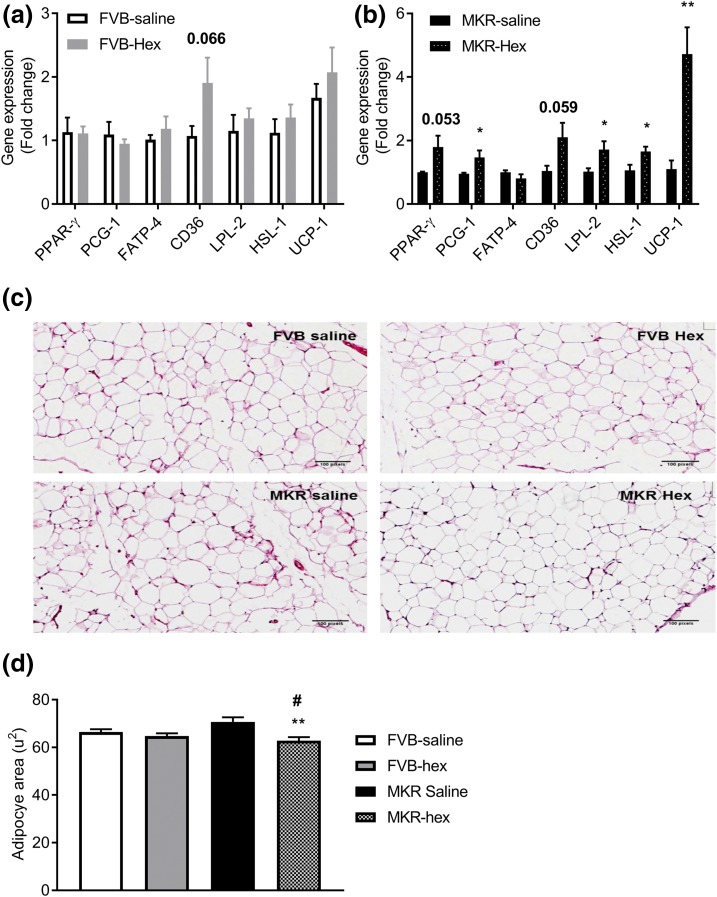
Despite the occurrence of dyslipidemia and its contribution to the development of insulin resistance in obese subjects, a growing number of studies have described abnormal lipid profiles among leaner persons. For example, individuals with an abnormal paucity or distribution of fat (lipodystrophy) develop severe insulin resistance, dyslipidemia, and hepatic steatosis. Deranged adipocyte metabolism and differentiation contribute to ectopic fat deposition and consequent development of insulin resistance. Growth hormone (GH) therapy has been shown to correct body composition abnormalities in some lipodystrophy patients. However, little is known about the effects of GH-releasing peptides in this regard. Hexarelin, a GH secretagogue, has recently been shown to have beneficial effects on fat metabolism via the CD36 receptor. In this study, the effects of twice daily intraperitoneal injections of hexarelin (200 μg/kg body weight) were examined in nonobese insulin-resistant MKR mice and corresponding wild-type FVB mice for 12 days. Hexarelin treatment significantly improved glucose and insulin intolerance and decreased plasma and liver triglycerides in MKR mice. These beneficial metabolic effects could be due to the improved lipid metabolism and enhanced adipocyte differentiation of white adipose tissue with hexarelin treatment. Interestingly, although food intake of hexarelin-treated MKR mice was significantly increased, this did not change total body weight. Moreover, hexarelin treatment corrected the abnormal body composition of MKR mice, as demonstrated by a decrease in fat mass and an increase in lean mass. Our results suggest a possible application of hexarelin in treatment of lipid disorders associated with the metabolic syndrome.
Copyright © 2017 Endocrine Society.
Figures
References
-
- Krentz AJ. Lipoprotein abnormalities and their consequences for patients with type 2 diabetes. Diabetes Obes Metab. 2003;5(Suppl 1):S19–S27. - PubMed
-
- Yu C, Chen Y, Cline GW, Zhang D, Zong H, Wang Y, Bergeron R, Kim JK, Cushman SW, Cooney GJ, Atcheson B, White MF, Kraegen EW, Shulman GI. Mechanism by which fatty acids inhibit insulin activation of insulin receptor substrate-1 (IRS-1)-associated phosphatidylinositol 3-kinase activity in muscle. J Biol Chem. 2002;277(52):50230–50236. - PubMed
-
- Adams JM II, Pratipanawatr T, Berria R, Wang E, DeFronzo RA, Sullards MC, Mandarino LJ. Ceramide content is increased in skeletal muscle from obese insulin-resistant humans. Diabetes. 2004;53(1):25–31. - PubMed
-
- Brunetti P. The lean patient with type 2 diabetes: characteristics and therapy challenge. Int J Clin Pract Suppl. 2007;(153):3–9. - PubMed
-
- Levelt E, Pavlides M, Banerjee R, Mahmod M, Kelly C, Sellwood J, Ariga R, Thomas S, Francis J, Rodgers C, Clarke W, Sabharwal N, Antoniades C, Schneider J, Robson M, Clarke K, Karamitsos T, Rider O, Neubauer S. Ectopic and visceral fat deposition in lean and obese patients with type 2 diabetes. J Am Coll Cardiol. 2016;68(1):53–63. - PMC - PubMed
MeSH terms
Substances
Grants and funding
LinkOut - more resources
Full Text Sources
Other Literature Sources
Molecular Biology Databases
