. 2018 Jan 4;46(D1):D419-D427.
doi: 10.1093/nar/gkx760.

VDJdb: a curated database of T-cell receptor sequences with known antigen specificity

Affiliations

VDJdb: a curated database of T-cell receptor sequences with known antigen specificity

Mikhail Shugay et al. Nucleic Acids Res. .

Abstract

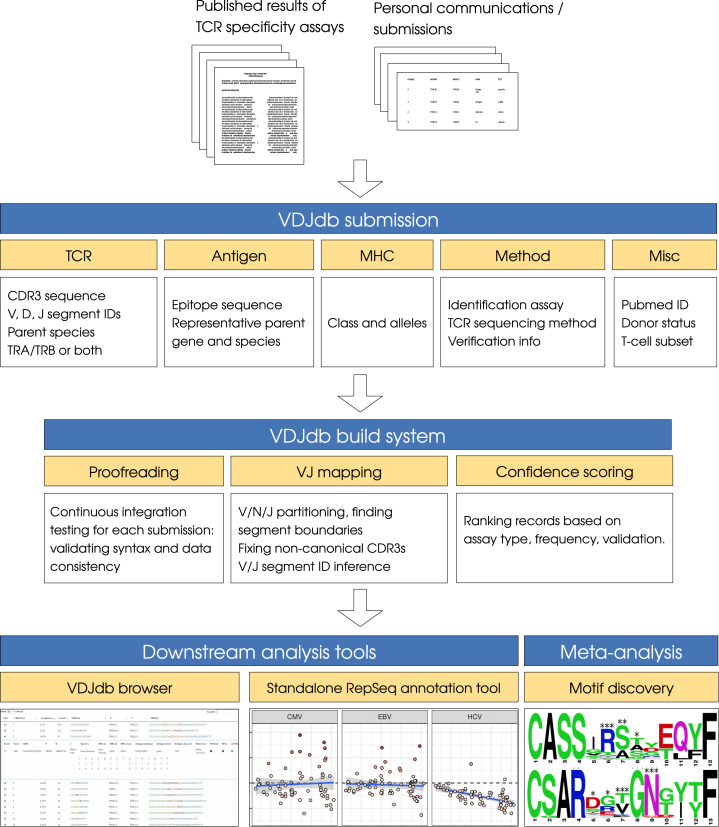
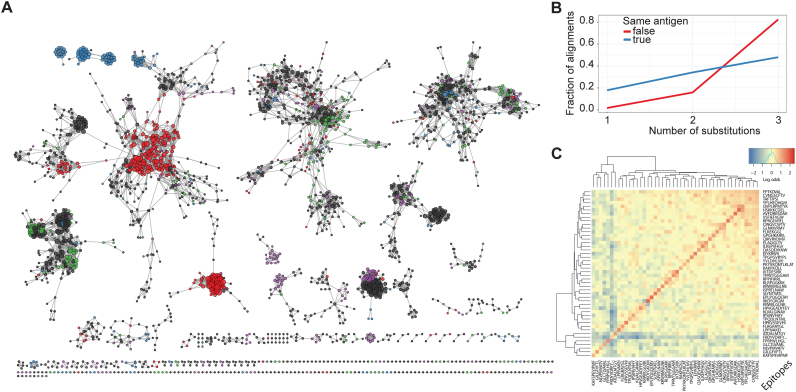
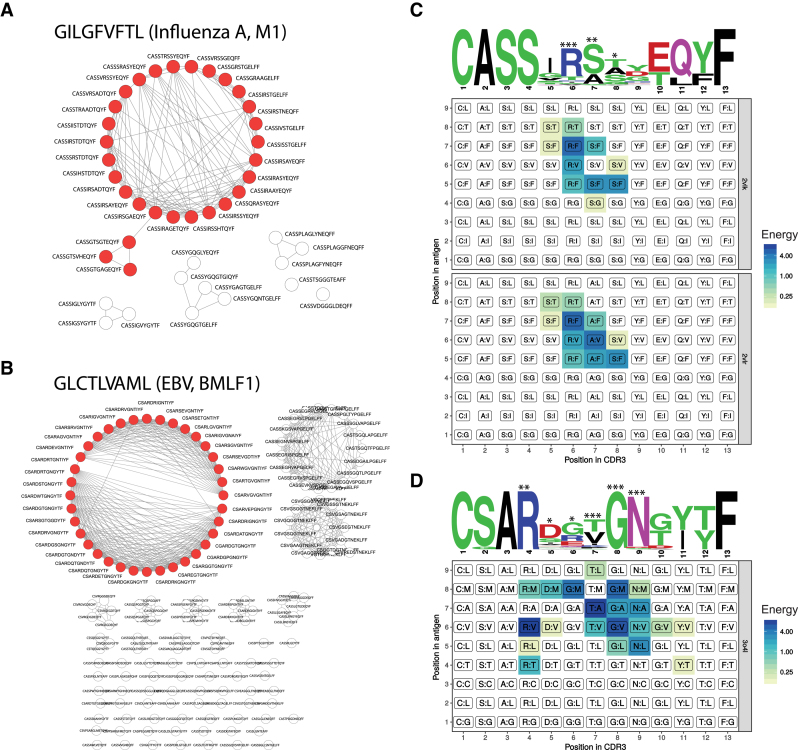
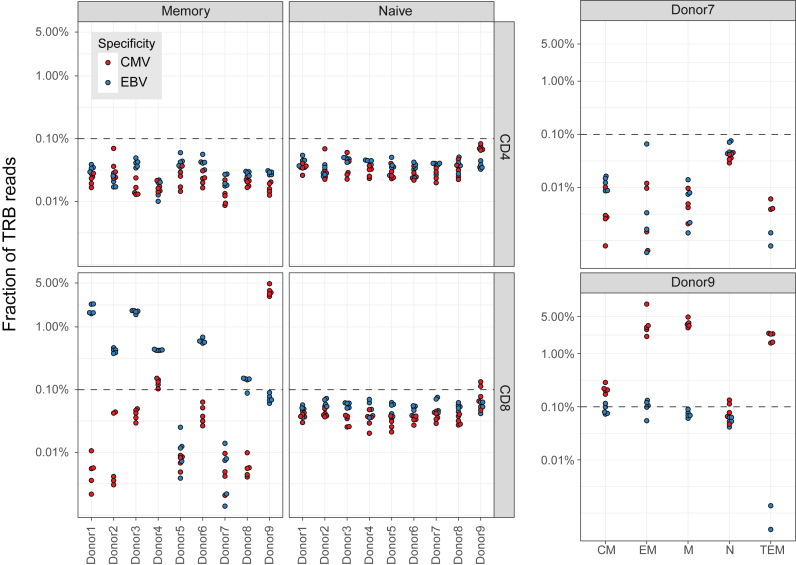
The ability to decode antigen specificities encapsulated in the sequences of rearranged T-cell receptor (TCR) genes is critical for our understanding of the adaptive immune system and promises significant advances in the field of translational medicine. Recent developments in high-throughput sequencing methods (immune repertoire sequencing technology, or RepSeq) and single-cell RNA sequencing technology have allowed us to obtain huge numbers of TCR sequences from donor samples and link them to T-cell phenotypes. However, our ability to annotate these TCR sequences still lags behind, owing to the enormous diversity of the TCR repertoire and the scarcity of available data on T-cell specificities. In this paper, we present VDJdb, a database that stores and aggregates the results of published T-cell specificity assays and provides a universal platform that couples antigen specificities with TCR sequences. We demonstrate that VDJdb is a versatile instrument for the annotation of TCR repertoire data, enabling a concatenated view of antigen-specific TCR sequence motifs. VDJdb can be accessed at https://vdjdb.cdr3.net and https://github.com/antigenomics/vdjdb-db.


Figures

Figure 1.
Figure 1.
VDJdb overview. The VDJdb database aggregates published and communicated TCR sequences with known antigen specificities. Each VDJdb submission contains descriptions of the TCR α and/or β rearrangement (including the amino acid sequence of the somatically rearranged CDR3 loop), the cognate epitope (peptide sequence, representative parent gene and species) and the restricting MHC allotype, together with methodological details and other metadata. Submissions are checked for syntax errors and data consistency, V and J segments are mapped to the CDR3 sequences to define germline boundaries (V/J segments are inferred if not available in the submission), and a record confidence score is computed based on the methodological metadata. The database can be explored using the VDJdb browser web application, and RepSeq samples can be annotated using a standalone command-line tool. Meta-analysis of the VDJdb database can also facilitate the discovery of antigen-specific TCR motifs.
Figure 2.
Figure 2.
Similarity of TCR sequences specific for defined antigens. (A) The network of VDJdb records constructed using hamming distances computed for pairs of CDR3 amino acid sequences. Edges (alignments) connect sequences that differ by up to three amino acid substitutions. Nodes are colored by epitope: red, FRDYVDRFYKTLRAEQASQE (HIV-1/Gag); blue, GLCTLVAML (EBV/BMLF1); green, KRWIILGLNK (HIV-1/Gag); purple, NLVPMVATV (CMV/pp65); black, other epitopes. Node size is scaled by degree. Only human TCR β records were considered. Number of nodes, 2300; number of edges, 9651. (B) Frequency of alignments with a given number of substitutions for TCRs specific for the same (blue) or different epitopes (red). Number of same epitope alignments, 5285; number of different epitope alignments, 4366. (c) Heatmap showing the normalized number of alignments between each pair of epitope specificities. The diagonal indicates alignments within the same epitope specificity. Normalization was performed by dividing each entry of the alignment count matrix by the product of the corresponding row and column sums.
Figure 3.
Figure 3.
CDR3 motifs discovered from comparative analyses of VDJdb records. (A and B) Networks of pairwise alignments of GILGFVFTL-specific (A) and GLCTLVAML-specific (B) TCR β CDR3 sequences with up to three amino acid substitutions (no indels allowed). Nodes from the largest connected subnetworks (29 for GILGFVFTL and 36 for GLCTLVAML) used for motif discovery are shown in red. (C and D) TCR β CDR3 amino acid sequence logos and contact energy matrices obtained from available TCR:pMHC structural data. Sequence logos generated using WebLogo (http://weblogo.berkeley.edu/logo.cgi) show the relative frequency of each amino acid at each given position, and the height of each amino acid stack is scaled by the information content at each given position. Contact matrices are colored according to the interaction energies for each pair of CDR3 and peptide antigen residues (single-point energies were computed using GROMACS, value negated), and facet headers denote the Protein Data Bank IDs. Stars above the sequence logos show the number of accessible peptide antigen residues for each CDR3 residue, computed by counting peptide antigen residues closer than 5 Å to each given CDR3 residue.
Figure 4.
Figure 4.
Annotation of TCR β (TRB) repertoires obtained from a study of naive (N) and memory (M) CD4 and CD8 T-cells (16). Five independent peripheral blood samples were analyzed per donor. The plot shows the fraction of TRB reads with matches to known CMV-specific or EBV-specific TCR β sequences in VDJdb. A detailed analysis of the memory CD8 T-cell subset in donor 7 (CMV-seronegative) and donor 8 (CMV-seropositive) is shown on the right. CM, central memory; EM, effector memory; TEM, terminally differentiated effector memory. The dashed line shows an ad hoc threshold of 0.1%, corresponding to the upper limit of specific TRB reads among naive T-cells.
Figure 5.
Figure 5.
Abundance of TCR β (TRB) sequences specific for common (CMV and EBV) or less common persistent viruses (HCV and HIV) in peripheral blood samples from healthy donors of various ages (n = 65) (17). The plot shows the fraction of specific TRB reads divided by the mean value observed in umbilical cord blood (UCB) samples (n = 8). Z-scores were computed by comparing the TRB read fraction value in each donor with the corresponding mean and standard deviation values in UCB samples.

References

    1. Bacher P., Scheffold A.. Flow-cytometric analysis of rare antigen-specific T cells. Cytometry A. 2013; 83:692–701. - PubMed
    1. Lefranc M.P. IMGT, the international ImMunoGeneTics database. Nucleic Acids Res. 2003; 31:307–310. - PMC - PubMed
    1. Vita R., Overton J.A., Greenbaum J.A., Ponomarenko J., Clark J.D., Cantrell J.R., Wheeler D.K., Gabbard J.L., Hix D., Sette A. et al. . The immune epitope database (IEDB) 3.0. Nucleic Acids Res. 2015; 43:D405–D412. - PMC - PubMed
    1. Tickotsky N., Sagiv T., Prilusky J., Shifrut E., Friedman N.. McPAS-TCR: a manually-curated catalogue of pathology-associated T-cell receptor sequences. Bioinformatics. 2017; doi:10.1093/bioinformatics/btx286. - PubMed
    1. Benichou J., Ben-Hamo R., Louzoun Y., Efroni S.. Rep-Seq: uncovering the immunological repertoire through next-generation sequencing. Immunology. 2012; 135:183–191. - PMC - PubMed

Publication types

MeSH terms