. 2017 Nov 2;45(19):11413-11424.
doi: 10.1093/nar/gkx792.

A novel TPR-BEN domain interaction mediates PICH-BEND3 association

Affiliations

A novel TPR-BEN domain interaction mediates PICH-BEND3 association

Ganesha P Pitchai et al. Nucleic Acids Res. .

Abstract

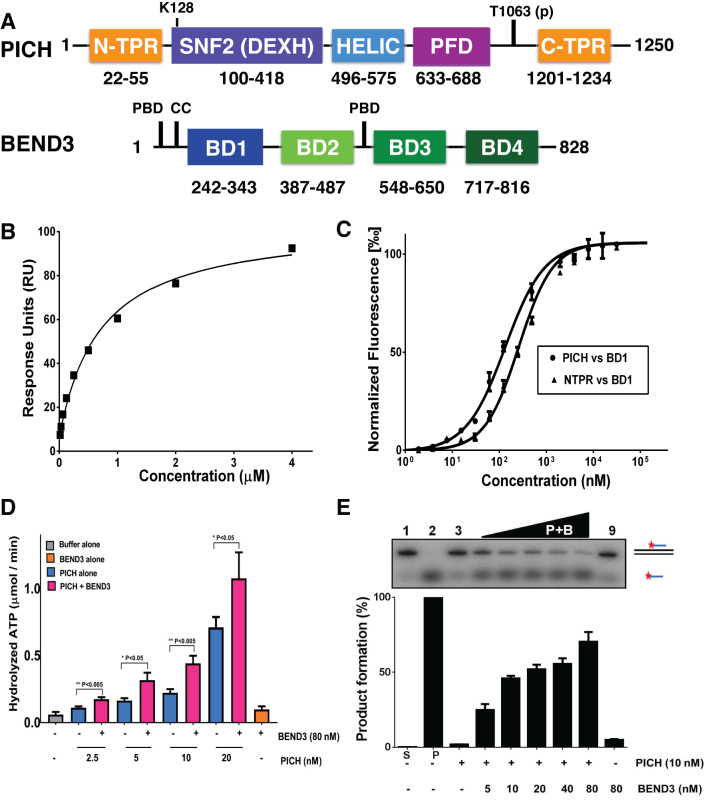
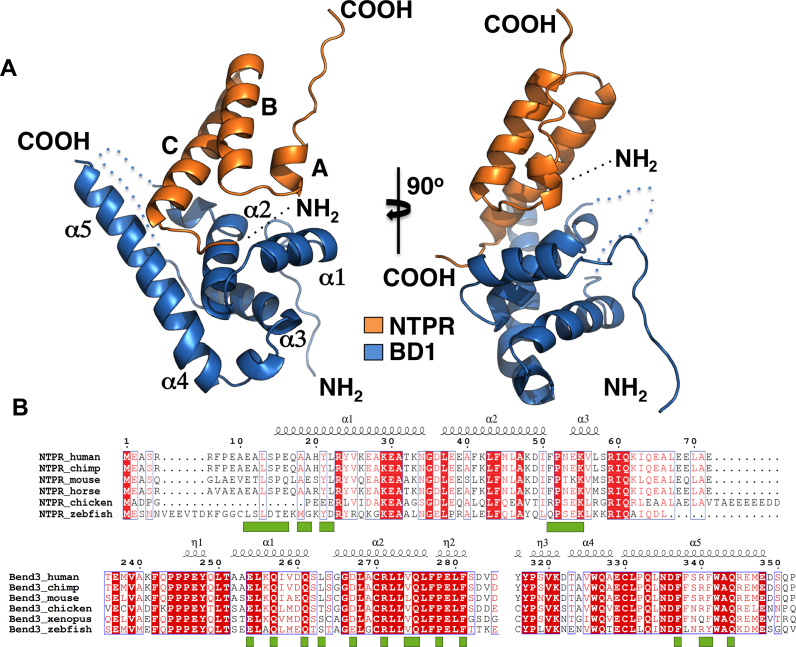
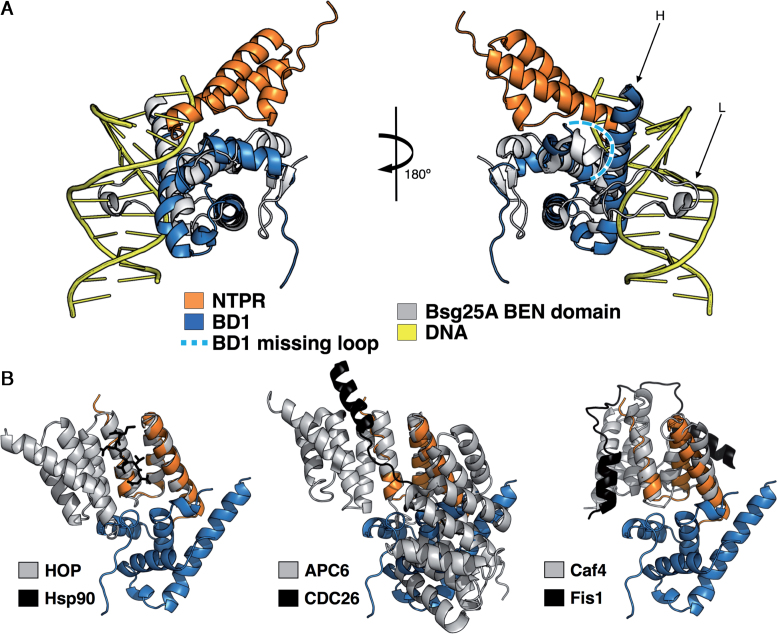
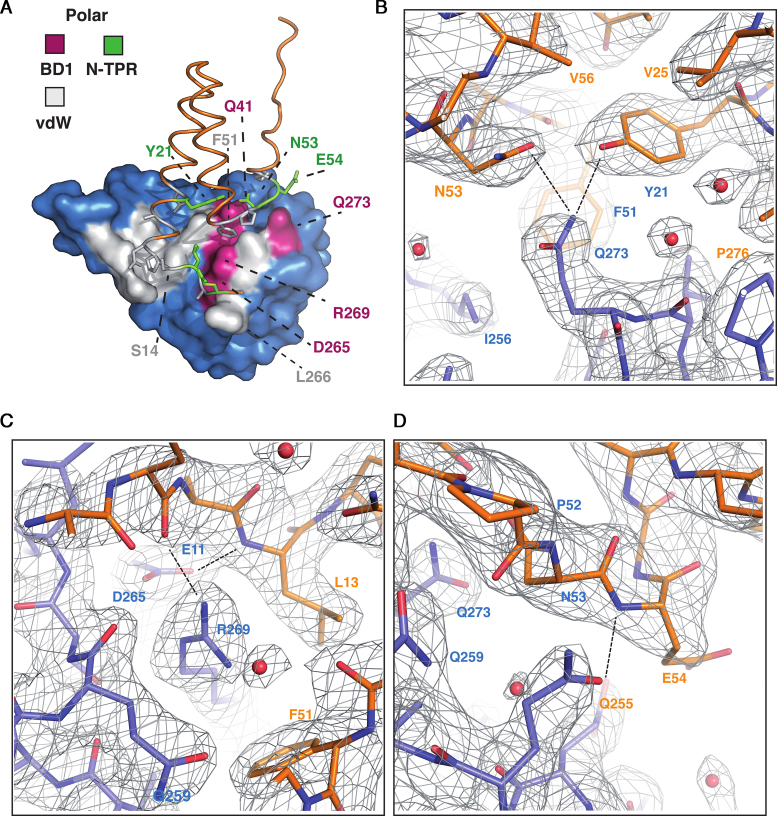
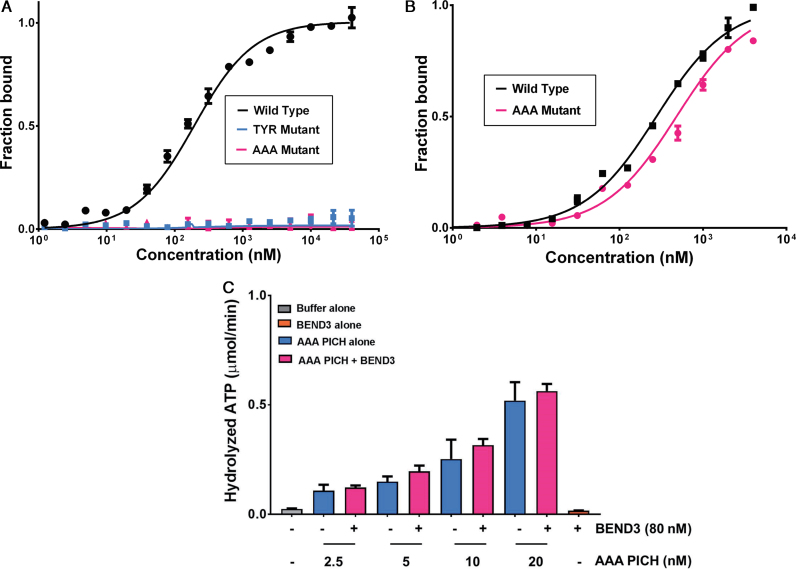
PICH is a DNA translocase required for the maintenance of chromosome stability in human cells. Recent data indicate that PICH co-operates with topoisomerase IIα to suppress pathological chromosome missegregation through promoting the resolution of ultra-fine anaphase bridges (UFBs). Here, we identify the BEN domain-containing protein 3 (BEND3) as an interaction partner of PICH in human cells in mitosis. We have purified full length PICH and BEND3 and shown that they exhibit a functional biochemical interaction in vitro. We demonstrate that the PICH-BEND3 interaction occurs via a novel interface between a TPR domain in PICH and a BEN domain in BEND3, and have determined the crystal structure of this TPR-BEN complex at 2.2 Å resolution. Based on the structure, we identified amino acids important for the TPR-BEN domain interaction, and for the functional interaction of the full-length proteins. Our data reveal a proposed new function for BEND3 in association with PICH, and the first example of a specific protein-protein interaction mediated by a BEN domain.


Figures

Figure 1.
Figure 1.
Binding of the N-TPR and BD1 domains and stimulation of the PICH activity by BEND3. (A) Schematic representation of the domain structure of PICH (upper) and BEND3 (lower). The numbers below each domain represent amino acid positions. The ATP (K128) and PLK1 (T1063) binding sites in PICH are indicated. The PBD and CC motifs marked in BEND3 denote putative Polo-box binding domains and a coiled-coil region, respectively. (B) Steady state binding curve for the PICH–BEND3 interaction using Biacore analysis. Responses at steady state were fitted with a simple binding model to obtain a Kd value of 0.7 ± 0.2 μM. (C) MST analysis of the interaction of the BD1 domain of BEND3 with either full length PICH or the isolated N-TPR domain, as indicated. The Kd values for the interaction with full length PICH and N-TPR were calculated to be 0.2 ± 0.25 μM and 1.2 ± 0.25 μM, respectively. Data points represent the mean of at least three independent experiments. Error bars denote SD. (D) dsDNA-dependent ATPase activity of different concentrations of PICH in the absence (blue bars) or presence (pink bars) of 80 nM BEND3 (monomer concentration; equivalent to 10 nM BEND3 octamers). The grey and orange bars denote control reactions with buffer or BEND3 alone, respectively. Statistical significance of pairwise interactions is indicated. (E) dsDNA translocase activity of PICH. Upper panel: representative polyacrylamide gel of the triplex DNA substrate and the ssDNA reaction product, as indicated diagrammatically on the right. The red asterisk denotes the radiolabeled end. Lower panel: quantification of the data from panel a, with protein monomer concentrations shown below the bars. Lanes marked S and P represent reactions using substrate alone and a heat-denatured DNA sample to define the position of the ssDNA product, respectively.
Figure 2.
Figure 2.
Structure of the N-TPR-BD1 complex. (A) Left: ribbon representation of the N-TPR domain (orange), which is composed largely of α-helices, and the BD1 domain (blue) which is composed of α1-α5 helices packed together to form a heart-shaped structure. A loop not visible in the structure is represented in dotted lines. Right; the N-TPR–BD1 complex has been tilted 90° to give an insight into the interaction interface. (B) Sequence alignment of N-TPR domains from different PICH proteins (upper) and BEN domain 1 from different BEND3 proteins (lower) from different species. The alignment was created using ESPRIPT online software. Identical residues are shown in white text in red boxes. Similar residues are in red text. The key residues involved in the interaction are represented by green squares below.
Figure 3.
Figure 3.
Superimposition of available PDBe structures with N-TPR and BD1 complex. (A) (Left) The Bsg25A BEN domain structure (grey) together with dsDNA (yellow) is superimposed with human BEND3 BD1 (blue). (Right) The superimposed structures have been tilted 180° to see the DNA binding region of the Bsg25A BEN domain. The missing loop from BD1 is highlighted in pale blue with white dots. (B) The N-TPR–BD1 complex structure (blue and orange, respectively) is superimposed with the Hop–Hsp90 structure (gray and black). Note that the helix A of N-TPR is distorted.
Figure 4.
Figure 4.
Residues in the N-TPR domain required for interaction with BD1. (A) A surface model of the N-TPR/BD1 interaction. The N-TPR domain (orange) is shown sitting on top of the heart-shaped BD1 domain (blue). The interaction interfaces are highlighted; green (for N-TPR) and magenta (for BD1) represent surfaces involved in polar interactions. Grey represents the van der Waals interaction interface in both domains. The N-TPR domain is in orange and the residues involved in the binding are represented in different colors. The side chains of interacting residues are shown as sticks in N-TPR. Green represents the amino acids involved in polar contacts, and grey represents hydrophobic interactions from N-TPR. (BD) Detailed view of the key residues involved in the interaction of the N-TPR and BD1 complex shown as a 2Dfo-mfc electron density map contoured at 1σ. The N-TPR is shown in orange and BD1 in blue. The key residues are depicted with their single letter code and corresponding amino acid position. Dashed lines represent the hydrogen bonds between the amino acids (see Supplementary Figure S6 for a schematic representation).
Figure 5.
Figure 5.
MST binding and activity assays of the mutant versions of N-TPR (A) A comparison of the interaction of either wild type or mutant versions of N-TPR domain with BD1 using MST analysis. Normalized thermophoresis is plotted against the concentration of the unlabeled ligand. (B) As panel (A), except using full length BEND3 together with either full length PICH or the PICH-AAA mutant, as indicated. Data points represent the mean of at least three independent experiments. Error bars denote SD. (C) dsDNA-dependent ATPase activity of different concentrations of mutant AAA-PICH in the absence (blue bars) or presence (pink bars) of 80 nM BEND3 (monomer concentration; equivalent to 10 nM BEND3 octamers). The grey and orange bars denote control reactions with buffer or BEND3 alone, respectively. The ATPase activity of the PICH-AAA protein was not stimulated by BEND3 at any protein concentration tested (P > 0.05). Data points represent the mean of at least three independent experiments. Error bars denote SD.

References

    1. Maeshima K., Eltsov M.. Packaging the genome: the structure of mitotic chromosomes. J. Biochem. 2008; 143:145–153. - PMC - PubMed
    1. Koshland D., Strunnikov A.. Mitotic Chromosome Condensation. Annu. Rev. Cell Dev. Biol. 1996; 12:305–333. - PubMed
    1. Harper J.V., Brooks G.. The mammalian cell cycle: an overview. Methods Mol. Biol. (Clifton, N.J.). 2005; 296:113–153. - PubMed
    1. Abe S., Nagasaka K., Hirayama Y., Kozuka-Hata H., Oyama M., Aoyagi Y., Obuse C., Hirota T.. The initial phase of chromosome condensation requires Cdk1-mediated phosphorylation of the CAP-D3 subunit of condensin II. Genes Dev. 2011; 25:863–874. - PMC - PubMed
    1. Oliveira R.A., Kotadia S., Tavares A., Mirkovic M., Bowlin K., Eichinger C.S., Nasmyth K., Sullivan W.. Centromere-independent accumulation of cohesin at ectopic heterochromatin sites induces chromosome stretching during anaphase. PLoS Biol. 2014; 12:e1001962. - PMC - PubMed