

Effects of the kinase inhibitor sorafenib on heart, muscle, liver and plasma metabolism in vivo using non-targeted metabolomics analysis
- PMID: 28977680
- PMCID: PMC5727336
- DOI: 10.1111/bph.14062
Effects of the kinase inhibitor sorafenib on heart, muscle, liver and plasma metabolism in vivo using non-targeted metabolomics analysis
Abstract
Background and purpose: The human kinome consists of roughly 500 kinases, including 150 that have been proposed as therapeutic targets. Protein kinases regulate an array of signalling pathways that control metabolism, cell cycle progression, cell death, differentiation and survival. It is not surprising, then, that new kinase inhibitors developed to treat cancer, including sorafenib, also exhibit cardiotoxicity. We hypothesized that sorafenib cardiotoxicity is related to its deleterious effects on specific cardiac metabolic pathways given the critical roles of protein kinases in cardiac metabolism.
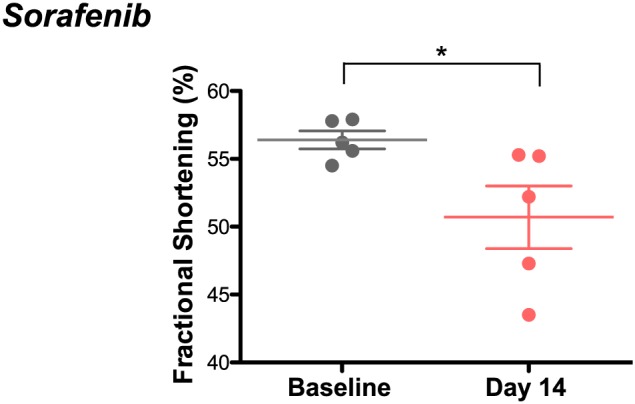
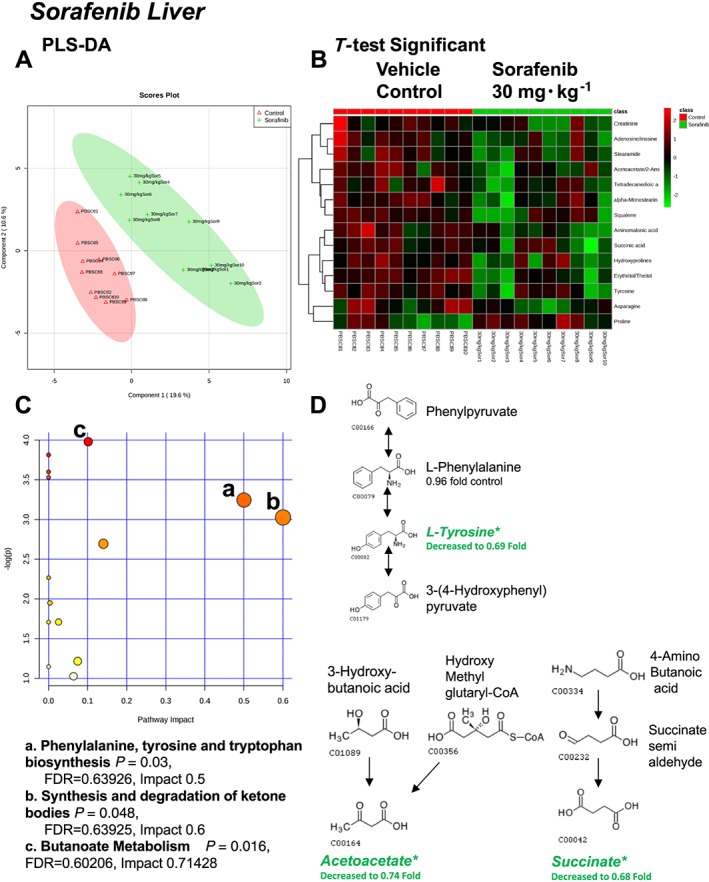
Experimental approach: FVB/N mice (10 per group) were challenged with sorafenib or vehicle control daily for 2 weeks. Echocardiographic assessment of the heart identified systolic dysfunction consistent with cardiotoxicity in sorafenib-treated mice compared to vehicle-treated controls. Heart, skeletal muscle, liver and plasma were flash frozen and prepped for non-targeted GC-MS metabolomics analysis.
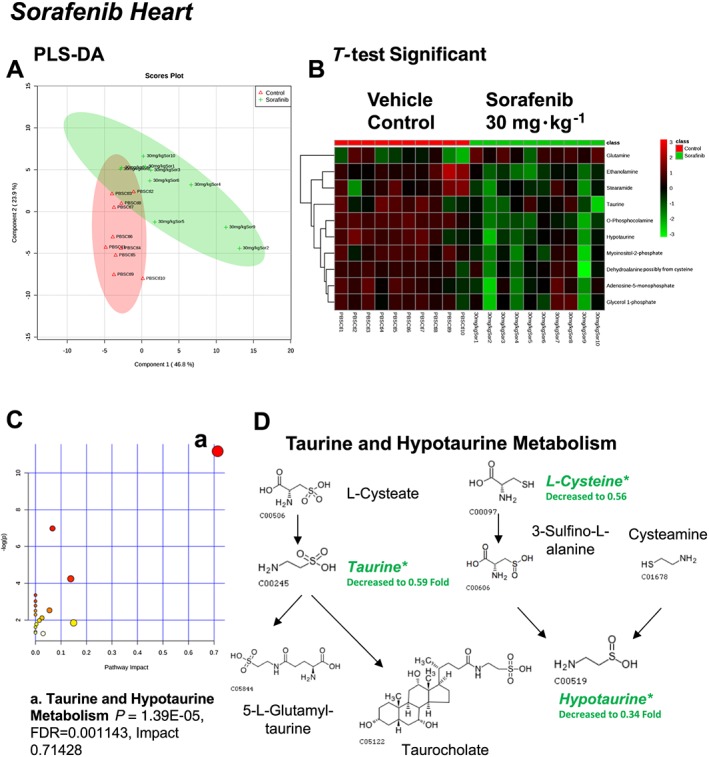
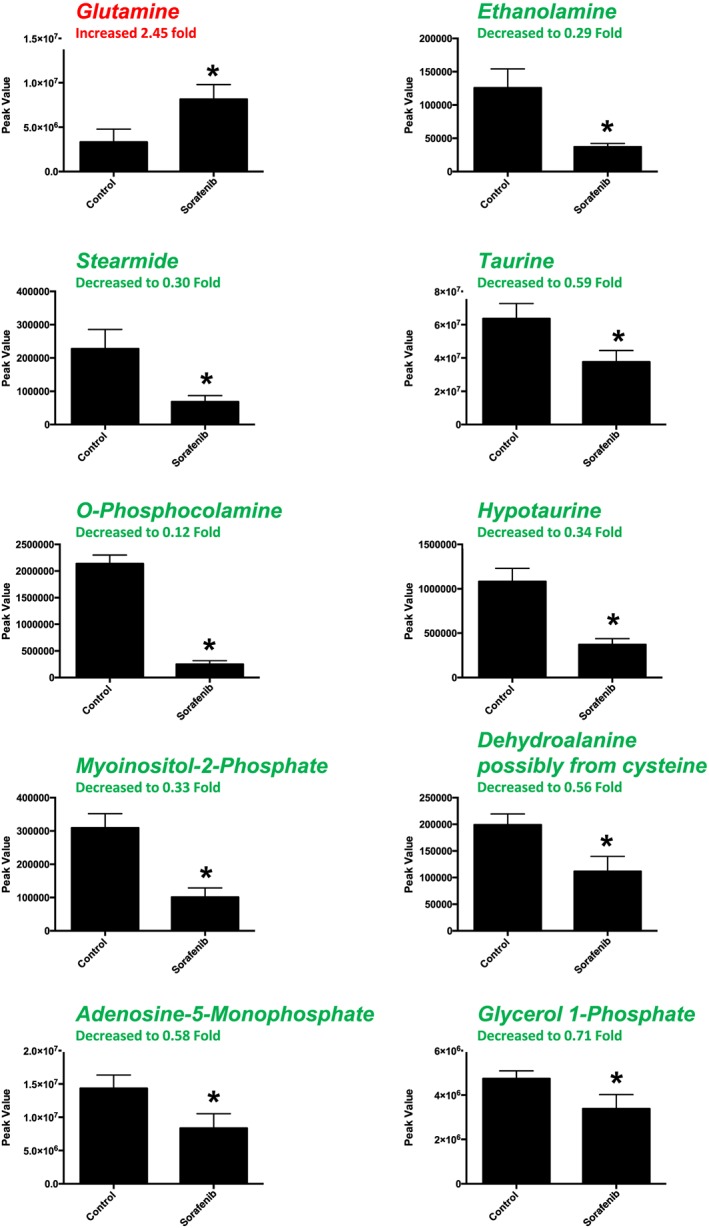
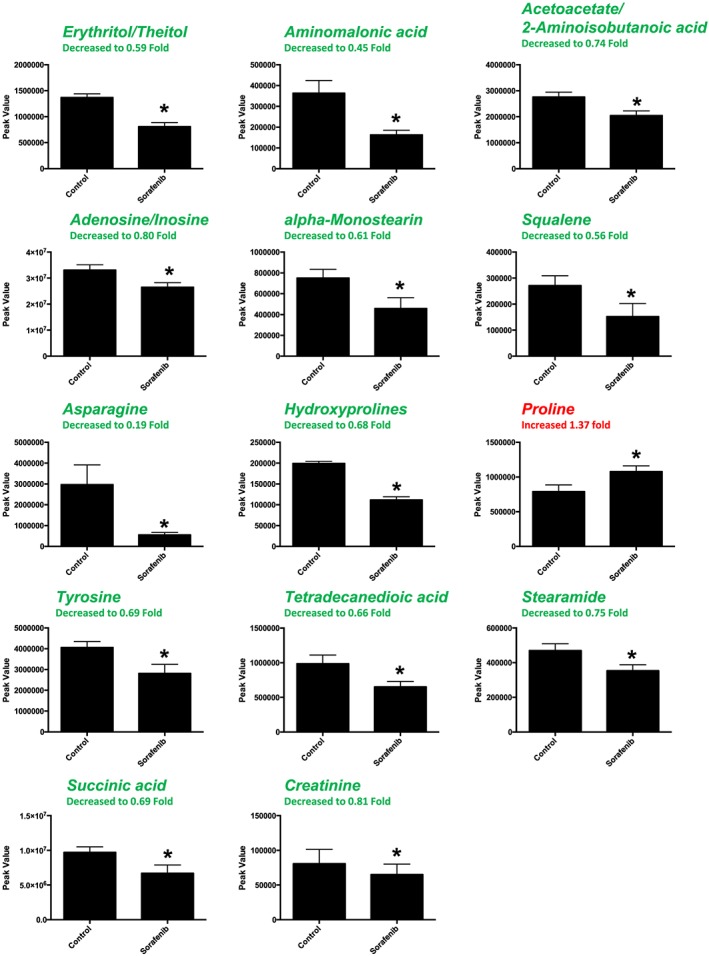
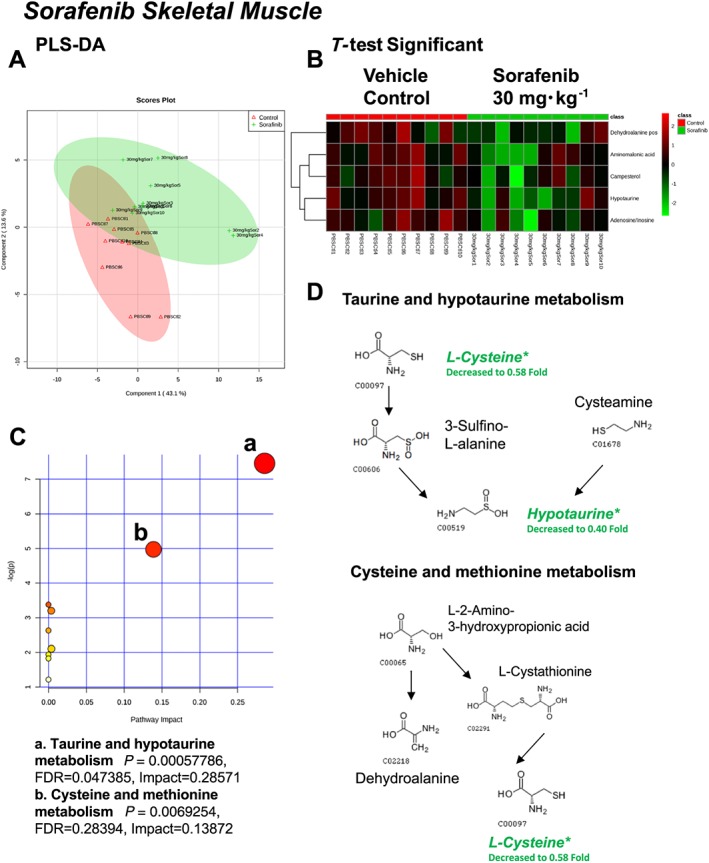
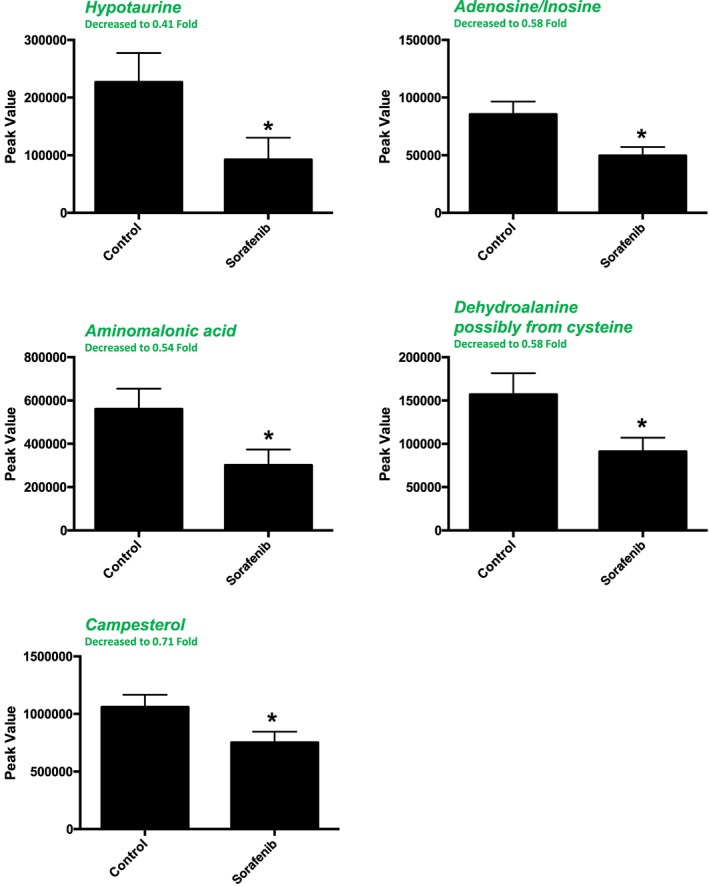
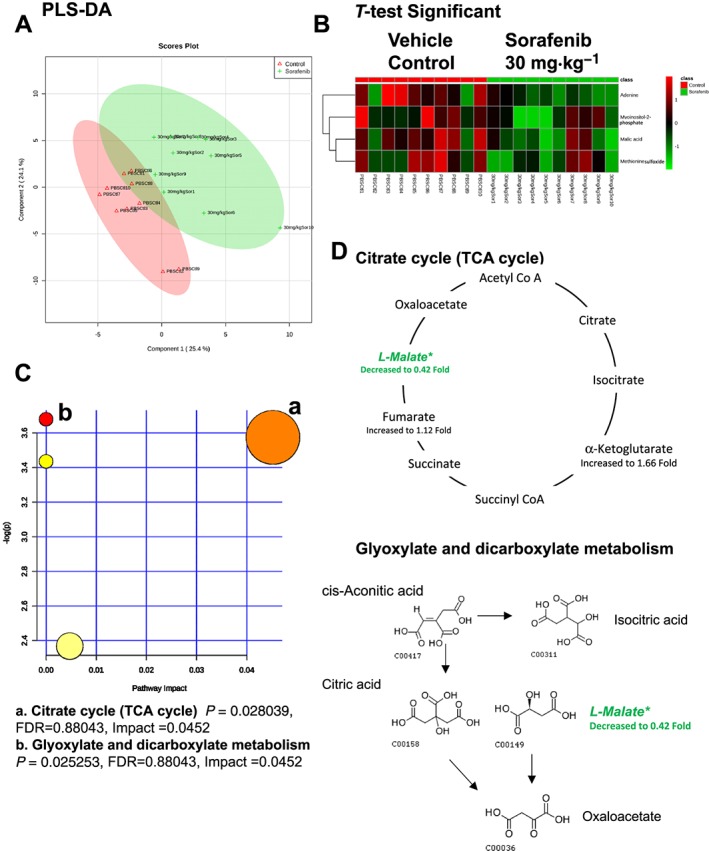
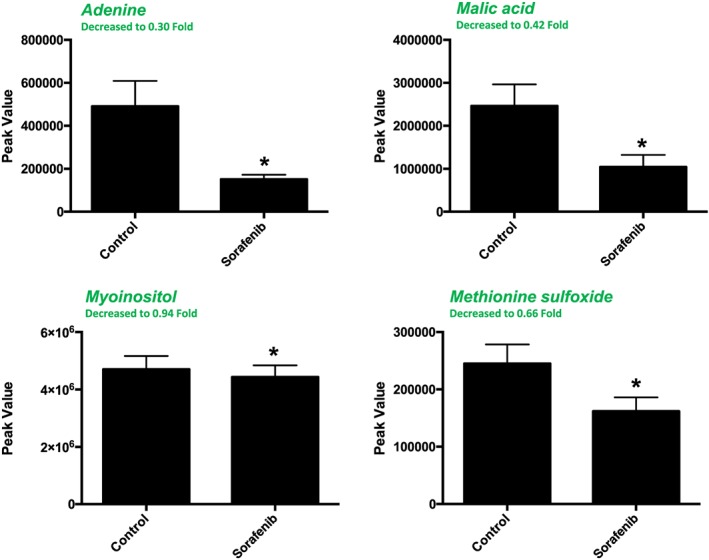
Key results: Compared to vehicle-treated controls, sorafenib-treated hearts exhibited significant alterations in 11 metabolites, including markedly altered taurine/hypotaurine metabolism (25-fold enrichment), identified by pathway enrichment analysis.
Conclusions and implications: These studies identified alterations in taurine/hypotaurine metabolism in the hearts and skeletal muscles of mice treated with sorafenib. Interventions that rescue or prevent these sorafenib-induced changes, such as taurine supplementation, may be helpful in attenuating sorafenib-induced cardiac injury.
© 2017 The British Pharmacological Society.
Figures
Similar articles
-
Non-Targeted Metabolomics Analysis of the Effects of Tyrosine Kinase Inhibitors Sunitinib and Erlotinib on Heart, Muscle, Liver and Serum Metabolism In Vivo.Metabolites. 2017 Jun 22;7(3):31. doi: 10.3390/metabo7030031. Metabolites. 2017. PMID: 28640223 Free PMC article.
-
Kinome and Transcriptome Profiling Reveal Broad and Distinct Activities of Erlotinib, Sunitinib, and Sorafenib in the Mouse Heart and Suggest Cardiotoxicity From Combined Signal Transducer and Activator of Transcription and Epidermal Growth Factor Receptor Inhibition.J Am Heart Assoc. 2017 Oct 19;6(10):e006635. doi: 10.1161/JAHA.117.006635. J Am Heart Assoc. 2017. PMID: 29051215 Free PMC article.
-
Sorafenib cardiotoxicity increases mortality after myocardial infarction.Circ Res. 2014 May 23;114(11):1700-1712. doi: 10.1161/CIRCRESAHA.114.303200. Epub 2014 Apr 9. Circ Res. 2014. PMID: 24718482 Free PMC article.
-
Biology, Epidemiology, Clinical Aspects of Hepatocellular Carcinoma and the Role of Sorafenib.Curr Drug Targets. 2016;17(7):783-99. doi: 10.2174/1389450117666151209120831. Curr Drug Targets. 2016. PMID: 26648069 Review.
-
The discovery and development of sorafenib for the treatment of thyroid cancer.Expert Opin Drug Discov. 2015 Apr;10(4):427-39. doi: 10.1517/17460441.2015.1006194. Epub 2015 Feb 8. Expert Opin Drug Discov. 2015. PMID: 25662396 Free PMC article. Review.
Cited by
-
Cardiovascular Biomarkers in Cardio-Oncology: Antineoplastic Drug Cardiotoxicity and Beyond.Biomolecules. 2024 Feb 7;14(2):199. doi: 10.3390/biom14020199. Biomolecules. 2024. PMID: 38397436 Free PMC article. Review.
-
Prognostic Factors for Cardiotoxicity among Children with Cancer: Definition, Causes, and Diagnosis with Omics Technologies.Diagnostics (Basel). 2023 May 26;13(11):1864. doi: 10.3390/diagnostics13111864. Diagnostics (Basel). 2023. PMID: 37296716 Free PMC article. Review.
-
Lenvatinib-induced multiorgan adverse events in Hurthle cell thyroid cancer: A case report.World J Clin Oncol. 2021 Apr 24;12(4):272-281. doi: 10.5306/wjco.v12.i4.272. World J Clin Oncol. 2021. PMID: 33959480 Free PMC article.
-
Chronic Treatment with Multi-Kinase Inhibitors Causes Differential Toxicities on Skeletal and Cardiac Muscles.Cancers (Basel). 2019 Apr 23;11(4):571. doi: 10.3390/cancers11040571. Cancers (Basel). 2019. PMID: 31018508 Free PMC article.
-
Metabolomic Perspectives in Antiblastic Cardiotoxicity and Cardioprotection.Int J Mol Sci. 2019 Oct 4;20(19):4928. doi: 10.3390/ijms20194928. Int J Mol Sci. 2019. PMID: 31590338 Free PMC article. Review.
References
-
- Azuma J, Sawamura A, Awata N, Ohta H, Hamaguchi T, Harada H et al (1985). Therapeutic effect of taurine in congestive heart failure: a double‐blind crossover trial. Clin Cardiol 8: 276–282. - PubMed
-
- Beyranvand MR, Khalafi MK, Roshan VD, Choobineh S, Parsa SA, Piranfar MA (2011). Effect of taurine supplementation on exercise capacity of patients with heart failure. J Cardiol 57: 333–337. - PubMed
-
- Brandi G, de Rosa F, Calza L, Girolamo SD, Tufoni M, Ricci CS et al (2013). Can the tyrosine kinase inhibitors trigger metabolic encephalopathy in cirrhotic patients? Liver Int 33: 488–493. - PubMed
MeSH terms
Substances
Grants and funding
LinkOut - more resources
Full Text Sources
Other Literature Sources
Miscellaneous
