. 2017 May 22;8(37):61282-61304.
doi: 10.18632/oncotarget.18058. eCollection 2017 Sep 22.

Clinical roles of the aberrantly expressed lncRNAs in lung squamous cell carcinoma: a study based on RNA-sequencing and microarray data mining

Affiliations

Clinical roles of the aberrantly expressed lncRNAs in lung squamous cell carcinoma: a study based on RNA-sequencing and microarray data mining

Wen-Jie Chen et al. Oncotarget. .

Abstract

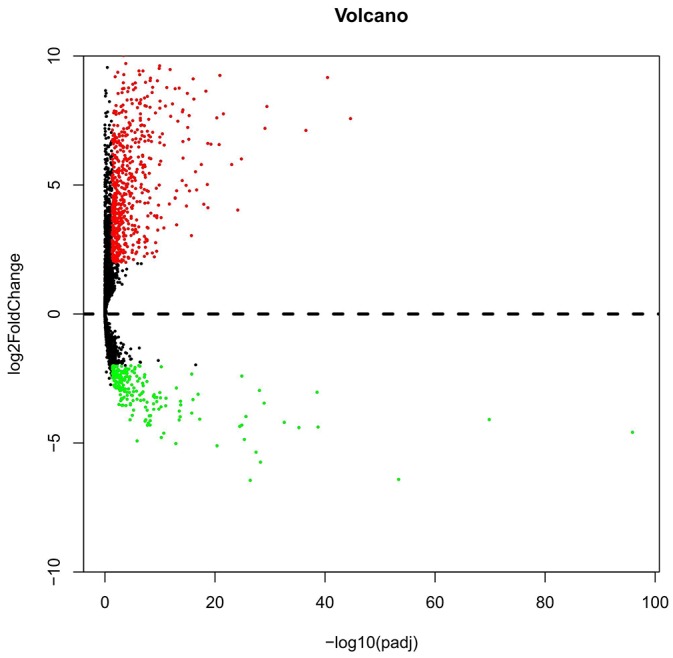
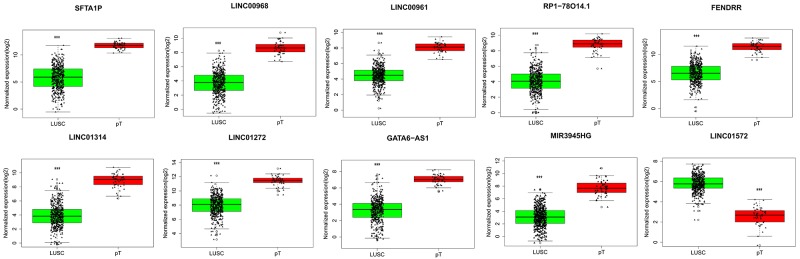
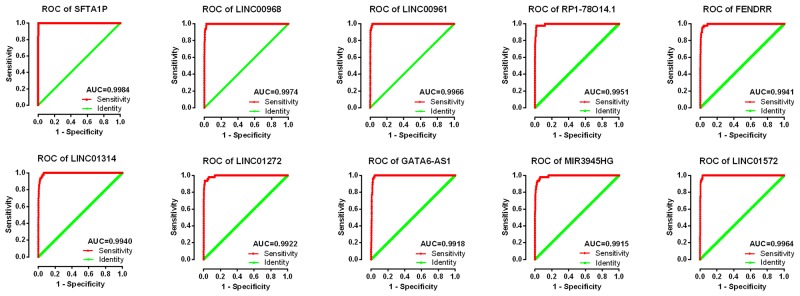
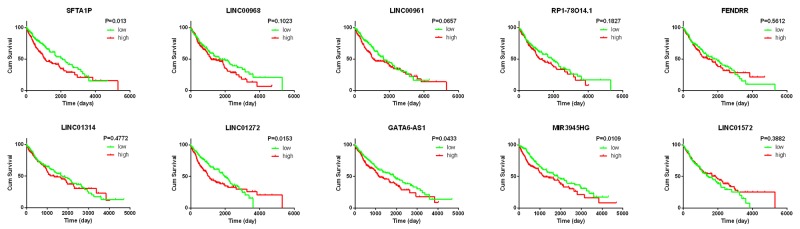
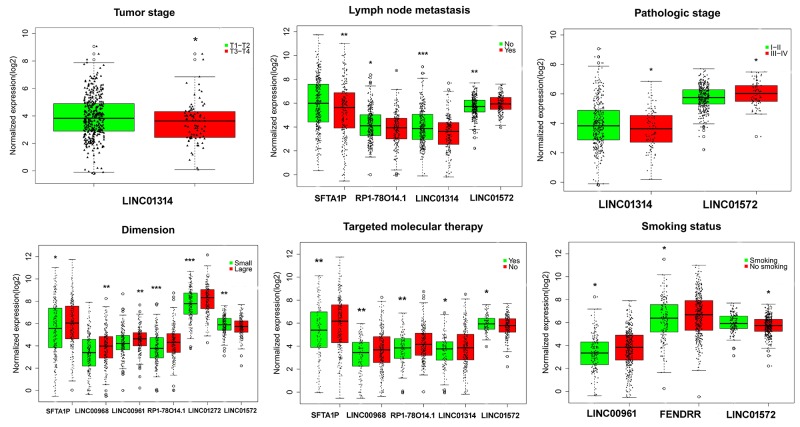
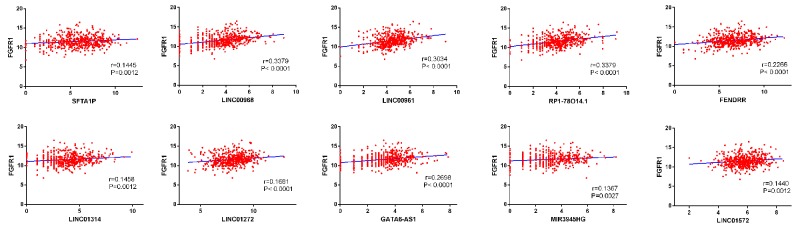
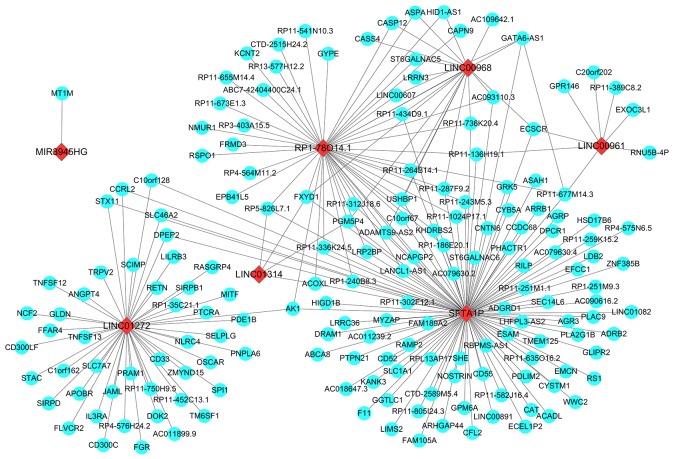
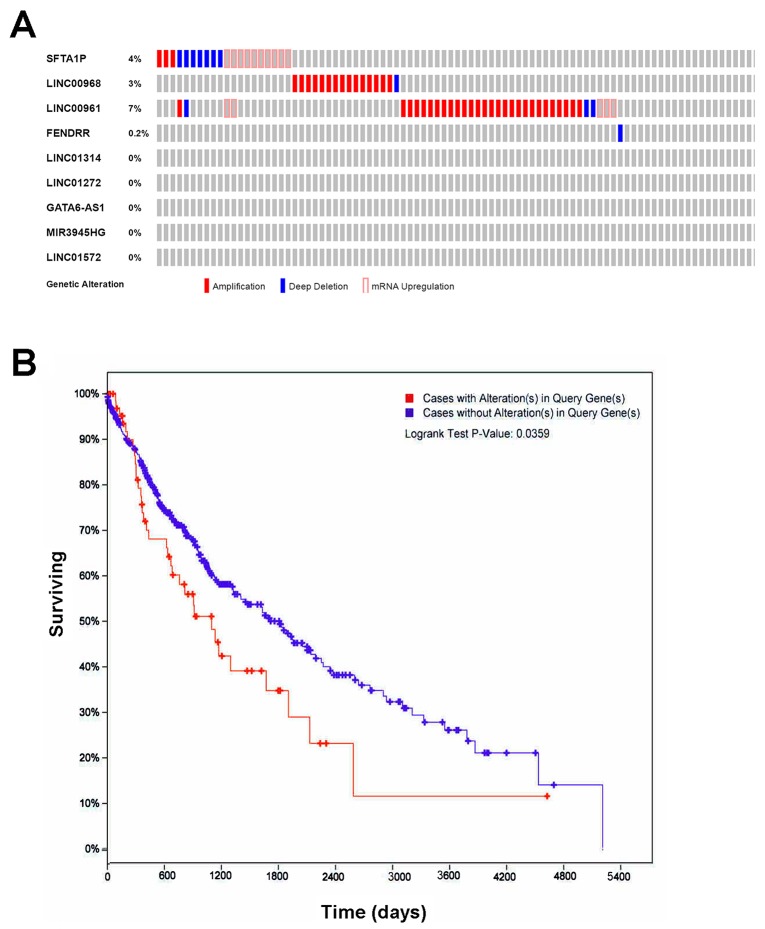
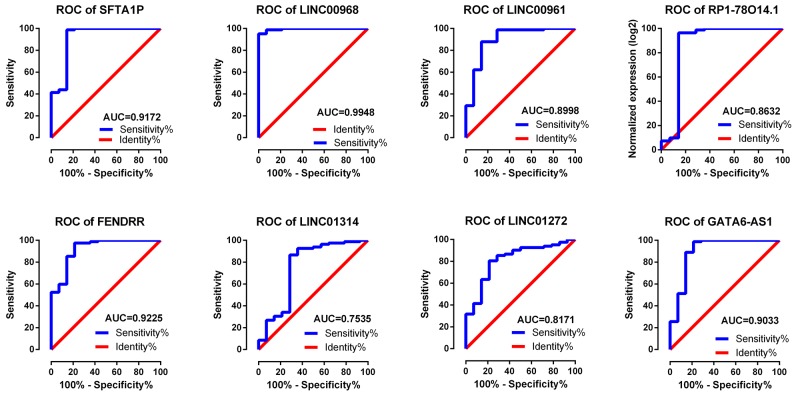
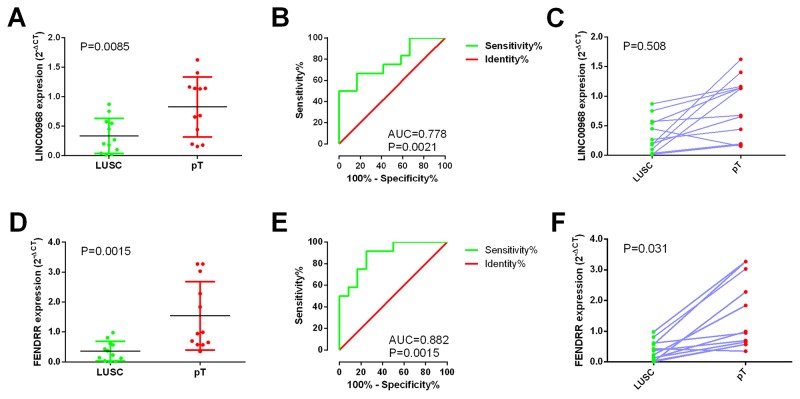
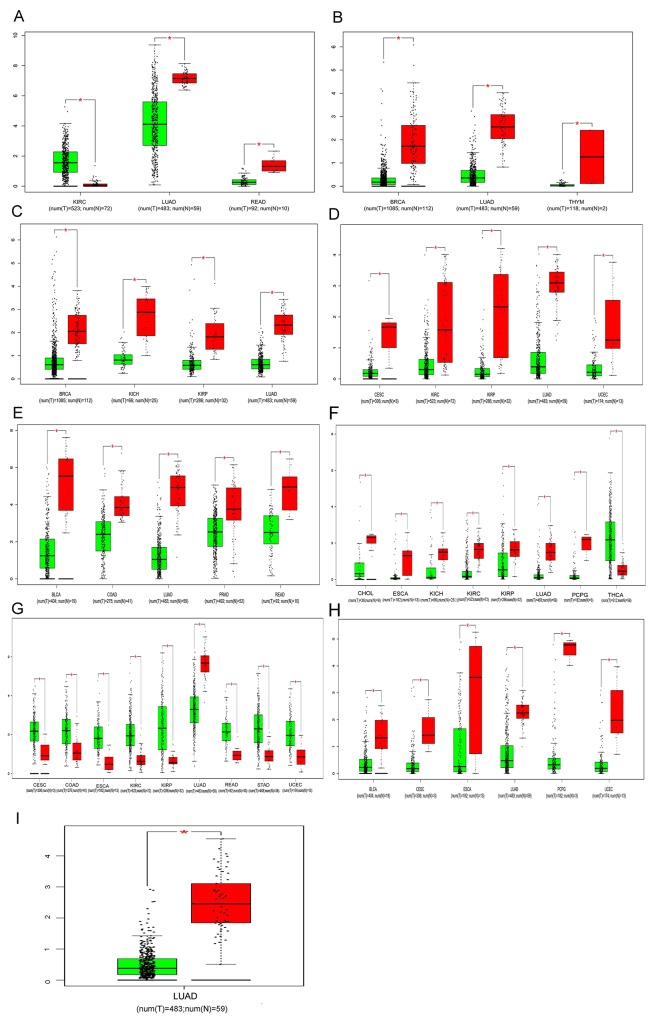
Lung squamous cell carcinoma (LUSC) accounts for a significant proportion of lung cancer and there have been few therapeutic alternatives for recurrent LUSC due to the lack of specific driver molecules. To investigate the prospective role of lncRNAs in the tumorigenesis and progression of LUSC, the aberrantly expressed lncRNAs were calculated based on The Cancer Genome Atlas RNA-seq data. Of 7589 lncRNAs with 504 LUSC cases, 884 lncRNAs were identified as being aberrantly expressed (|log2 fold change| >2 and adjusted P<0.05) by DESeq R. The top 10 lncRNAs with the highest diagnostic value were SFTA1P,LINC00968, LINC00961, LINC01572,RP1-78O14.1, FENDRR, LINC01314,LINC01272, GATA6-AS1, and MIR3945HG. In addition to the significant roles in the carcinogenesis of LUSC, several lncRNAs also played vital parts in the survival and progression of LUSC. SFTA1P, LINC01272, GATA6-AS1 and MIR3945HG were closely related to the survival time of LUSC. Furthermore, LINC01572 and LINC01314 could distinguish the LUSC at early stage from that at advanced stage. The prospective molecular assessment of key lncRNAs showed that a certain series of genes could be involved in the regulation network. Furthermore, the OncoPrint from cBioPortal indicated that 14% (69/501) LUSC cases with genetic alterations could be obtained, including amplification, deep deletion and mRNA upregulation. More interestingly, the cases with genetic alterations had a poorer survival as compared to those without alterations. Overall, the study propounds a potentiality for interpreting the pathogenesis and development of LUSC with lncRNAs, and provides a novel platform for searching for more capable diagnostic biomarkers for LUSC.

Keywords: LUSC; TCGA; biomarker; lncRNAs; tumorigenesis.


Conflict of interest statement

CONFLICTS OF INTEREST The authors declare that they have no conflicts of interest.

Figures

Figure 1
Figure 1. Volcano plot of the aberrantly expressed lncRNAs between LUSC and para-tumorous lung tissues
Red dots indicate high expression and green dots indicate low expression of lncRNAs. Black dots show the lncRNAs with expression of |log2FC|<2. The X axis represents an adjusted FDR and the Y axis represents the value of log2FC. Aberrantly expressed lncRNAs were calculated by DESeq R. Altogether, 669 high and 215 low expressed lncRNAs were achieved. This volcano plot was conducted by the ggplot2 package of R language.
Figure 2
Figure 2. Different expression of the top 10 lncRNAs between LUSC and para-tumorous lung tissues
Red column indicates LUSC tissues, and green column indicates lung para-tumorous tissue (pT). The X axis indicates tissue types. The Y axis represents normalized expression of lncRNAs. This figure was drawn by ggplot2 package of R language. *: P<0.05, **: P<0.01, ***: P<0.001.
Figure 3
Figure 3. ROC curves of the top 10 lncRNAs sorted by AUC in LUSC
Red represents sensitive curve, green indicates identify line. The X axis shows false positive rate, presented as “1-Specificity”. The Y axis indicates true positive rate, shown as “Sensitivity”. These curves were provided by GraphPad Prism 6.
Figure 4
Figure 4. K-M curves of the top 10 lncRNAs in LUSC
Red line represents high level of a lncRNA, and green line represents low level. The X axis indicates overall survival time (day), and the Y axis indicates the survival rate. These curves were conducted by GraphPad Prism 6.
Figure 5
Figure 5. Association between the expression of key lncRNAs and clinicopathological features in LUSC
Statistical significance differences of several key lncRNAs were noted in various clinicopathological features: tumor stage (T1/T2 vs. T3/T4), lymph node metastasis (no vs. yes), pathological stage (I/II vs. III/IV), smoking status (no smoking vs. current smoking), targeted molecular therapy (no vs. yes). The X axis indicates different lncRNAs, and the Y axis indicates the normalized expression (log2). The plots were conducted by ggplot2 package of R language. *: P<0.05, **: P<0.01, ***: P<0.001.
Figure 6
Figure 6. Correlation between FGFR1 expression and lncRNAs in LUSC
The expression of these lncRNAs were positively correlated with FGFR1 expression based on TCGA dataset.
Figure 7
Figure 7. Prospective gene networks of the 10 top differentially expressed lncRNAs
To explore the regulation network of the key lncRNAs, the co-expressed genes of those key down-regulated lncRNAs were screened out by WGCNA. Red diamonds showed the key lncRNAs and blue balls are for key lncRNAs co-expressed mRNAs.
Figure 8
Figure 8. The genetic alterations and their prognostic value of the lncRNAs in LUSC
(A) Genetic alterations. Red represents amplification, blue represents deep deletion and pink represents mRNA up-regulation. Genetic alterations were found in 69 of 501 LUSC patients (14%). The aberrant expression threshold was defined as z-score ± 2.0 from the TCGA RNA Seq V2 data. This OncoPrint was conducted by cBioPortal. (B) K-M curve between groups with alterations and without alterations. Red line represents cases with alterations, and blue line represents cases without. The X axis indicates overall survival time (days), and the Y axis indicates the survival rate. Kaplan-Meier test was performed. These curves were generated by cBioPortal.
Figure 9
Figure 9. Validation of ROC results of eight lncRNAs in LUSC based on GEO dataset
Blue represents sensitive curve, red indicates identify line. The X axis shows false positive rate, presented as “100%- Specificity%”. The Y axis indicates true positive rate, shown as “Sensitivity”. These curves were performed by GraphPad Prism 6.
Figure 10
Figure 10. Validation of LINC00968 and FENDRR based on 12 paired clinical samples of LUSC
(A) The expression of LINC00968 between para-tumorous lung tissues (pT) and LUSC (RT-qPCR); (B) ROC curve of LINC00968; (C) The correlation of LINC00968 between para-tumorous lung tissues (pT) and LUSC; (D) The expression of FENDRR between para-tumorous lung tissues (pT) and LUSC (RT-qPCR); (E) ROC curve of FENDRR; (F) The correlation of FENDRR between para-tumorous lung tissues (pT) and LUSC. pT: para-noncancerous tissues.
Figure 11
Figure 11. Comparisons of lncRNAs expression between cancer tissues and non-cancerous tissues among 22 types of cancers involved in TCGA based on GEPIA
(A) SFTA1P; (B) LINC00968; (C) LINC00961; (D) LINC01572; (E) RP1-78O14.1; (F) FENDRR (G) LINC01314; (H) LINC01272; (I) GATA6-AS1; (J) MIR3945HG. Y axis indicates the log2 (TPM + 1) for lncRNA expression. Green bar shows the tumor tissues and red bas indicates the non-cancerous tissues. These figures were derived from GEPIA. *: P<0.05. TPM: Transcripts per Kilobase Million.

References

    1. Tajima S, Takanashi Y, Koda K. Squamous cell carcinoma of the lung with highly proliferating fibromatosis-like stroma: a rare phenomenon. Int J Clin Exp Pathol. 2015;8:5870–5876. - PMC - PubMed
    1. Lee E, Jin D, Lee BB, Kim Y, Han J, Shim YM, Kim DH. Negative effect of cyclin D1 overexpression on recurrence-free survival in stage II-IIIA lung adenocarcinoma and its expression modulation by vorinostat in vitro. BMC Cancer. 2015;15:982. - PMC - PubMed
    1. Chiang Y, Yang JC, Hsu FM, Chen YH, Shih JY, Lin ZZ, Lan KH, Cheng AL, Kuo SH. The response, outcome and toxicity of aggressive palliative thoracic radiotherapy for metastatic non-small cell lung cancer patients with controlled extrathoracic diseases. PLoS One. 2015;10:e0145936. - PMC - PubMed
    1. Lin SY, Peng F. Association of SIRT1 and HMGA1 expression in non-small cell lung cancer. Oncol Lett. 2016;11:782–788. - PMC - PubMed
    1. Siegfried JM, Lin Y, Diergaarde B, Lin HM, Dacic S, Pennathur A, Weissfeld JL, Romkes M, Nukui T, Stabile LP. Expression of PAM50 genes in lung cancer: evidence that interactions between hormone receptors and HER2/HER3 contribute to poor outcome. Neoplasia. 2015;17:817–825. - PMC - PubMed