

STAT3 mutation impacts biological and clinical features of T-LGL leukemia
- PMID: 28977911
- PMCID: PMC5617471
- DOI: 10.18632/oncotarget.18711
STAT3 mutation impacts biological and clinical features of T-LGL leukemia
Abstract
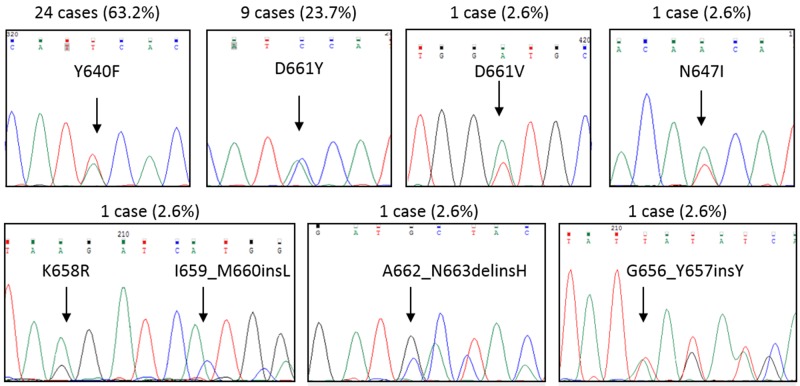
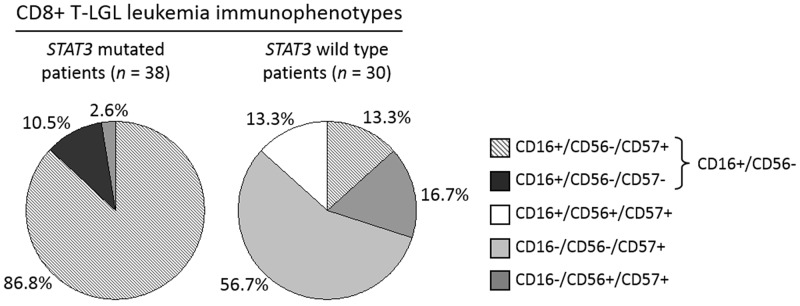
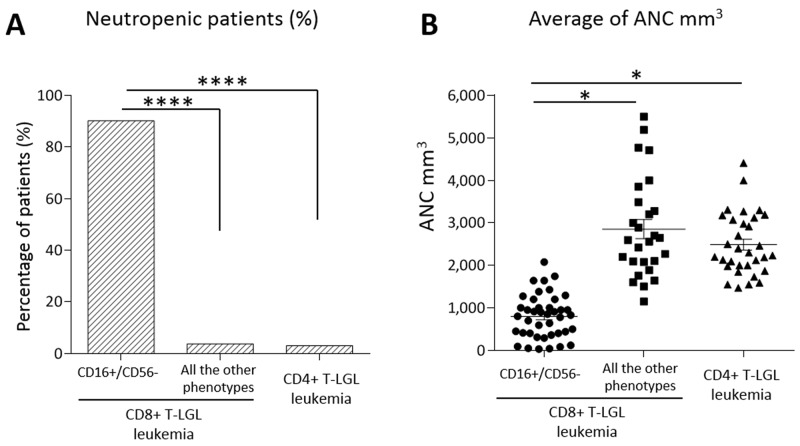
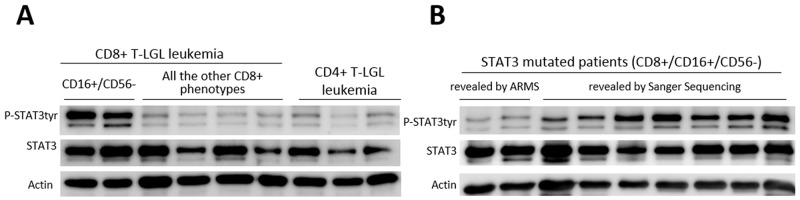
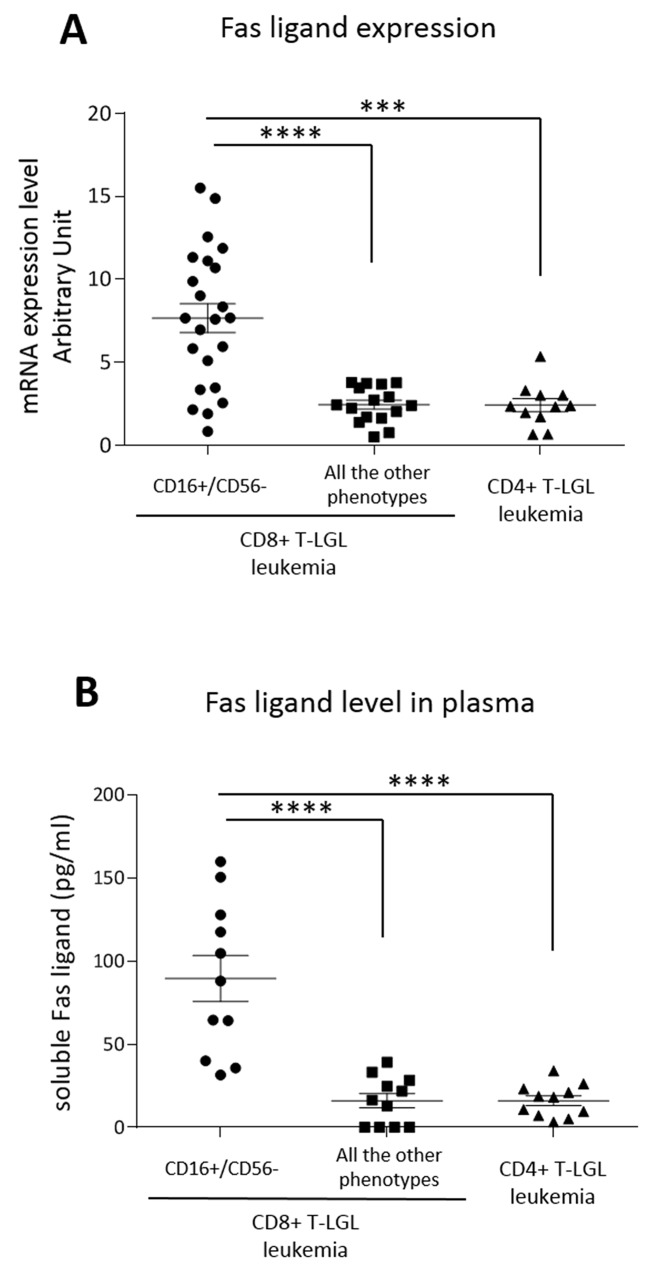
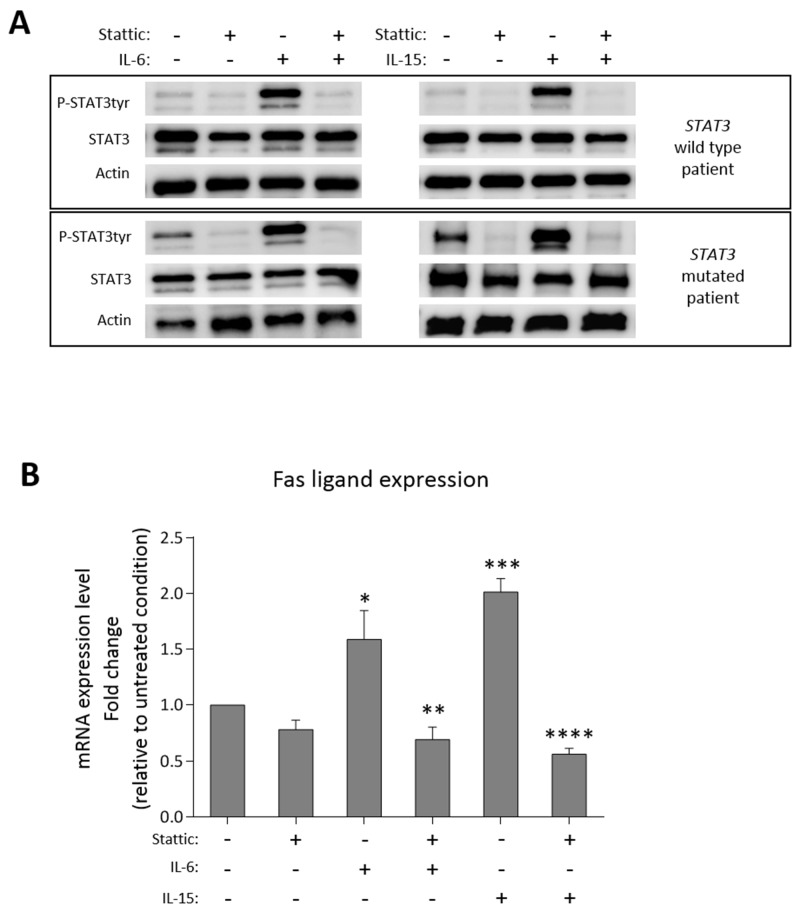
STAT3 mutations have been described in 30-40% of T-large granular lymphocyte (T-LGL) leukemia patients, leading to STAT3 pathway activation. Considering the heterogeneity of the disease and the several immunophenotypes that LGL clone may express, the aim of this work was to evaluate whether STAT3 mutations might be associated with a distinctive LGL immunophenotype and/or might be indicative for specific clinical features. Our series of cases included a pilot cohort of 101 T-LGL leukemia patients (68 CD8+/CD4- and 33 CD4+/CD8±) from Padua Hematology Unit (Italy) and a validation cohort of additional 20 patients from Rennes Hematology Unit (France). Our results indicate that i) CD8+ T-LGL leukemia patients with CD16+/CD56- immunophenotype identify a subset of patients characterized by the presence of STAT3 mutations and neutropenia, ii) CD4+/CD8± T-LGL leukemia are devoid of STAT3 mutations but characterized by STAT5b mutations, and iii) a correlation exists between STAT3 activation and presence of Fas ligand, this molecule resulting highly expressed in CD8+/CD16+/CD56- patients. Experiments with stimulation and inhibition of STAT3 phosphorylation confirmed this relationship. In conclusion, our data show that T-LGL leukemia with specific molecular and phenotypic patterns is associated with discrete clinical features contributing to get insights into molecular bases accounting for the development of Fas ligand-mediated neutropenia.
Keywords: STAT3 mutation; fas ligand; immunophenotype; large granular lymphocyte leukemia; neutropenia.
Conflict of interest statement
CONFLICTS OF INTEREST The authors declare no competing financial interests.
Figures
Similar articles
-
Gamma-delta T-cell large granular lymphocytic leukemia in the setting of rheumatologic diseases.Front Cell Dev Biol. 2024 Aug 1;12:1434676. doi: 10.3389/fcell.2024.1434676. eCollection 2024. Front Cell Dev Biol. 2024. PMID: 39161592 Free PMC article.
-
Cell size variations of large granular lymphocyte leukemia: Implication of a small cell subtype of granular lymphocyte leukemia with STAT3 mutations.Leuk Res. 2016 Jun;45:8-13. doi: 10.1016/j.leukres.2016.04.001. Epub 2016 Apr 4. Leuk Res. 2016. PMID: 27064362
-
Insights Into Genetic Landscape of Large Granular Lymphocyte Leukemia.Front Oncol. 2020 Feb 18;10:152. doi: 10.3389/fonc.2020.00152. eCollection 2020. Front Oncol. 2020. PMID: 32133291 Free PMC article. Review.
-
Uncovering the pathogenesis of large granular lymphocytic leukemia-novel STAT3 and STAT5b mutations.Ann Med. 2014 May;46(3):114-22. doi: 10.3109/07853890.2014.882105. Epub 2014 Feb 11. Ann Med. 2014. PMID: 24512550 Review.
-
Not all LGL leukemias are created equal.Blood Rev. 2023 Jul;60:101058. doi: 10.1016/j.blre.2023.101058. Epub 2023 Feb 20. Blood Rev. 2023. PMID: 36870881 Review.
Cited by
-
Genetics of Immune Dysregulation and Cancer Predisposition: Two Sides of the Same Coin.Clin Exp Immunol. 2022 Dec 15;210(2):114-127. doi: 10.1093/cei/uxac089. Clin Exp Immunol. 2022. PMID: 36165533 Free PMC article. Review.
-
Florid Pulmonary Mycobacterium avium-intracellulare Infection in a Patient With Large Granular Lymphocytic (LGL) Leukemia on Chronic Cyclophosphamide.Cureus. 2021 Nov 19;13(11):e19754. doi: 10.7759/cureus.19754. eCollection 2021 Nov. Cureus. 2021. PMID: 34812338 Free PMC article.
-
Intersection Between Large Granular Lymphocyte Leukemia and Rheumatoid Arthritis.Front Oncol. 2022 May 13;12:869205. doi: 10.3389/fonc.2022.869205. eCollection 2022. Front Oncol. 2022. PMID: 35646651 Free PMC article. Review.
-
Context-dependent T-cell Receptor Gene Repertoire Profiles in Proliferations of T Large Granular Lymphocytes.Hemasphere. 2023 Jul 17;7(8):e929. doi: 10.1097/HS9.0000000000000929. eCollection 2023 Aug. Hemasphere. 2023. PMID: 37469801 Free PMC article.
-
Genomic landscape of TCRαβ and TCRγδ T-large granular lymphocyte leukemia.Blood. 2022 May 19;139(20):3058-3072. doi: 10.1182/blood.2021013164. Blood. 2022. PMID: 35015834 Free PMC article.
References
-
- Semenzato G, Zambello R, Starkebaum G, Oshimi K, Loughran TP., Jr The lymphoproliferative disease of granular lymphocytes: updated criteria for diagnosis. Blood. 1997;89:256–260. - PubMed
-
- Wlodarski MW, Schade AE, Maciejewski JP. T-large granular lymphocyte leukemia: current molecular concepts. Hematology. 2006;11:245–256. - PubMed
-
- Loughran TP., Jr Clonal diseases of large granular lymphocytes. Blood. 1993;82:1–14. - PubMed
-
- Zambello R, Semenzato G. Large granular lymphocytosis. Haematologica. 1998;83:936–942. - PubMed
-
- Baesso I, Pavan L, Boscaro E, Miorin M, Facco M, Trentin L, Agostini C, Zambello R, Semenzato G. T-cell type lymphoproliferative disease of granular lymphocytes (LDGL) is equipped with a phenotypic pattern typical of effector cytotoxic cells. Leuk Res. 2007;31:371–377. - PubMed
LinkOut - more resources
Full Text Sources
Other Literature Sources
Research Materials
Miscellaneous
