. 2017 Jun 28;8(37):61901-61916.
doi: 10.18632/oncotarget.18717. eCollection 2017 Sep 22.

Astrocyte-elevated gene-1 confers resistance to pemetrexed in non-small cell lung cancer by upregulating thymidylate synthase expression

Affiliations

Astrocyte-elevated gene-1 confers resistance to pemetrexed in non-small cell lung cancer by upregulating thymidylate synthase expression

Chung-Yu Chen et al. Oncotarget. .

Abstract

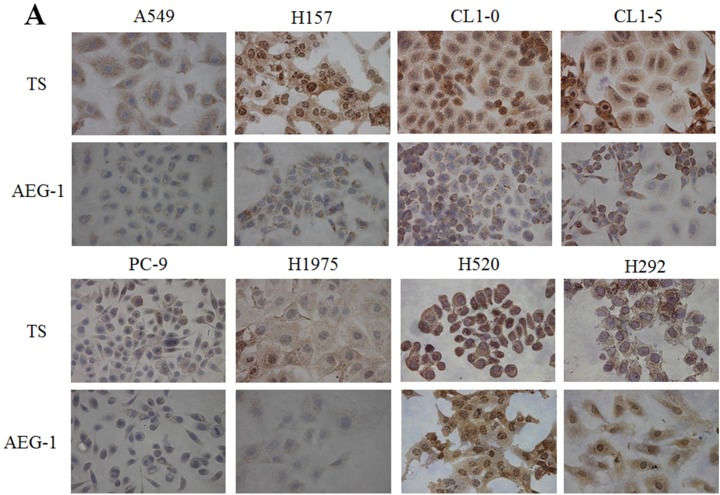
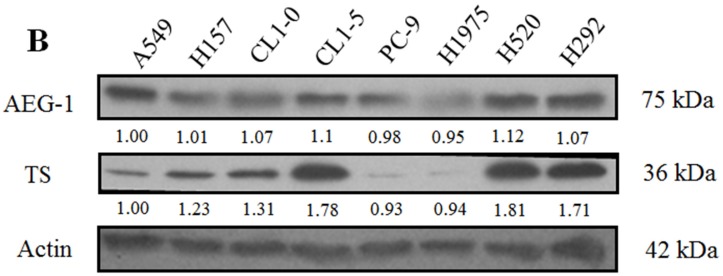
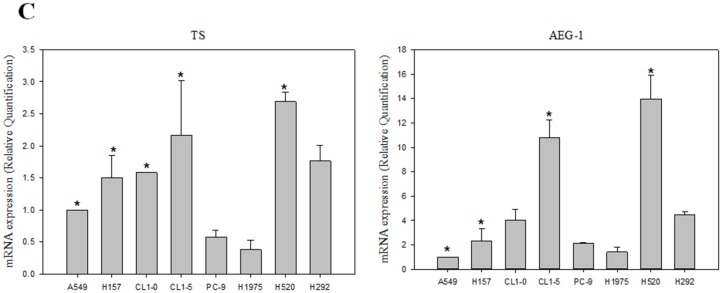
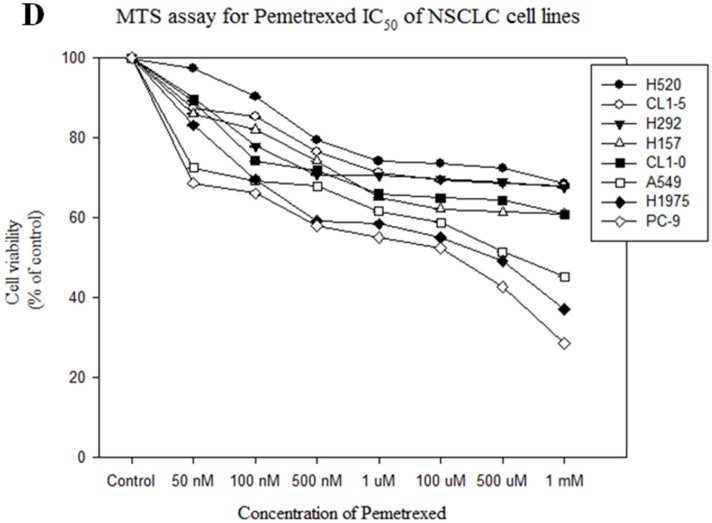
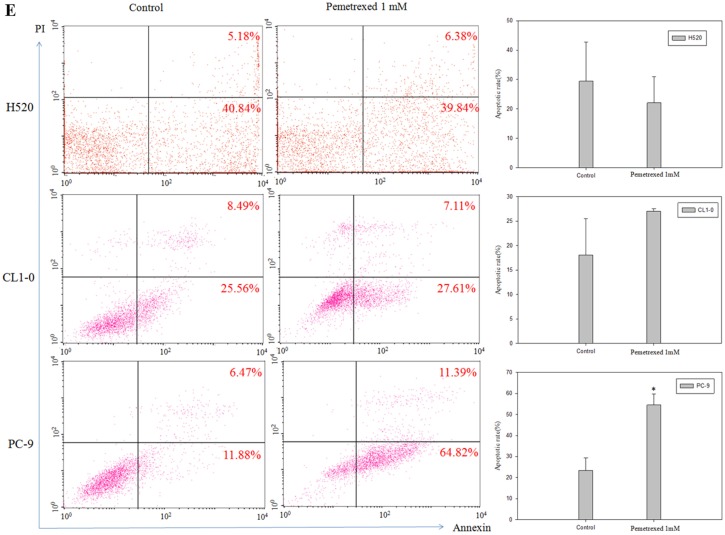
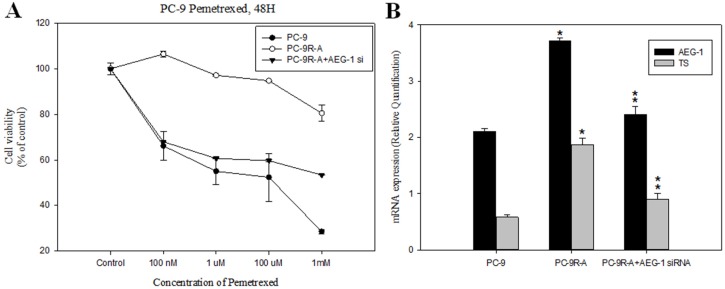
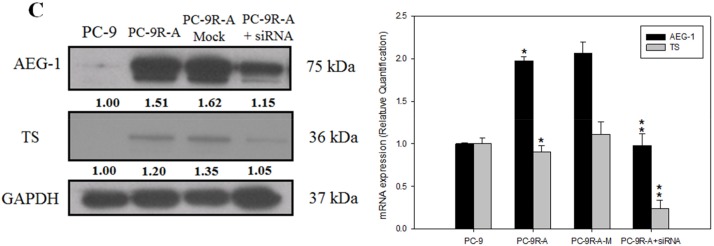
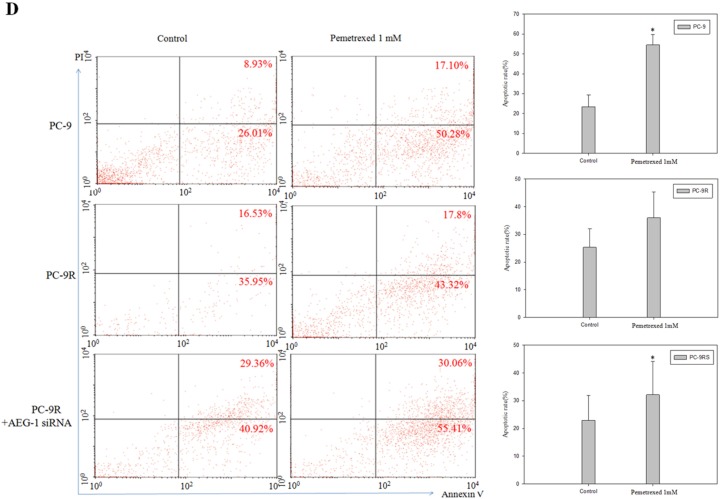
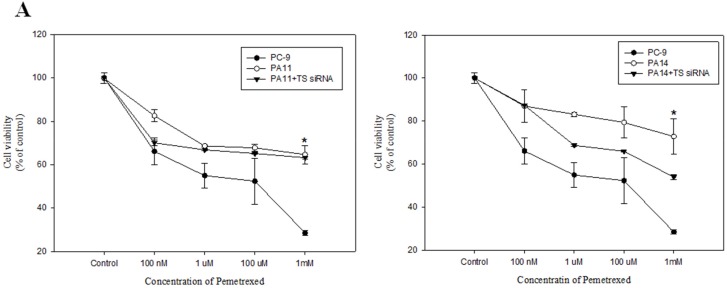
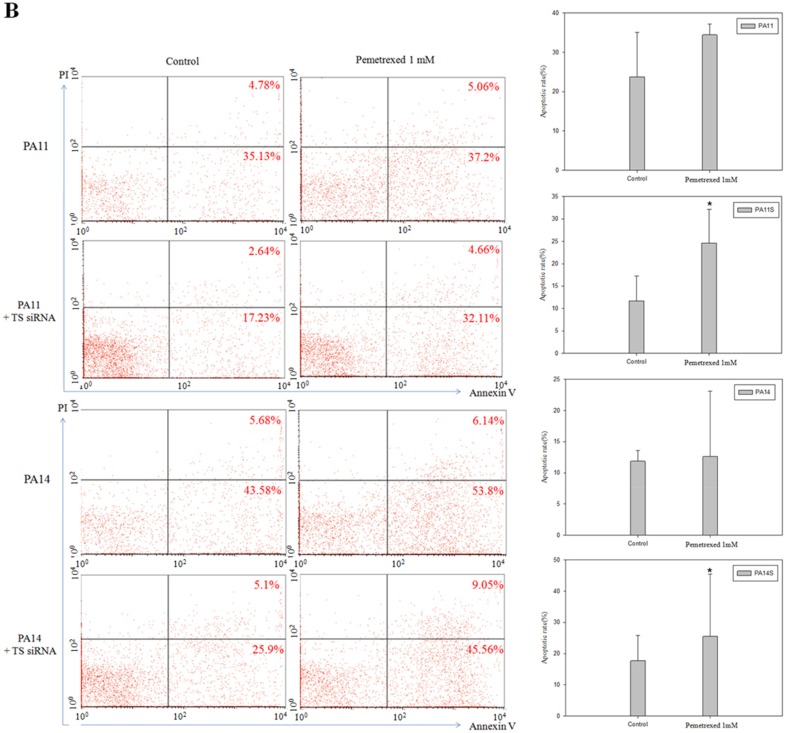
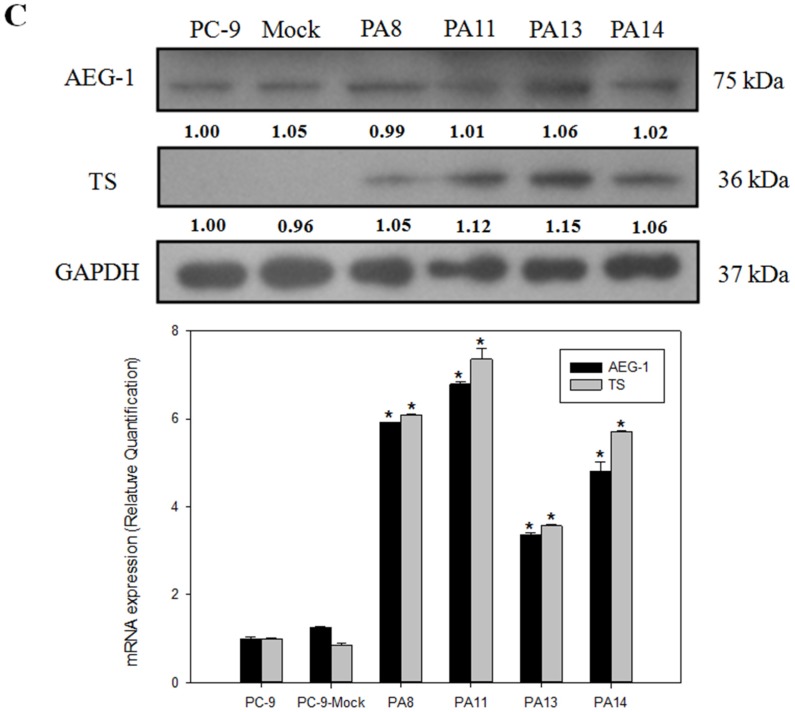
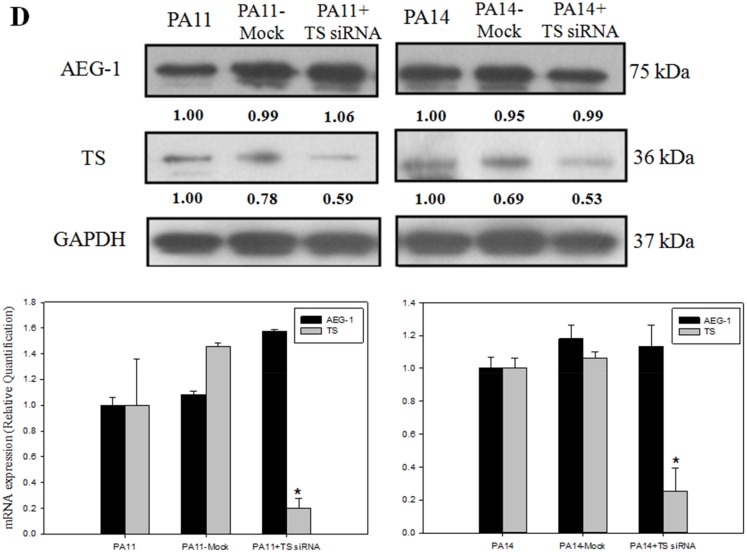
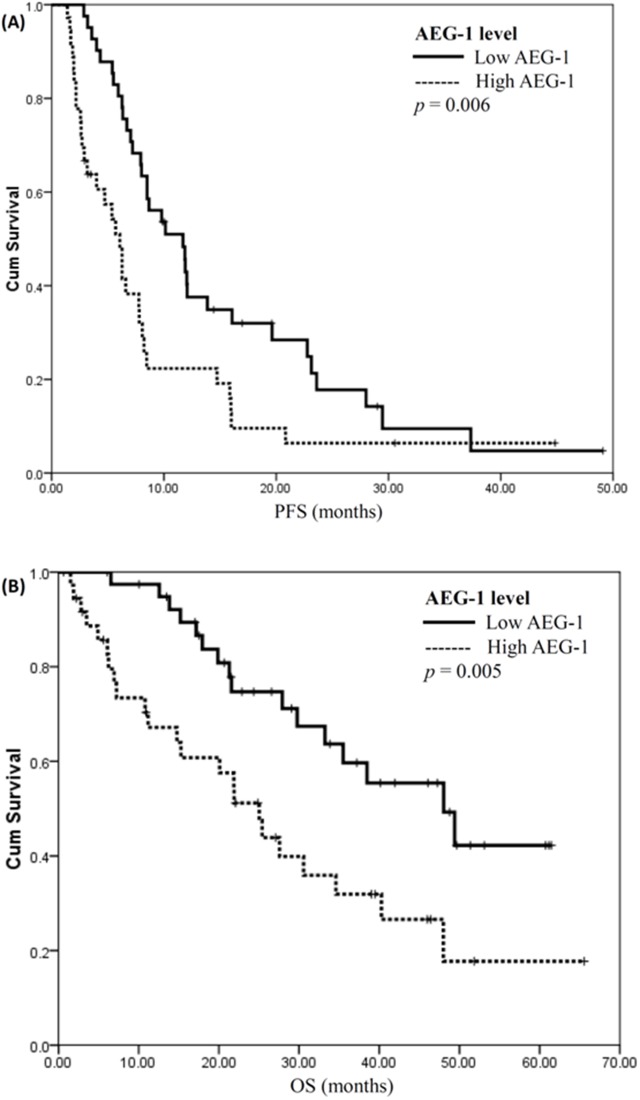
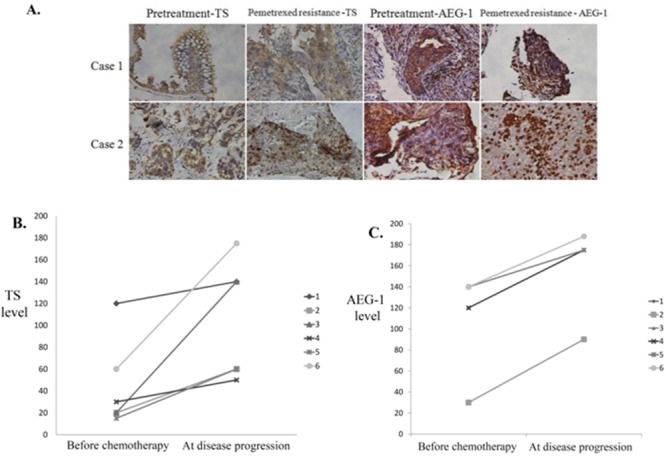
Previous studies have suggested that astrocyte-elevated gene-1 (AEG-1) contributes to the mechanisms of resistance to various chemotherapeutics. In this study, we investigated whether AEG-1 expression level correlated with that of thymidylate synthase (TS), as higher TS expression is known to be associated with the resistance to pemetrexed chemotherapy in patients with advanced lung adenocarcinoma. Using pemetrexed-resistant lung adenocarcinoma PC-9 cell line, we demonstrated that transfection of AEG-1 siRNA lowered TS expression and decreased pemetrexed IC50 value. In contrast, overexpression of AEG-1 was associated with increased expression of TS and higher pemetrexed IC50 value. Immunohistochemical staining of clinical biopsy samples showed that patients with lower AEG-1 expression had longer overall survival time. Moreover, analysis of repeated biopsy samples revealed that an increase in the TS level from baseline to disease progression was significantly associated with the elevation of AEG-1 expression. In conclusion, our data demonstrated that TS expression might be regulated by AEG-1 and that increased expression of these proteins contributes to lung cancer disease progression and may be associated with the development of resistance to pemetrexed.

Keywords: astrocyte elevated gene-1; chemoresistance; lung cancer; pemetrexed; thymidylate synthase.


Conflict of interest statement

CONFLICTS OF INTEREST The authors declare no conflicts of interest.

Figures

Figure 1
Figure 1. Expression of astrocyte-elevated gene-1 and thymidylate synthase in several non-small cell lung cancer cell lines
(A) Immunohistochemical staining revealed upregulation of astrocyte-elevated gene-1 (AEG-1) and thymidylate synthase (TS) protein expression in the primary non-small cell lung cancer (NSCLC) cell lines H157, CL1-0, CL1-5, H520, and H292. (B) Expression of AEG-1 and TS proteins in NSCLC cell lines was analyzed with western blotting. (C) AEG-1 and TS gene expression levels were determined by qPCR. *: compare with PC-9, p < 0.05. (D) Pemetrexed concentration-cell viability relationship was determined in eight NSCLC cell-lines. Lower pemetrexed IC50 values were noted in NSCLC cell lines expressing lower TS levels. (E) Flow cytometry dot plots and quantitative analysis showed apoptosis rates in three representative cell lines (H520, CL1-0, and PC-9) with different TS expression levels. Measurements from control cells and cells treated with pemetrexed are shown.*p < 0.05.
Figure 2
Figure 2. Knockdown of astrocyte-elevated gene-1 in a pemetrexed-resistant non-small cell lung cancer cell line conferred higher sensitivity to pemetrexed
(A) MTT assay demonstrated the restoration of sensitivity to pemetrexed in a pemetrexed-resistant cell line (PC-9R-A) after siRNA-mediated astrocyte-elevated gene-1 (AEG-1) knockdown (PC-9R-A+AEG-1 siRNA transfection). (B) Upregulation of relative AEG-1 and thymidylate synthase (TS) mRNA levels in a pemetrexed-resistant cell line (PC-9R-A) and their sensitivity to siRNA-mediated AEG-1 knockdown (PC-9R-A+AEG-1 siRNA transfection) was revealed by RT-PCR. *: compare with PC-9, p < 0.05; **: compare with PC-9R-A, p < 0.05. (C) Effect of transfection with AEG-1 siRNA on AEG-1 and TS protein (left panel) and gene expression (right panel) levels was detected using western blotting and RT-PCR. *: compare with PC-9, p < 0.05; **: compare with PC-9R-A, p < 0.05. (D) Flow cytometry dot plots and quantitative analysis showed increased apoptosis rate in PC-9R-A cells after AEG-1 knockdown. *p < 0.05.
Figure 3
Figure 3. Overexpression of astrocyte-elevated gene-1 induced thymidylate synthase expression and elevated resistance to pemetrexed
(A) MTS assays demonstrated that astrocyte-elevated gene-1 (AEG-1) overexpressing PA11 and PA14 cell lines were more resistant to pemetrexed action than the primary PC-9 cell line. *p < 0.05. Transfection of cells with thymidylate synthase (TS) siRNA led to partial restoration of pemetrexed inhibitory action on cell viability in AEG-1 overexpressing cell lines PA11 and PA14. (B) Flow cytometry dot plots and quantitative analysis showed increased apoptosis rate in PA11 and PA14 cell lines after TS knockdown. *p < 0.05. (C) Western blotting and RT-PCR demonstrated that overexpression of AEG-1 in cell lines PA8, PA11, PA13, and PA14 led to relatively higher levels of TS expression. *: compare with PC-9, p < 0.05. (D) Decreased TS protein and mRNA levels following transfection of AEG-1-overexpressing cell lines PA11 and PA14 with TS siRNA were detected with western blotting and RT-PCR, respectively. *: compare with PA11 and PA14, p < 0.05, respectively.
Figure 4
Figure 4. Expression level of astrocyte-elevated gene-1 affects disease progression and survival
(A) Progression-free survival plots (PFS) for patients with low and high levels of astrocyte-elevated gene-1 (AEG-1) expression are illustrated. PFS for patients with low AEG-1 expression was significantly longer (low vs. high, 11.7 vs. 6.1 months; P = 0.006, log rank test). (B) Overall survival analysis (OS) for patients with low and high AEG-1 expression levels. OS for patients with low AEG-1 expression was significantly longer (low vs. high, 48.0 vs. 25.0 months; P = 0.005, log rank test).
Figure 5
Figure 5. Increased expression of astrocyte-elevated gene-1 and thymidylate synthase after acquired pemetrexed resistance in lung adenocarcinoma
(A) Immunohistochemical staining for thymidylate synthase (TS) and astrocyte-elevated gene-1 (AEG-1) proteins in tissue samples from two patients before pemetrexed treatment and after the development of pemetrexed resistance. (B) Immunohistochemical staining-derived H-scores for TS (B) and AEG-1 (C) expression levels were obtained in tissues from six patients before chemotherapy and at disease progression. Mean TS H-score increased from 44.2 at baseline to 104.2 at disease progression (P = 0.024), which was concomitant with a comparable increase of AEG-1 H-score from 115.0 to 163.0 (P < 0.001).

Similar articles

Cited by

References

    1. Siegel RL, Miller KD, Jemal A. Cancer statistics, 2016. CA Cancer J Clin. 2016;66:7–30. doi: 10.3322/caac.21332. - DOI - PubMed
    1. Howlader N, Noone AM, Krapcho M, Garshell J, Miller D, Altekruse SF, Kosary CL, Yu M, Ruhl J, Tatalovich Z, Mariotto A, Lewis DR, Chen HS, et al., editors. SEER Cancer Statistics Review, 1975–2012. Bethesda, MD: National Cancer Institute; 2015.
    1. Ettinger DS, Akerley W, Borghaei H, Chang AC, Cheney RT, Chirieac LR, D’Amico TA, Demmy TL, Ganti AK, Govindan R, Grannis FW, Jr, Horn L, Jahan TM, et al. Non-small cell lung cancer. J Natl Compr Canc Netw. 2012;10:1236–1271. - PubMed
    1. Azzoli CG, Baker S, Jr, Temin S, Pao W, Aliff T, Brahmer J, Johnson DH, Laskin JL, Masters G, Milton D, Nordquist L, Pfister DG, Piantadosi S, et al. American Society of Clinical Oncology Clinical Practice Guideline update on chemotherapy for stage IV non-small-cell lung cancer. J Clin Oncol. 2009;27:6251–6266. doi: 10.1200/JCO.2009.23.5622. - DOI - PMC - PubMed
    1. Masters GA, Temin S, Azzoli CG, Giaccone G, Baker S, Jr, Brahmer JR, Ellis PM, Gajra A, Rackear N, Schiller JH, Smith TJ, Strawn JR, Trent D, et al. Systemic therapy for stage IV non-small-cell lung cancer: American Society of Clinical Oncology Clinical Practice Guideline Update. J Clin Oncol. 2015;33:3488–3515. doi: 10.1200/JCO.2015.62.1342. - DOI - PMC - PubMed

LinkOut - more resources