. 2017 May 17;8(40):67152-67168.
doi: 10.18632/oncotarget.17934. eCollection 2017 Sep 15.

Genomic alterations in mucins across cancers

Affiliations

Genomic alterations in mucins across cancers

Ryan J King et al. Oncotarget. .

Abstract

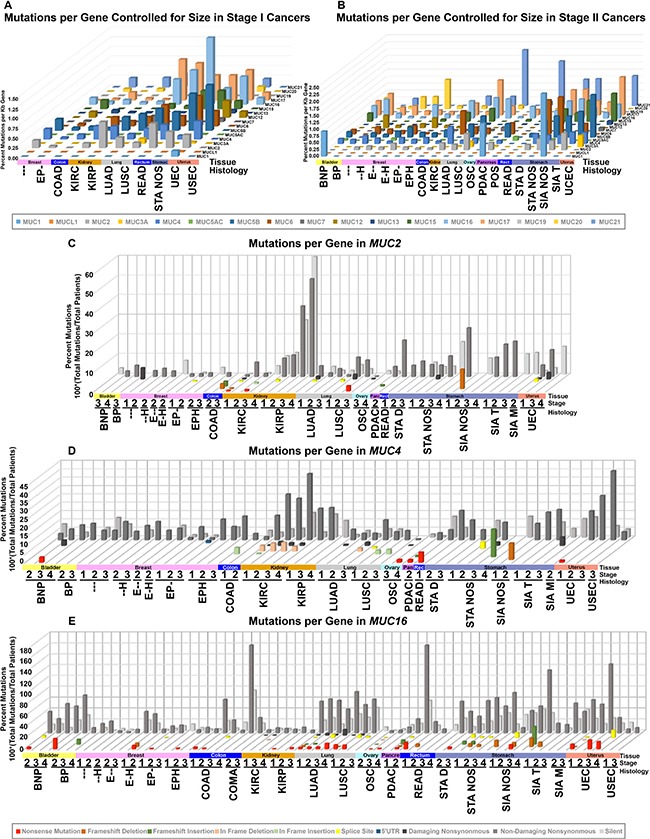
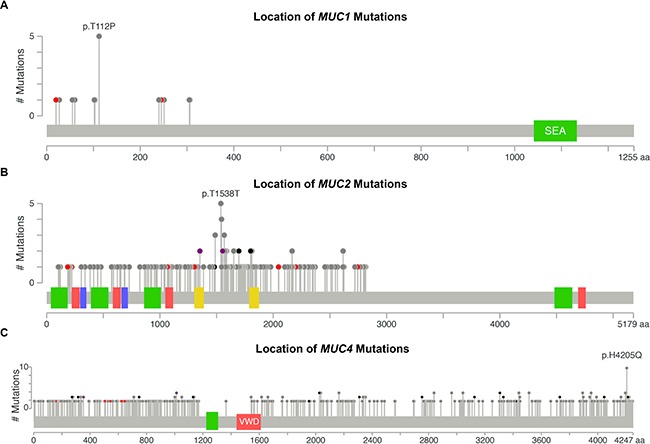
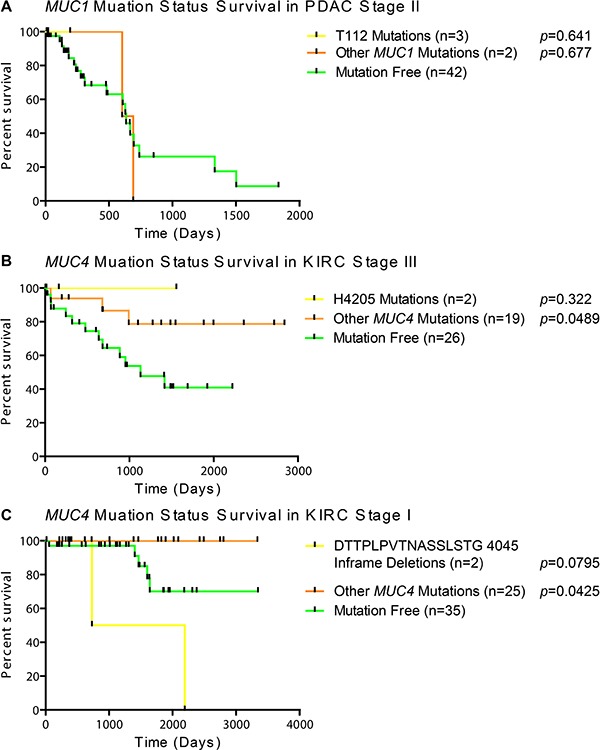
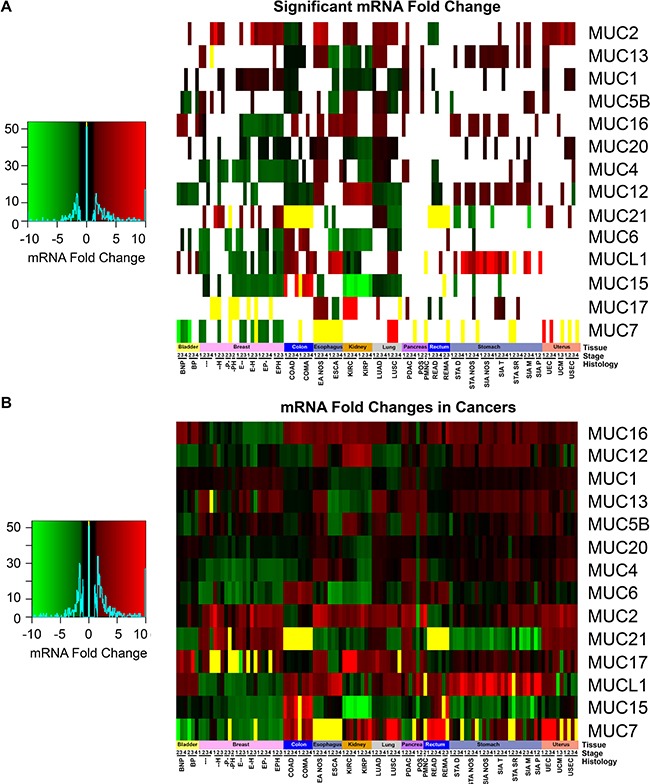
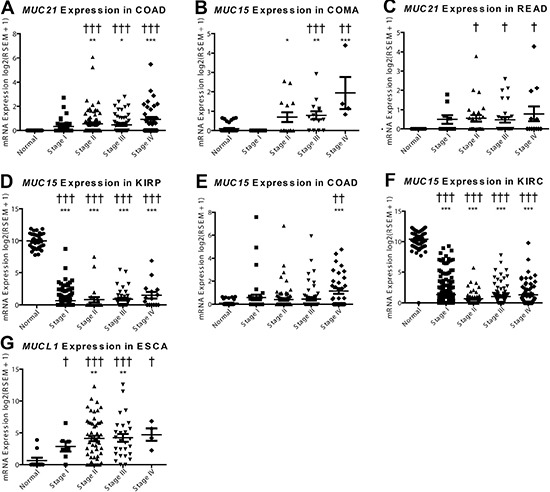
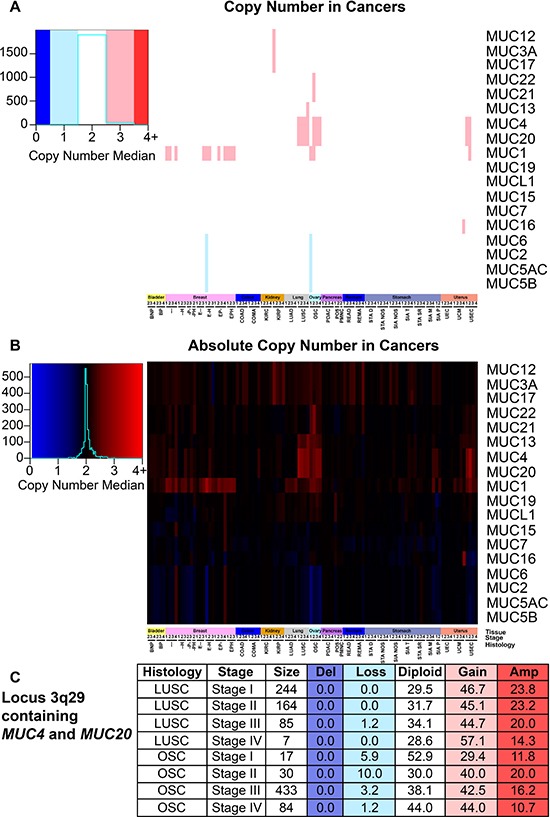
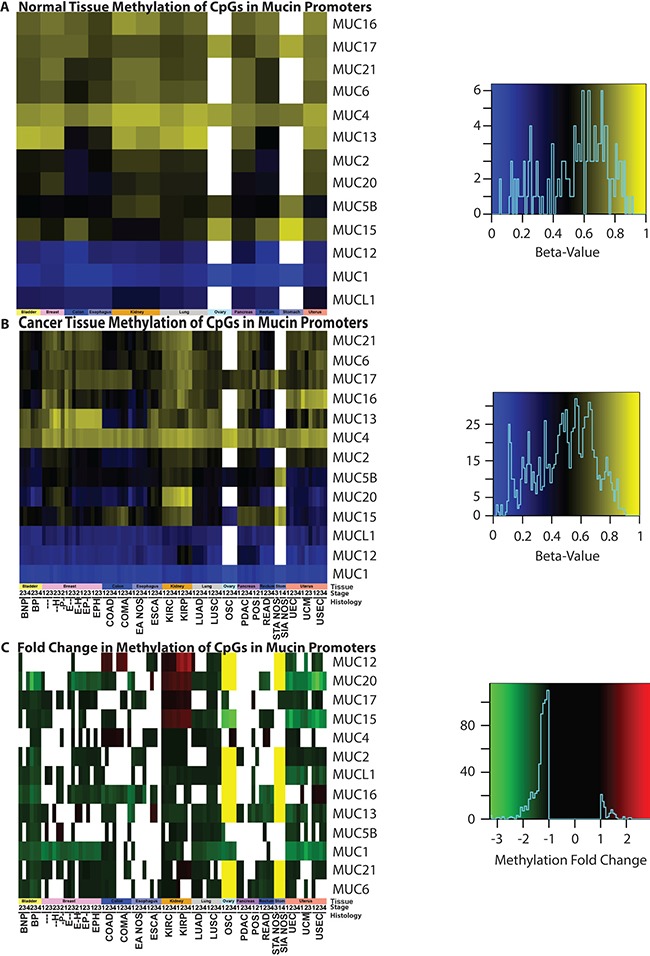
The significance of mucins in cancers has led to the development of novel biomarkers and therapeutic agents against cancers. Despite significant advances in the understanding of mucins, systemic investigations into the role of mucins in cancer biology focusing particularly on the histological subtypes and stages, along with other variables, are yet to be carried out to discover potential novel functions and cancer-specific roles. Here, we investigated 11 mucin expressing cancers for DNA mutations, mRNA expression, copy number, methylation, and the impacts these genomic features may have on patient survival by utilizing The Cancer Genome Atlas dataset. We demonstrate that mucin DNA mutations have a significant rate, pattern, and impact on cancer patient survival depending on the tissue of origin. This includes a frequent T112P mutation in MUC1 that is seen in half of the pancreatic MUC1 mutations, as well as being present in other cancers. We also observed a very frequent MUC4 mutation at H4205, which correlated with survival outcomes in patients. Furthermore, we observed significant alterations in mucin mRNA expression in multiple tumor types. Our results demonstrate de novo expression of certain mucins in cancer tissues, including MUC21 in colorectal cancers. We observed a general decrease in promoter methylation for mucins, which correlated with decreased expression of many genes, such as MUC15 in kidney cancers. Lastly, several mucin gene loci demonstrated copy number increase in multiple histological subtypes. Thus, our study presents a comprehensive analysis of genomic alterations in mucins and their corresponding roles in cancer progression.

Keywords: MUC1; cancer genetic profiles; cancer genetics; genetic alterations; mucins.


Conflict of interest statement

CONFLICTS OF INTEREST The authors declare no conflicts interests exist.

Figures

Figure 1
Figure 1. DNA mutations in histology and stage controlled cohorts
TCGA mutation data was organized into cohorts based on histology and stage for all patients. Cohort names, stages, and specimen sizes can be found in Supplementary Table 1. Cohorts with 10 or more samples were grouped by stage I (A) or stage II (B) and had total patients divided by total mutations to achieve percent mutated. This value was normalized to the kilobase pairs (kb) of the longest transcript possible utilizing the transcription start and end coordinates provided by UCSC genome table browser's list of known genes. The specific type of mutation was examined specifically for MUC2 (C), MUC4 (D), and MUC16 (E). The more damaging the mutation category, the closer it appears (C–E). Shades of red indicate deletion, shades of green for gain, yellow for splice site, blue for noncoding, and shades of grey for single nucleotide variations.
Figure 2
Figure 2. DNA mutations by location
DNA mutations in all cohorts were aggregated together to examine for commonly mutated genomic regions. Figures were generated by cBioPortal Mutation Mapper [44, 45], in which each lollipop denotes a unique mutation location for MUC1 (A), MUC2 (B), and MUC4 (C). Exact mutations with patient identifiers can be found in Supplementary Table 1. Red circles indicate a frameshift, nonsense, or a splice site mutation. Black circles denote inframe additions or deletions. Grey circles indicate either silent or nonsynonymous mutations. Purple indicates multiple color categories reside at the same location. Green, red, or yellow bars indicate domains.
Figure 3
Figure 3. Survival of patients based on mutation status
Patients were split into categories based on histological subtype and stage. A minimal cohort size of two was required to examine if the first amino acid change was shared in any other patient(s). (A) Kaplan Meier survival plot with Mantel-Cox survival analysis in PDAC stage II patients with no mutations in MUC1, only T112P mutations, or any mutations besides T112P. (B) Impact of the most common MUC4 mutations on patient survival by Mantel-Cox analysis in KIRC stage III patients. (C) Mantel-Cox survival analysis demonstrates the impact of a repeated inframe mutation in stage I KIRC patients. Yellow lines indicate survival in patients with the specific mutation, orange lines represent patients with a mutation(s) other than the specified mutation, and green lines indicate survival in patients with no mutations in the given gene. Vertical bars indicates a censorship, due to a living or withdrawn patient. All p-values are from a Mantel-Cox survival analysis comparing the adjacent group to the mutation-free group.
Figure 4
Figure 4. Mucin mRNA expression in cancer
mRNA cohorts were separated based on histology and stage, in which a minimum size of two was taken. Supplementary Table 1 contains the full cohort names and sample sizes. Fold change of mRNA in cancer was compared in relation to adjacent non-cancerous normal tissues. If either all the cancer or normal tissue had zero expression, the fold change was set to zero and colored yellow. (A) Cohorts which had a significant fold change as determined by a Mann-Whitney (p < 0.05) were colored. Cases where Mann-Whitney testing would be impractical had the yellow bars appear in the heatmap. All other cases (p > 0.05) have white where the fold change is insignificant statistically. (B) The fold change between normal tissue and the cancer cohort was displayed regardless of significance. Heatmap color scales are depicted on the left.
Figure 5
Figure 5. De novo expression and silencing of mucins in cancer
mRNA expression was plotted for the normal tissue and for each of the four stages in cancer. A Dunn's test in prism was performed for mRNA differences compared to the normal expression (*p < 0.05; **p < 0.01; ***p < 0.001). Supplementary Table 3 Fisher's exact test was consulted for significance (p < 0.05; ††p < 0.01; †††p < 0.001) to examine if there is a significant change in the expression status, with expression being on or off. Histological subtypes examined include (A) MUC21 in COAD, (B) MUC21 in READ, (C) MUC15 in COMA, (D) MUC15 in COAD, (E) MUC15 in KIRP, (F) MUC15 in KIRC, and (G) MUCL1 in ESCA.
Figure 6
Figure 6. Mucin copy number alterations in cancer
Patients were split into cohorts with a minimum size of two for histology and stage. Supplementary Table 1 contains the full cohort names and sample sizes. Figure key color is determined by the median of the copy number, which was determined by the calculated segmean as described in methods. Heatmap color scales are depicted on the left. (A) Copy number status that deviated at least 0.5 from diploid were rounded and considered to have copy gain or loss. (B) Copy number median is displayed regardless of copy number status. (C) A table highlighting the percentage of patients with the corresponding copy number status for the region 3q29 containing MUC4 and MUC20 in LUSC and OSC. Histology, stage, and patients in the cohort are listed in the first three columns. The percent of patients in the categories are given with the following copy number statuses: deletion (Del; n = 0), copy loss (Loss; n = 1), diploid (Diploid; n = 2), copy gain (Gain; n = 3), and amplified (Amp; n = 4 or greater).
Figure 7
Figure 7. Methylation status of mucins
Promoter methylation was examined in (A) normal tissue and (B) cancer genomes, as well as (C) the resulting fold change. Significant (p < 0.05) fold changes determined by a Mann-Whitney test are colored, where white indicates a non-significant change between normal and cancer promoters. A yellow bar indicates that a 27K methylation chip was analyzed instead of a 450K chip and the gene was not examined in the chip. A minimum sample size of two was required for each cohort. Supplementary Table 1 contains the full cohort names and sample sizes. Heatmap color scales are depicted on the right.

Similar articles

Cited by

References

    1. Bottoni P, Scatena R. The role of CA 125 as tumor marker: biochemical and clinical aspects. Adv Exp Med Biol. 2015;867:229–44. https://doi.org/10.1007/978-94-017-7215-0_14 - DOI - PubMed
    1. Ju T, Wang Y, Aryal RP, Lehoux SD, Ding X, Kudelka MR, Cutler C, Zeng J, Wang J, Sun X, Heimburg-Molinaro J, Smith DF, Cummings RD. Tn and sialyl-Tn antigens, aberrant O-glycomics as human disease markers. Proteomics Clin Appl. 2013;7:618–31. - PMC - PubMed
    1. Andrianifahanana M, Moniaux N, Batra SK. Regulation of mucin expression: mechanistic aspects and implications for cancer and inflammatory diseases. Biochim Biophys Acta. 2006;1765:189–222. https://doi.org/10.1016/j.bbcan.2006.01.002 - DOI - PubMed
    1. Bafna S, Kaur S, Batra SK. Membrane-bound mucins: the mechanistic basis for alterations in the growth and survival of cancer cells. Oncogene. 2010;29:2893–904. https://doi.org/10.1038/onc.2010.87 - DOI - PMC - PubMed
    1. Tang H, Singh S, Partyka K, Kletter D, Hsueh P, Yadav J, Ensink E, Bern M, Hostetter G, Hartman D, Huang Y, Brand RE, Haab BB. Glycan motif profiling reveals plasma sialyl-lewis x elevations in pancreatic cancers that are negative for sialyl-lewis A. Mol Cell Proteomics. 2015;14:1323–33. https://doi.org/10.1074/mcp.M114.047837 - DOI - PMC - PubMed