. 2017 Jun 27;8(40):67422-67438.
doi: 10.18632/oncotarget.18691. eCollection 2017 Sep 15.

GTSE1: a novel TEAD4-E2F1 target gene involved in cell protrusions formation in triple-negative breast cancer cell models

Affiliations

GTSE1: a novel TEAD4-E2F1 target gene involved in cell protrusions formation in triple-negative breast cancer cell models

Debora Stelitano et al. Oncotarget. .

Abstract

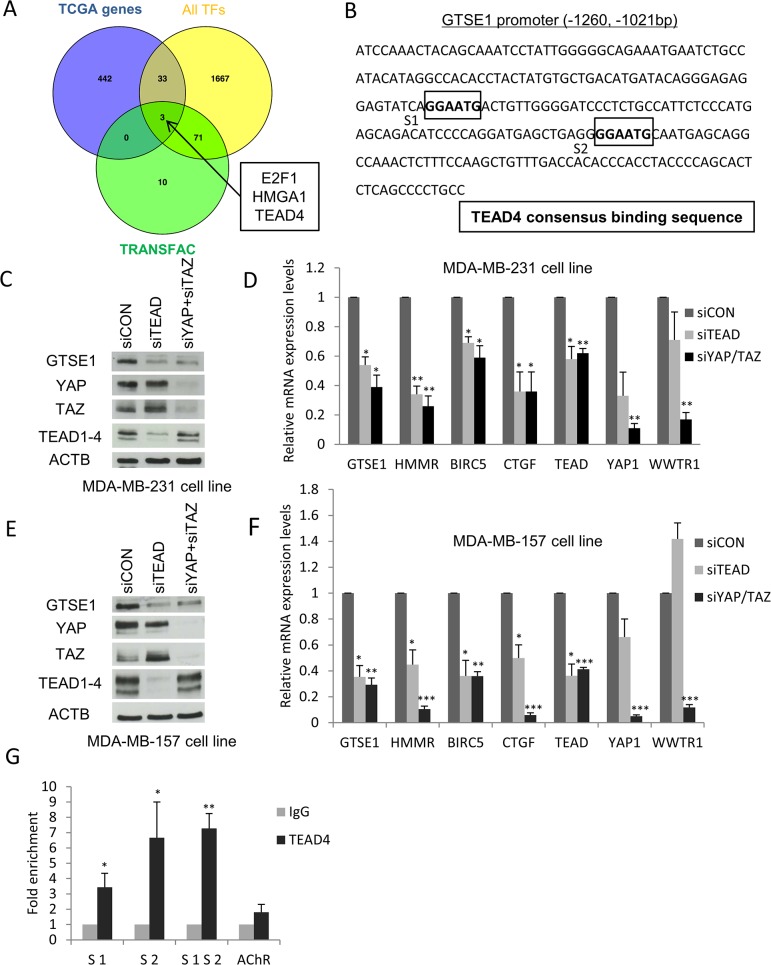
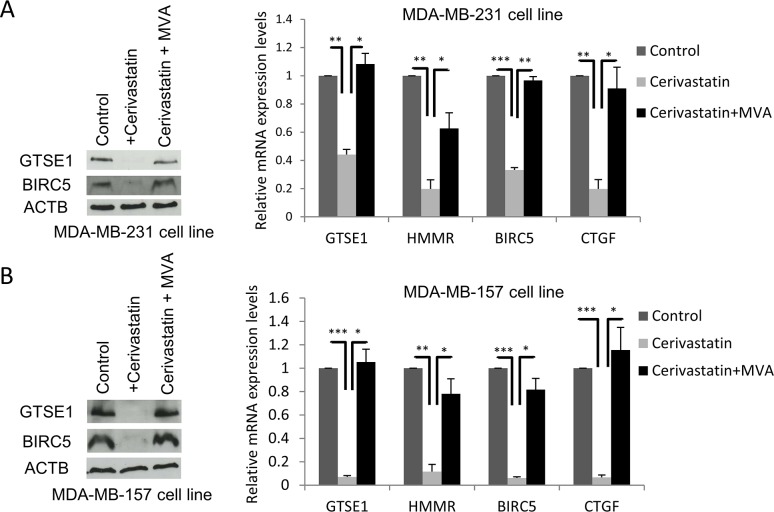
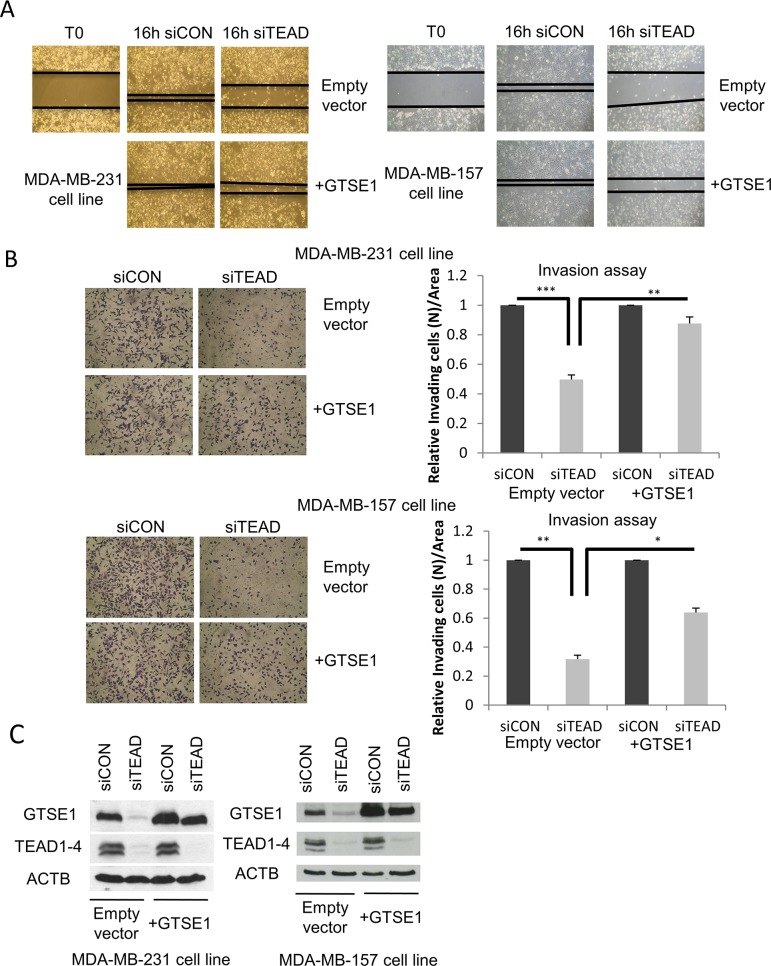
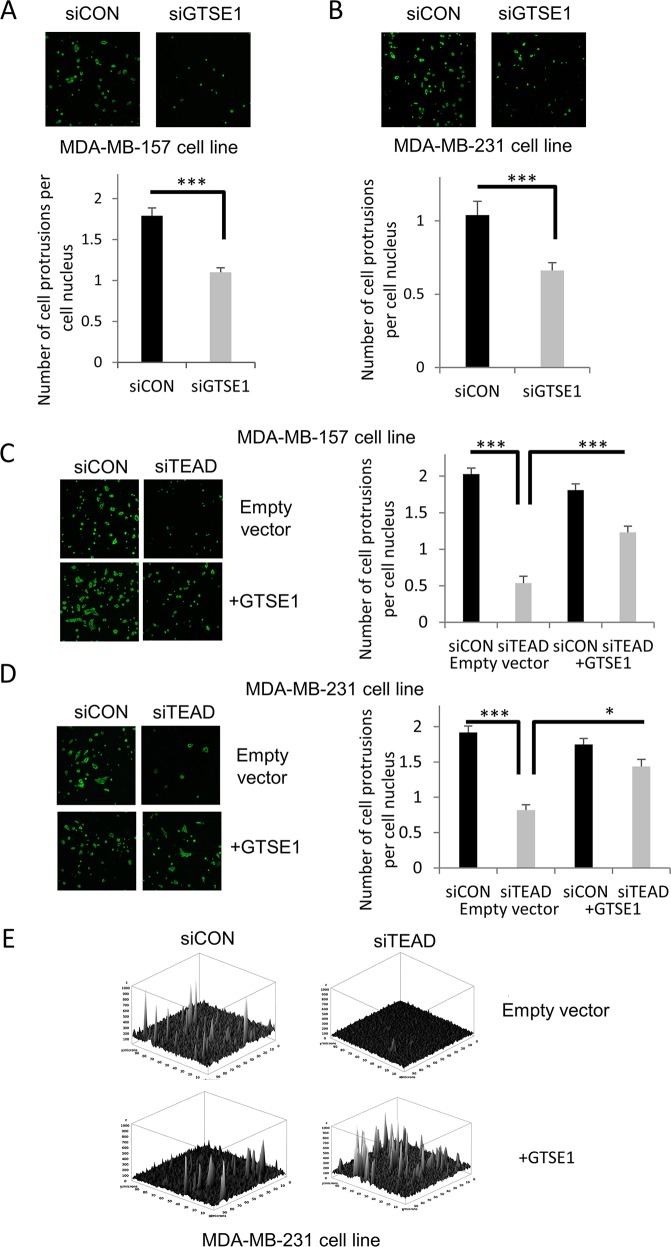
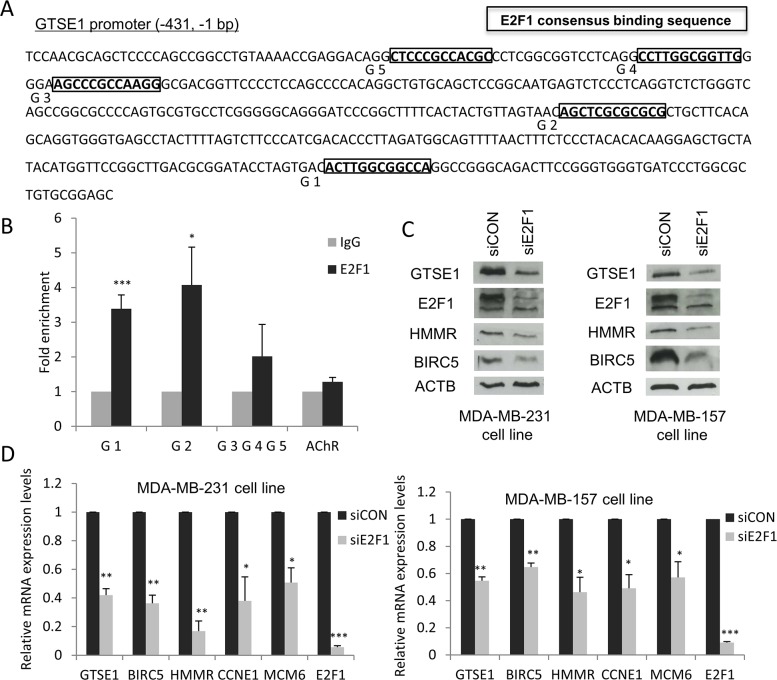
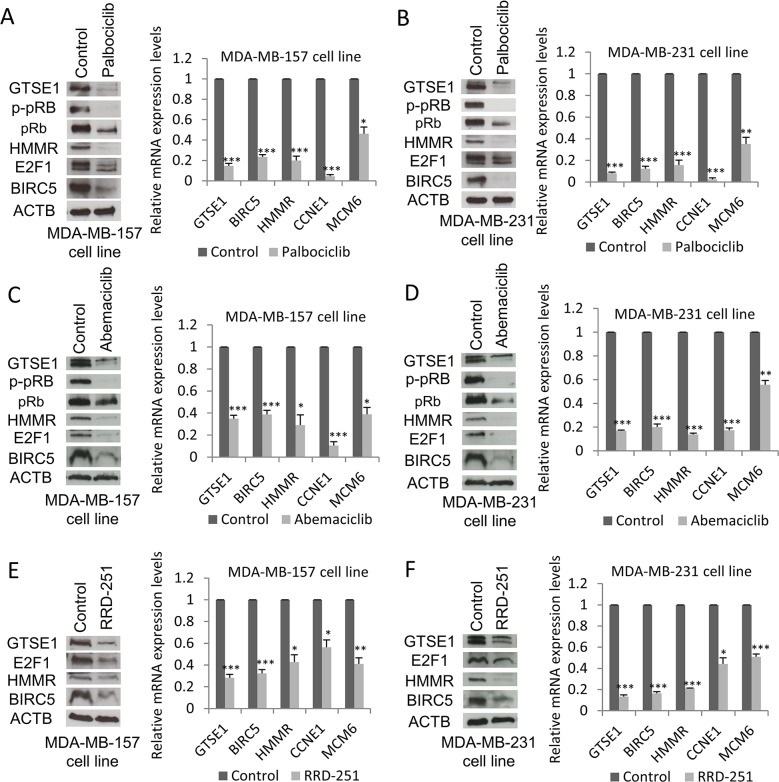
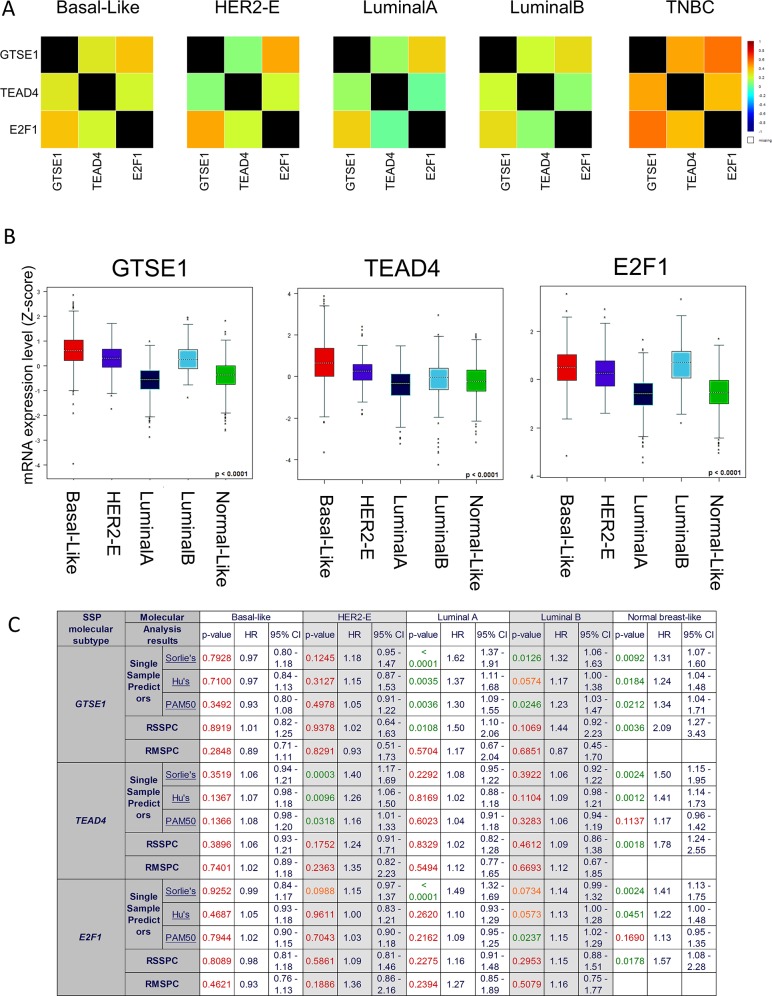
GTSE1 over-expression has been reported as a potential marker for metastasis in various types of malignancies, including breast cancer. Despite this, the transcriptional regulation of this protein and the causes of its misregulation in tumors remain largely unknown. The aims of this work were to elucidate how GTSE1 is regulated at the transcriptional level and to clarify the mechanism underlying GTSE1-dependent cell functions in triple-negative breast cancer (TNBC). Here, we identified GTSE1 as a novel target gene of the TEAD4 transcription factor, highlighting a role for the YAP and TAZ coactivators in the transcriptional regulation of GTSE1. Moreover, we found that TEAD4 controls the formation of cell protrusions required for cell migration through GTSE1, unveiling a relevant effector role for this protein in the TEAD-dependent cellular functions and confirming TEAD4 role in promoting invasion and metastasis in breast cancer. Finally, we highlighted a role for the pRb-E2F1 pathway in the control of GTSE1 transcription and observed that treatment with drugs targeting the pRb-E2F1 or YAP/TAZ-TEAD pathways dramatically downregulated the expression levels of GTSE1 and of other genes involved in the formation of metastasis, suggesting their potential use in the treatment of TNBC.

Keywords: E2F1; GTSE1; TEAD4; YAP/TAZ; cell protrusions.


Conflict of interest statement

CONFLICTS OF INTEREST The authors have not conflicts of interest to declare.

Figures

Figure 1
Figure 1. Identification of TEAD, E2F1 and HMGA1 transcription factors as novel regulators of GTSE1 expression
(A) Comparison of the TCGA-derived list of GTSE1 co-expressed genes (n=478) with TRANSFAC/Match results (n=84) and with the curated list of human known TFs (n=1,774). Among the 36 TFs co-expressed with GTSE1, TRANSFAC/Match only predicted the presence of TFBS for E2F1, HMGA1 and TEAD4 in the GTSE1 promoter. (B) Mapping of the TEAD4 binding sites in the GTSE1 promoter region. (C-F) The TEAD1/3/4 or YAP/TAZ knockdown markedly reduced GTSE1 expression levels. GTSE1 protein and mRNA levels after TEAD1/3/4 or YAP/TAZ silencing by siRNA in MDA-MB-231 (C and D) and MDA-MB-157 cell lines (E and F). Data are presented as mean ± SEM of three independent experiments. For the statistical analysis, Student two-tailed t-test was applied. *p-value<0.05; **p-value<0.01; *** p-value<0.001. (G) TEAD4 physically binds the GTSE1 promoter region. Anti-IgG (control) or anti-TEAD4 antibodies were used in ChIP assays on the MDA-MB-231 cell line. The human muscarinic receptor gene was used as negative control (AChR). Data are presented as mean ± SEM of three independent replicates. For statistical analysis, Student's t-test was applied. *p-value<0.05; **p-value<0.01.
Figure 2
Figure 2. The Mevalonate pathway regulates GTSE1 expression
(A and B) The inhibitor of the Mevalonate pathway cerivastatin significantly decreased GTSE1 expression levels, whereas the addition of mevalonate (MVA) completely abolished its inhibitory effect. (A) GTSE1 protein and mRNA levels after treatment with cerivastatin 1μM alone or in combination with MVA 0.5mmol for 24 hours in MDA-MB-231 cell line. (B) GTSE1 protein and mRNA levels in MDA-MB-157 cell line treated as in A for 72 hours. Data are presented as mean ± SEM of three independent replicates. Student two-tailed t-test was applied for the statistical analysis. *p-value<0.05; **p-value<0.01; ***p-value<0.001.
Figure 3
Figure 3. TEAD regulates breast cancer cell migration and invasion through GTSE1
(A) Representative images of the wound-healing motility assays showing the capability of GTSE1 to rescue the reduced cell migration followed to TEAD1/3/4 silencing. The scratch assay was carried out in MDA-MB-231 (left) and MDA-MB-157 cell lines (right) containing a stably integrated GTSE1 over-expressing construct (pBABE-GTSE1) or an empty vector (pBABE). (B) Representative images of transwell invasion assays showing the ability of GTSE1 to rescue the reduced cell invasion followed to TEAD1/3/4 knockdown. The transwell invasion assays were performed in the same cell lines used for the wound-healing assay. Histograms show the mean number of cells/area that invaded through the transwell inserts after 18 h. Error bars represent the standard error of the mean from three independent experiments. Student two-tailed t-test was applied for statistical analysis. *p-value<0.05; **p-value<0.01; ***p-value<0.001. (C) Western blot of the MDA-MB-231 and MDA-MB-157 cell lines containing a stably integrated construct over-expressing GTSE1 (pBABE-GTSE1) or empty vector (pBABE).
Figure 4
Figure 4. TEAD4 modulates the formation of cell protrusions through GTSE1
(A and B) GTSE1 knockdown significantly reduced the formation of cell protrusions. Representative images of cell protrusions stained for F-actin and histograms representing the number of cell protrusions per cell nucleus after control treatment or GTSE1 silencing in MDA-MB-157 (A) and MDA-MB-231 cell lines (B). (C and D) TEAD silencing dramatically decreased the cell protrusions formation, whereas GTSE1 overexpression partially abolished this effect. The cell protrusions assays were performed in MDA-MB-157 and MDA-MB-231 cell lines containing an empty vector (pBABE) or a stably integrated GTSE1 over-expressing construct (pBABE-GTSE1) and cell protrusions were stained as in A and B. Histograms show the number of cell protrusions per cell nucleus after control treatment or TEAD silencing. All data of this figure are presented as mean ± SEM of three independent experiments. For statistical analysis, Student two-tailed t-test was applied. *p-value<0.05; ***p-value<0.001. (E) Three-dimensional representation of the cell protrusions (MDA-MB-231) showing the differences between conditions also in term of cell surface extensions.
Figure 5
Figure 5. E2F1 modulates GTSE1 expression
(A) Mapping of the E2F1 binding sites in the GTSE1 promoter region. (B) Results of the ChIP assays showing that E2F1 physically binds the G1 and G2 sites in GTSE1 promoter. Anti-IgG (control) or anti-E2F1 antibodies were used in ChIP assays on the MDA-MB-231 cell line. AChR was used as negative control. Data are presented as mean ± SEM of at least three independent replicates. For statistical analysis, Student's t-test was applied. *p-value<0.05; ***p-value<0.001. (C and D) GTSE1 expression levels significantly decreased after E2F1 silencing. GTSE1 protein (C) and mRNA levels (D) after knockdown of E2F1 in MDA-MB-231 and MDA-MB-157 cell lines. Data are presented as mean ± SEM of three independent experiments. For statistical analysis, Student two-tailed t-test was applied. *p-value<0.05; **p-value<0.01; ***p-value<0.001.
Figure 6
Figure 6. GTSE1 expression levels decrease after treatment with pRb-E2F1 pathway inhibitors
GTSE1 protein and mRNA levels in MDA-MB-157 and MDA-MB-231 cell lines treated respectively with: palbociclib 1μM (A) and 0.5μM for 24h (B); abemaciclib 0.5μM for 24h (C and D); RRD-251 100μM for 24 hours (E and F). Data are presented as mean ± SEM of three independent experiments. For statistical analysis, Student two-tailed t-test was applied. *p-value<0.05; **p-value<0.01; ***p-value<0.001.
Figure 7
Figure 7. GTSE1, E2F1, TEAD4 Expression levels in Breast Cancer Subtypes
(A) Correlation heatmaps of the gene expression levels of GTSE1, E2F1, TEAD4 in the different breast cancer subtypes (PAM50 classification). (B) Boxplot representation of the gene expression levels of GTSE1, E2F1, TEAD4 in the different breast cancer subtypes (PAM50 classification). (C) Univariate cox proportional hazards analyses for GTSE1, E2F1, TEAD4 in the different breast cancer subtypes. Several molecular classifications are presented: Single Sample Predictor (SPP), Robust SSP Classification Robust Molecular (RSSPC) and Robust Molecular Subtype Predictors Classification (RMSPC). P-values were colored accordingly to their statistical significance (green p < 0.05; orange 0.05 < p < 0.1; red p > 0.1).

Similar articles

Cited by

References

    1. Weigelt B, Peterse JL, van't Veer LJ. Breast cancer metastasis: markers and models. Nat Rev Cancer. 2005;5:591–602. doi: 10.1038/nrc1670. - DOI - PubMed
    1. Caldas C, Stingl J. Molecular heterogeneity of breast carcinomas and the cancer stem cell hypothesis. Nat Rev Cancer. 2007;7:791–9. doi: 10.1038/nrc2212. - DOI - PubMed
    1. Mayer IA, Abramson VG, Lehmann BD, Pietenpol JA. New strategies for triple-negative breast cancer-deciphering the heterogeneity. Clin Cancer Res. 2014;20:782–90. doi: 10.1158/1078-0432.CCR-13-0583. - DOI - PMC - PubMed
    1. Scolz M, Widlund PO, Piazza S, Bublik DR, Reber S, Peche LY, Ciani Y, Hubner N, Isokane M, Monte M, Ellenberg J, Hyman AA, Schneider C, et al. GTSE1 Is a microtubule plus-end tracking protein that regulates eb1-dependent cell migration. PLoS One. 2012;7:e51259. doi: 10.1371/journal.pone.0051259. - DOI - PMC - PubMed
    1. Utrera R, Collavin L, Lazarević D, Delia D, Schneider C. A novel p53-inducible gene coding for a microtubule-localized protein with G2-phase-specific expression. EMBO J. 1998;17:5015–25. doi: 10.1093/emboj/17.17.5015. - DOI - PMC - PubMed

LinkOut - more resources