. 2017 Jun 27;8(40):67439-67456.
doi: 10.18632/oncotarget.18698. eCollection 2017 Sep 15.

Survival of metastatic melanoma patients after dendritic cell vaccination correlates with expression of leukocyte phosphatidylethanolamine-binding protein 1/Raf kinase inhibitory protein

Affiliations

Survival of metastatic melanoma patients after dendritic cell vaccination correlates with expression of leukocyte phosphatidylethanolamine-binding protein 1/Raf kinase inhibitory protein

Sonja I Buschow et al. Oncotarget. .

Abstract

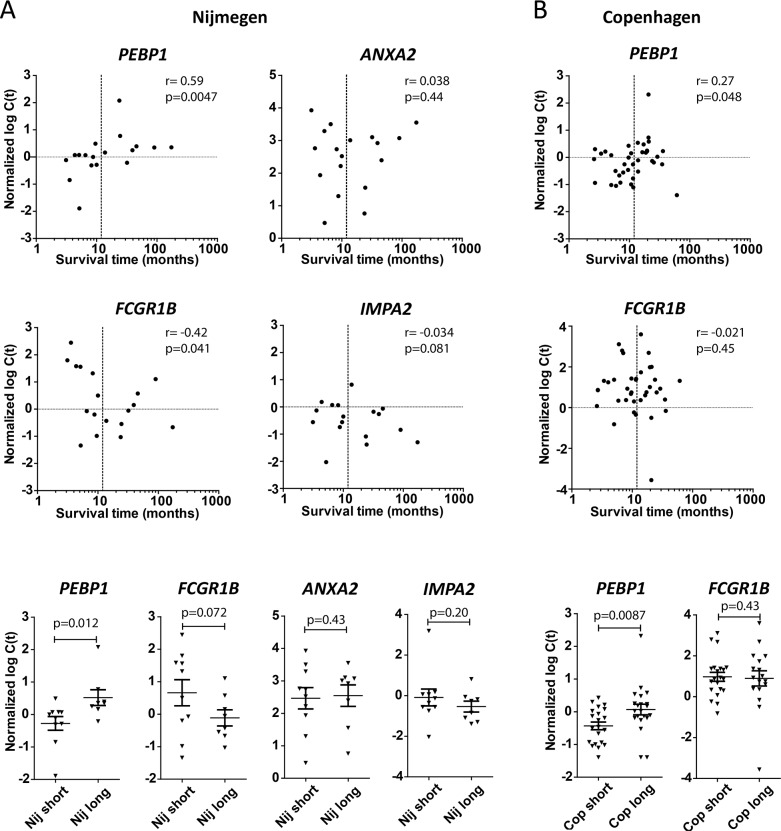
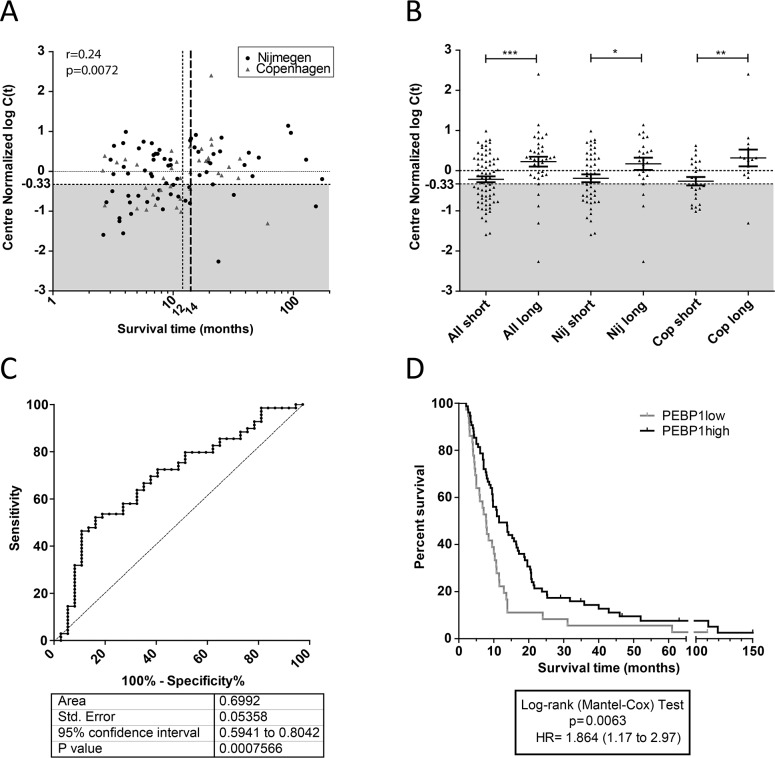
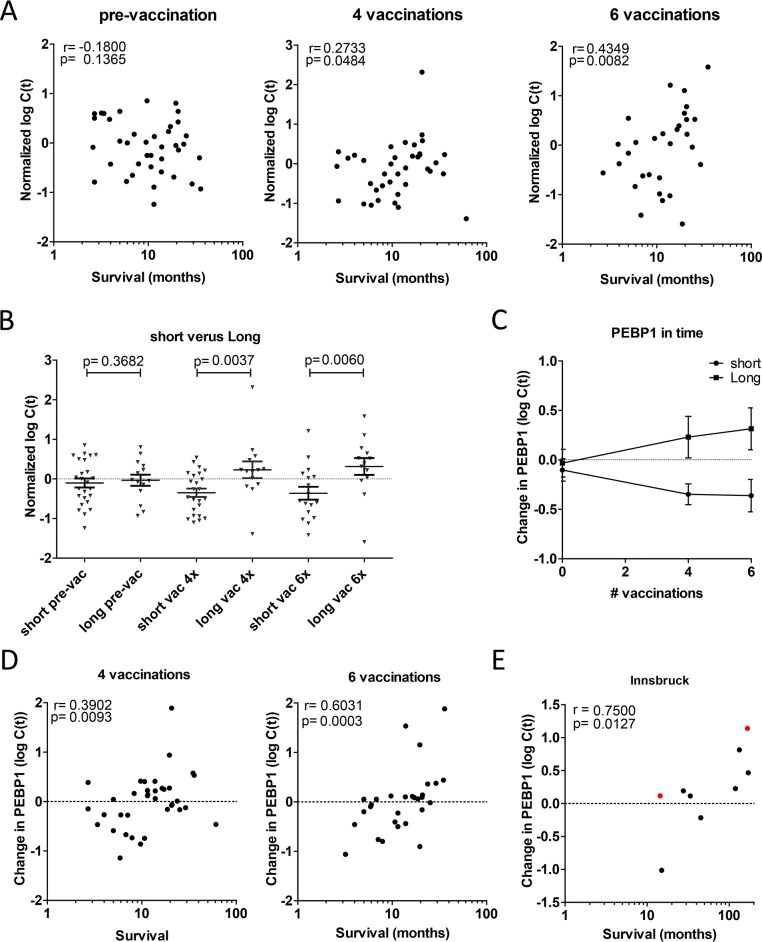
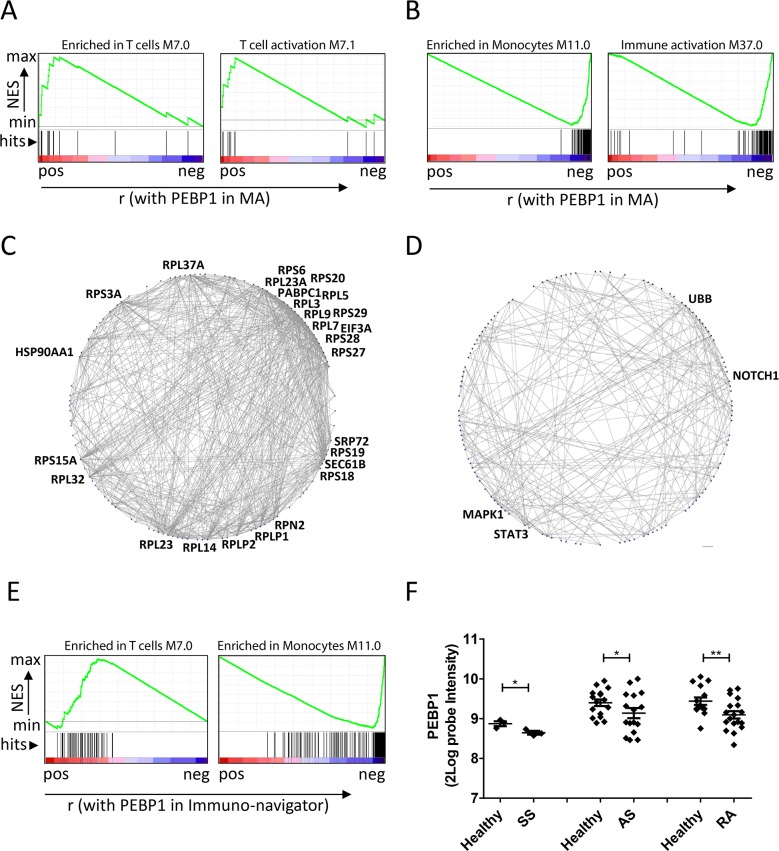
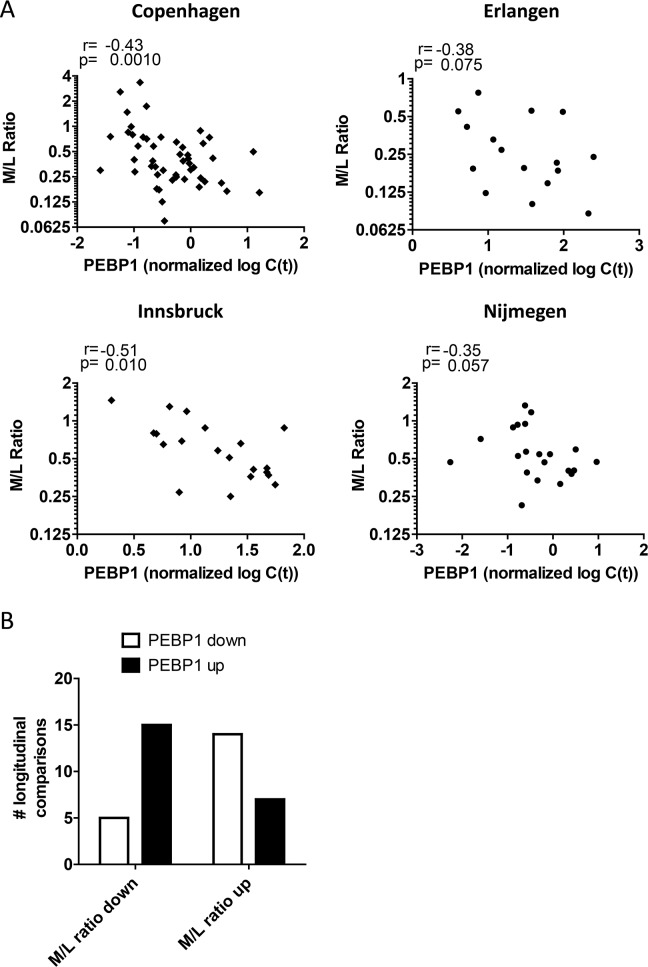
Immunotherapy for metastatic melanoma offers great promise but, to date, only a subset of patients have responded. There is an urgent need to identify ways of allocating patients to the most beneficial therapy, to increase survival and decrease therapy-associated morbidity and costs. Blood-based biomarkers are of particular interest because of their straightforward implementation in routine clinical care. We sought to identify markers for dendritic cell (DC) vaccine-based immunotherapy against metastatic melanoma through gene expression analysis of peripheral blood mononuclear cells. A large-scale microarray analysis of 74 samples from two treatment centers, taken directly after the first round of DC vaccination, was performed. We found that phosphatidylethanolamine binding protein 1 (PEBP1)/Raf Kinase inhibitory protein (RKIP) expression can be used to identify a significant proportion of patients who performed poorly after DC vaccination. This result was validated by q-PCR analysis on blood samples from a second cohort of 95 patients treated with DC vaccination in four different centers. We conclude that low PEBP1 expression correlates with poor overall survival after DC vaccination. Intriguingly, this was only the case for expression of PEBP1 after, but not prior to, DC vaccination. Moreover, the change in PEBP1 expression upon vaccination correlated well with survival. Further analyses revealed that PEBP1 expression positively correlated with genes involved in T cell responses but inversely correlated with genes associated with myeloid cells and aberrant inflammation including STAT3, NOTCH1, and MAPK1. Concordantly, PEBP1 inversely correlated with the myeloid/lymphoid-ratio and was suppressed in patients suffering from chronic inflammatory disease.

Keywords: PEBP1; dendritic cell vaccination; immune suppression; immunotherapy; melanoma.


Conflict of interest statement

CONFLICTS OF INTEREST The authors declare no conflicts of interest

Figures

Figure 1
Figure 1. Validation on independent samples
Samples from Nijmegen (Nij) that had not been part of the microarray (MA) study (A) and samples from a third completely-independent treatment center, Copenhagen (Cop; B), were tested to validate the MA-predicted association with patient survival. Upper panels: expression (qPCR) versus survival time. Spearman r and p-value (one-tailed) are given. Lower panels: expression (qPCR) of indicated genes in short (<1 year) versus long (>1 year) surviving patients in the two treatment centers. p-value by t-test (one-tailed).
Figure 2
Figure 2. Expression of PEBP1 is of value for treatment decision
(A) Spearman correlation of center-normalized expression values for PEBP1 with survival time after DC vaccination (one-tailed p-value). Grey area: population of patients with low expression of PEBP1 (<-0.33) that have predominantly a limited survival. Specifically indicated are the original 12-month (dotted line) and the adjusted 14-month (broken line in bold) survival windows. (B) Center-normalized expression of PEBP1 in all evaluated patient samples from Nijmegen and Erlangen (discovery and validation together; one-sides p-values by t-test). (C) Reciever operater curve (ROC) of all Nijmegen and Copenhagen samples combined to select short survivors based on low expression of PEBP1. (D) Kaplan-Meyer curve of patients having a PEBP1 expression level below or above −0.33 (2 log center normalized C(t)).
Figure 3
Figure 3. Change in PEBP1 expression correlates with survival after vaccination
(A-D) Expression of PEBP1 was assessed in Copenhagen patients prior to or after 4 or 6 rounds of vaccination. (A) Spearman correlation of PEBP1 at the 3 time-points (p-value one-tailed). Respectively n=39, n=38 and n=30 pre-, after 4 and after 6 vaccinations. (B) Expression of PEBP1 at each time-point in short (<14 months) or long survivors (> 14 months). Ns= non-significant * p<0.05 ** p<0.01 by t-test (one-tailed). (C) Course of PEBP1 expression during successive rounds of vaccination in short and long survivors (Mean +/− SEM). (D) Spearman correlation of survival time with the change in PEBP1 expression with respect to the start of vaccination (p-value one-tailed). E Change in PEBP1 expression in relation to survival in patient samples from Innsbruck (n=7 stage IV in black; n=2 stage III in red).
Figure 4
Figure 4. PEBP1 expression reflects metabolic and inflammatory state
(A and B) Examples of BTMs that were found enriched by GSEA in the genes correlating to PEBP1 in the microarray dataset. Genes positively correlated to PEBP1 (A) were enriched in BTMs related to T cell (activation), whereas those negatively correlating with PEBP1 were enriched in BTMs related to monocytes and general inflammation (A). (C and D) Protein-protein Interactions (PPI) present in the STRING database for the top 500 genes positively (C) or negatively correlating to PEBP1 (D). Shown are genes for which the STRING database reported an interaction with a high confidence score (0.7) and more than one connection. Gene symbols are only displayed for genes with at least 20 (left graph) or 10 connections (right graph). (E) Enrichment of genes from the T cell and monocyte module within a list of genes ranked on correlation with PEBP1 in the Immuno-Navigator database. F) Expression of PEBP1 in blood or PBMC samples of healthy donors versus patients suffering from Ankylosing spondylitis (AS; GDS5231), Schnitzler syndrome (SS; GSE70019) and rheumatoid arthritis (RA; GDS3794) as retrieved using GEO2R.
Figure 5
Figure 5. Blood PEBP1 expression anti-correlates with the myeloid/lymphoid balance
(A) Spearman rank correlation of PEBP1 expression with the myeloid/lymphocyte (M/L) balance determined by flow cytometry at the time of sample collection for all four treatment centers. (B) Quantification of the direction of change of PEBP1 with respect to the M/L balance in sequential longitudinal samples from Copenhagen (see also figure 3).

Similar articles

Cited by

References

    1. Balch CM, Gershenwald JE, Soong SJ, Thompson JF, Atkins MB, Byrd DR, Buzaid AC, Cochran AJ, Coit DG, Ding S, Eggermont AM, Flaherty KT, Gimotty PA, et al. Final version of 2009 AJCC melanoma staging and classification. J Clin Oncol. 2009;27:6199–6206. - PMC - PubMed
    1. Erdmann F, Lortet-Tieulent J, Schuz J, Zeeb H, Greinert R, Breitbart EW, Bray F. International trends in the incidence of malignant melanoma 1953-2008--are recent generations at higher or lower risk? Int J Cancer. 2013;132:385–400. - PubMed
    1. Ascierto ML, Melero I, Ascierto PA. Melanoma: from incurable beast to a curable bet. The success of immunotherapy. Front Oncol. 2015;5:152. - PMC - PubMed
    1. Fukuhara H, Ino Y, Todo T. Oncolytic virus therapy: a new era of cancer treatment at dawn. Cancer Sci. 2016;107:1373–1379. - PMC - PubMed
    1. Ott PA, Hodi FS, Robert C. CTLA-4 and PD-1/PD-L1 blockade: new immunotherapeutic modalities with durable clinical benefit in melanoma patients. Clin Cancer Res. 2013;19:5300–5309. - PubMed