. 2017 Jun 27;8(40):67482-67496.
doi: 10.18632/oncotarget.18713. eCollection 2017 Sep 15.

Restoring microenvironmental redox and pH homeostasis inhibits neoplastic cell growth and migration: therapeutic efficacy of esomeprazole plus sulfasalazine on 3-MCA-induced sarcoma

Affiliations

Restoring microenvironmental redox and pH homeostasis inhibits neoplastic cell growth and migration: therapeutic efficacy of esomeprazole plus sulfasalazine on 3-MCA-induced sarcoma

Enrica Balza et al. Oncotarget. .

Abstract

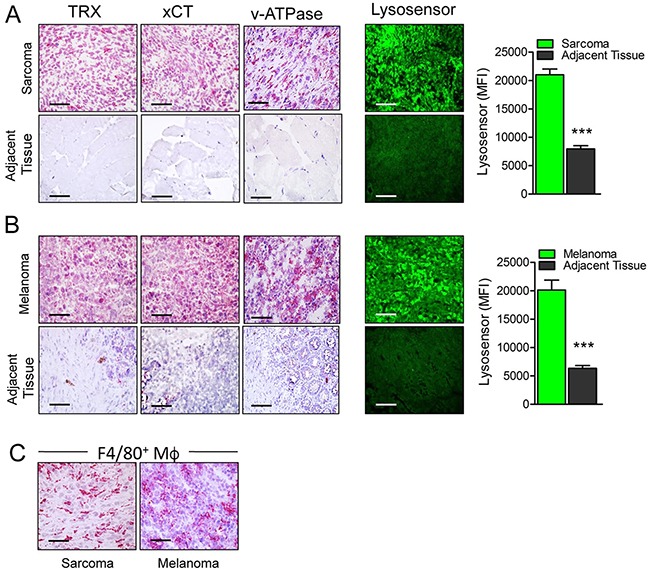
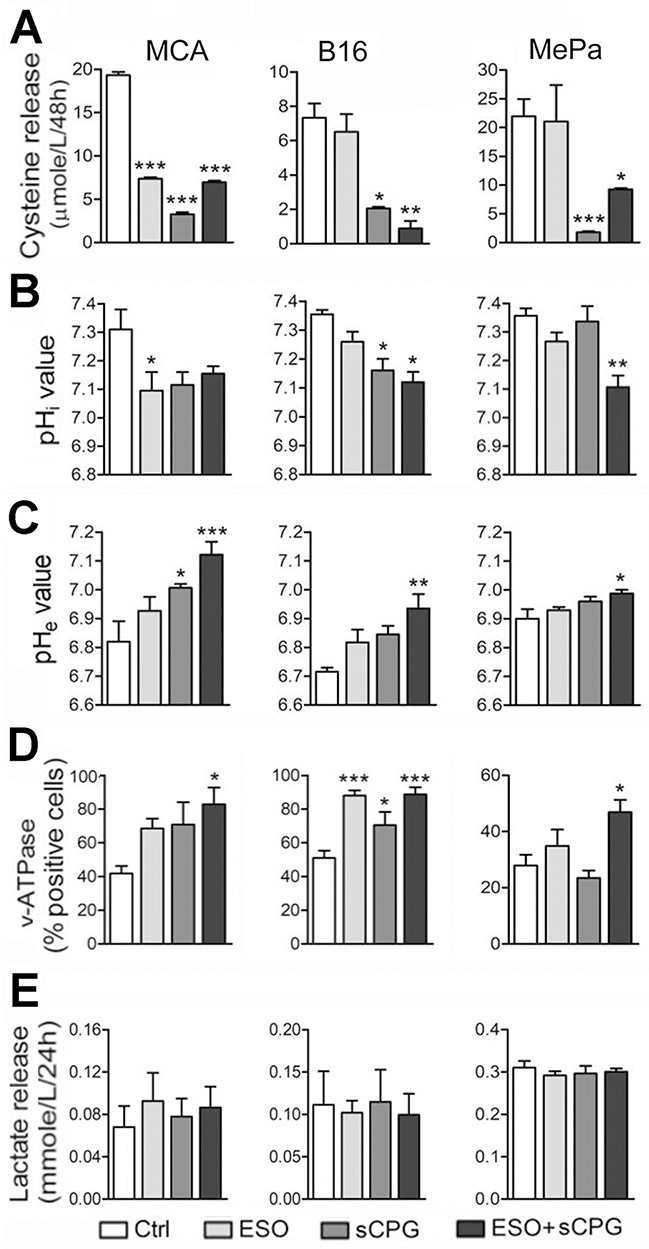
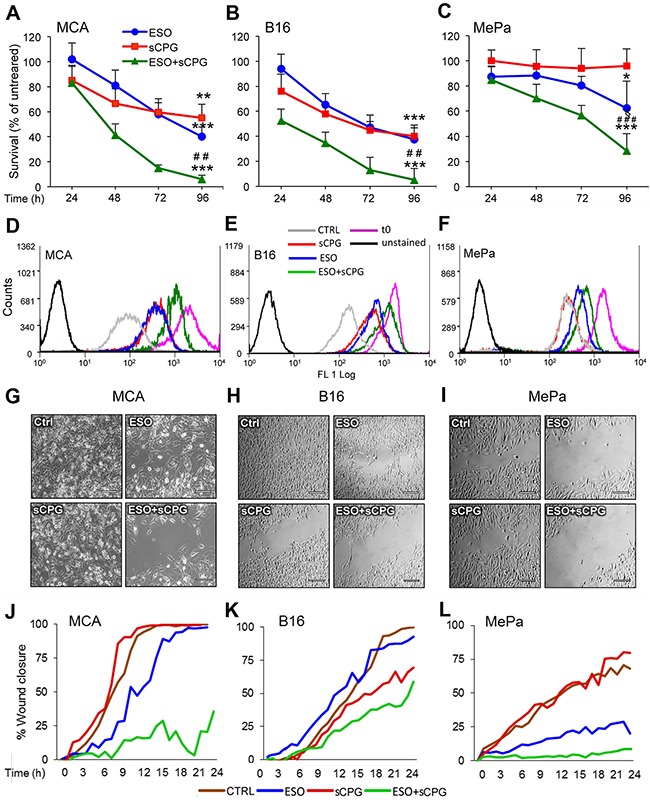
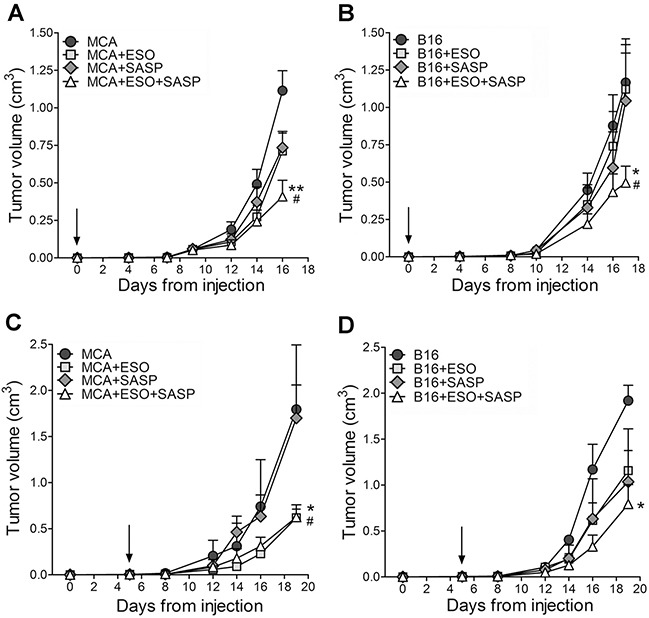
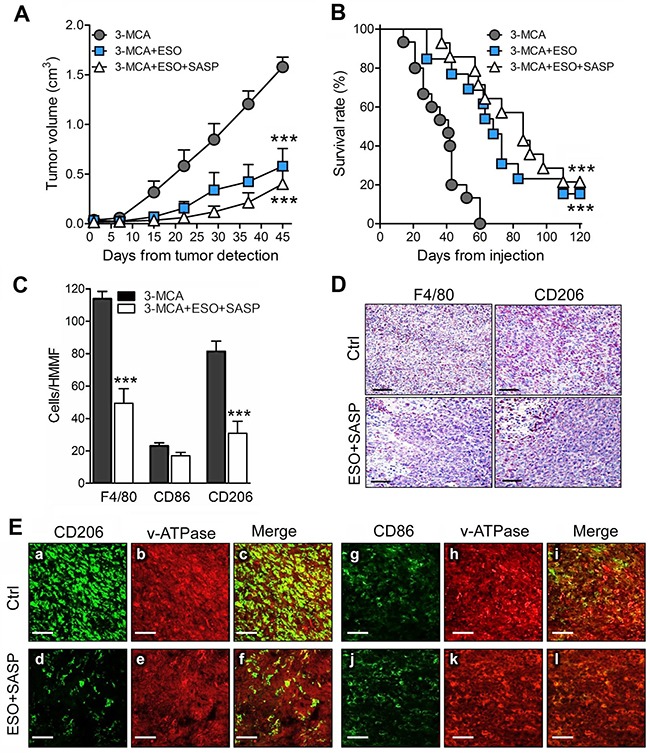
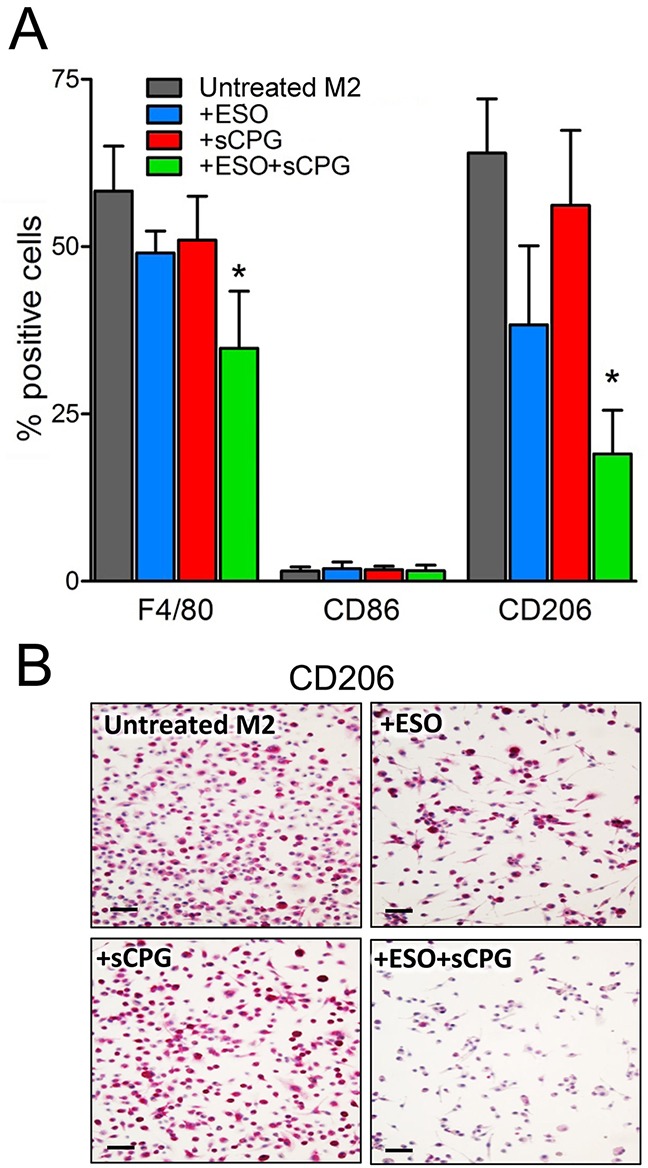
Neoplastic cells live in a stressful context and survive thanks to their ability to overcome stress. Thus, tumor cell responses to stress are potential therapeutic targets. We selected two such responses in melanoma and sarcoma cells: the xc- antioxidant system, that opposes oxidative stress, and surface v-ATPases that counteract the low pHi by extruding protons, and targeted them with the xc- blocker sulfasalazine and the proton pump inhibitor esomeprazole. Sulfasalazine inhibited the cystine/cysteine redox cycle and esomeprazole decreased pHi while increasing pHe in tumor cell lines. Although the single treatment with either drug slightly inhibited cell proliferation and motility, the association of sulfasalazine and esomeprazole powerfully decreased sarcoma and melanoma growth and migration. In the 3-methylcholanthrene (3-MCA)-induced sarcoma model, the combined therapy strongly reduced the tumor burden and increased the survival time: notably, 22 % of double-treated mice recovered and survived off therapy. Tumor-associated macrophages (TAM) displaying M2 markers, that abundantly infiltrate sarcoma and melanoma, overexpress xc- and membrane v-ATPases and were drastically decreased in tumors from mice undergone the combined therapy. Thus, the double targeting of tumor cells and macrophages by sulfasalazine and esomeprazole has a double therapeutic effect, as decreasing TAM infiltration deprives tumor cells of a crucial allied. Sulfasalazine and esomeprazole may therefore display unexpected therapeutic values, especially in case of hard-to-treat cancers.

Keywords: 3-methylcholanthrene-induced tumorigenesis; anti-oxidants; proton pump inhibitors; tumor-associated macrophages; xCT.


Conflict of interest statement

CONFLICTS OF INTEREST No potential conflicts of interest were disclosed.

Figures

Figure 1
Figure 1. Primary human tumors are more acidic and display higher levels of antioxidants than their normal counterparts
(A, B) Serial cryostat sections of frozen samples from human sarcoma (A) and melanoma (B) and normal adjacent tissues stained with anti Thioredoxin (TRX), anti xCT, anti v-ATPase or LysoSensor Green DND-189 as indicated. Quantification of the LysoSensor fluorescence levels in sarcoma (A) and melanoma (B) and normal adjacent tissues is indicated. Results are expressed as mean fluorescence intensity (MFI) obtained in 20 chosen fields ± SEM. ***P ≤ 0.001. (C), Serial cryostat sections of frozen sample from human sarcoma and melanoma stained with anti-F4/80. Scale bar, 30μm. One representative case of sarcoma and melanoma out of 5 performed is shown.
Figure 2
Figure 2. sCPG inhibits cysteine release by tumor cells and esomeprazole modulates pHi and pHe
(A-E) Data shown in left panels refer to MCA cells; in middle panels to B16 cells; in right panels to MePa cells. (A), Cysteine release by MCA, B16 and MePa cell lines, quantified after 48 h of treatment with esomeprazole (ESO), sCPG and ESO+sCPG. (B), Value of cytosolic pH (pHi) evaluated by cytofluorimetry in the three cell lines treated for 48h with the different drugs and loaded with the pH-sensitive fluorescent probe BCECF-AM. (C), Value of pHe in the three cell lines treated as in (A). (D), FACS analysis of surface expression of v-ATPases in MCA, B16 and MePa cell lines treated as in (A). (E), Lactate release detected in cell supernatants 24 h after treatment with ESO, sCPG and ESO+sCPG. Data are expressed as indicated in each panel (mean ± SEM of at least 3 experiments). Statistical significance was estimated between drug-treated and untreated cells. *P < 0.05, **P < 0.01, ***P < 0.001.
Figure 3
Figure 3. Esomeprazole plus sCPG impair tumor cell growth, proliferation and migration
(A-C), Survival rate of MCA (A), B16 (B) and MePa (C) cells treated with ESO (blue circles) and sCPG (red squares), alone or in combination (green triangles) for 24 h, 48 h, 72 h and 96 h was determined by Cristal Violet assay. Data are expressed as percent of untreated cells (mean of 3 experiments ± SEM). Significance of the differences in survival of drug-treated vs untreated cells is shown by asterisk (*P < 0.05, **P < 0.01, ***P < 0.001); significance of the differences in survival of double treated cells vs single ESO or sCPG-treated cells is shown by number sign (##P < 0.01; ###P < 0.001). (D-F), Proliferation rate of cells cultured for 72 h without (gray) or with ESO (blue), sCPG (red) or ESO+sCPG (green) was determined by CFSE assay. The profile of CSFE-loaded cells at t0 is shown in purple; the profile of unstained cells is shown in black. One representative experiment out of 3 is shown. (G-I), Migration of cells untreated (Ctrl) or pretreated 48 h with ESO and sCPG alone or in combination were analyzed in a gap filling assay (see Materials and Methods). Images show frames of a representative video, taken after 16 h 40min (MCA) or 24 h (B16 and MePa) of culture at 37°C. Scale bar corresponds to 200μm. (J-L), Results are represented as percentage of gap closure against time. One representative experiment out of 2 performed is shown.
Figure 4
Figure 4. Esomeprazole plus sulfasalazine treatment reduces tumor growth in vivo
Mice, s.c. injected with MCA (A, C) or B16 cells (B, D), were left untreated or were treated with ESO, sulfasalazine (SASP) or ESO plus SASP, 5 h after tumor cell injection (A, B, n=12 mice per each treatment group) or when the tumor became palpable (C, D n=4 mice per each treatment group). Arrows indicate the day in which treatments started. Tumor volumes of MCA (A, C) and B16 (B, D) untreated (circles) or treated with ESO (squares), SASP (diamonds) or ESO+SASP (triangles) were measured over time and results are expressed as cm3 (mean ± SEM). Statistical significance of tumor volume differences in double treated vs untreated mice is shown by asterisk (*P < 0.05, **P < 0.01). Statistical significance of tumor volume differences in double treated mice vs single treated mice (with SASP in the case of MCA tumors; with ESO or SASP in the case of B16 tumors) is shown by number sign (#P < 0.05).
Figure 5
Figure 5. The association of esomeprazole plus sulfasalazine is highly therapeutic in the 3-MCA-induced sarcoma
(A, B), Mice were injected s.c with 3-MCA and untreated or treated with ESO or ESO+SASP. For each mouse, the day on which the tumor was first detected is defined as day 0. Fifteen mice per group were treated. (A) Results of tumor volume measurement are expressed as cm3 (mean ± SEM). (B), Survival was monitored up to 120 days. (A and B): ***P ≤ 0.001 (ESO and ESO+SASP treated vs untreated mice). (C), Quantificationof F4/80+ (total TAM) CD86+ (M1) and CD206+ (M2) macrophages on serial cryostat sections of 3-MCA tumors from untreated (Ctrl) or ESO+SASP-treated mice. The results are expressed as cell number per HMMF (mean ± SEM). Twenty HMMF from 3 tumors for each group of treatment were counted. ***P ≤ 0.001. (D), One representative immunostaining (out of 5) of F4/80+ and CD206+ macrophages on serial cryostat section of 3-MCA tumors from untreated (Ctrl) or ESO+SASP-treated mice. (E), Double immunofluorescence analysis with anti-CD206 or anti-CD86 (green) and anti-v-ATPase (red), performed on cryostat sections from 3-MCA tumors obtained from untreated (Ctrl; a-c, g-i) and ESO+SASP (d-f, j-l) treated mice. Scale bar, 30μm. One representative experiments out of 3 performed is shown.
Figure 6
Figure 6. The association of esomeprazole plus sCPG reduces M2 polarized BMDM in vitro
(A), BMDM were polarized to the M2 phenotype by exposure to IL-4 for 48 h, in the absence or presence ESO, sCPG and ESO+sCPG, and then analyzed by flow cytometry for the expression of surface markers of total (F4/80+), M1 (CD86+) and M2 (CD206+) macrophages. Results are expressed as percentage of positive cells (mean ± SEM, n=4). *P < 0.05 vs untreated M2. (B), Immunohistochemical assessment of CD206 expression by M2 polarized BMDM untreated or treated with ESO, sCPG and ESO+sCPG. One representative experiments out of 3 is shown. Scale bar, 30μm.

References

    1. Cerutti PA. Prooxidant states and tumor promotion. Science. 1985;227:375–381. - PubMed
    1. Castellani P, Balza E, Rubartelli A. Inflammation, DAMPs, tumor development, and progression: a vicious circle orchestrated by redox signaling. Antioxid Redox Signal. 2014;20:1086–1097. - PubMed
    1. Ceccarelli J, Delfino L, Zappia E, Castellani P, Borghi M, Ferrini S, Tosetti F, Rubartelli A. The redox state of the lung cancer microenvironment depends on the levels of thioredoxin expressed by tumor cells and affects tumor progression and response to prooxidants. Int J Cancer. 2008;123:1770–1778. - PubMed
    1. Leinonen HM, Kansanen E, Polonen P, Heinaniemi M, Levonen AL. Dysregulation of the Keap1-Nrf2 pathway in cancer. Biochem Soc Trans. 2015;43:645–649. - PubMed
    1. Truitt ML, Conn CS, Shi Z, Pang X, Tokuyasu T, Coady AM, Seo Y, Barna M, Ruggero D. Differential requirements for eIF4E dose in normal development and cancer. Cell. 2015;162:59–71. - PMC - PubMed

LinkOut - more resources