. 2017 Oct 4;12(1):72.
doi: 10.1186/s13024-017-0215-7.

The CNS in inbred transgenic models of 4-repeat Tauopathy develops consistent tau seeding capacity yet focal and diverse patterns of protein deposition

Affiliations

The CNS in inbred transgenic models of 4-repeat Tauopathy develops consistent tau seeding capacity yet focal and diverse patterns of protein deposition

Ghazaleh Eskandari-Sedighi et al. Mol Neurodegener. .

Abstract

Background: MAPT mutations cause neurodegenerative diseases such as frontotemporal dementia but, strikingly, patients with the same mutation may have different clinical phenotypes.

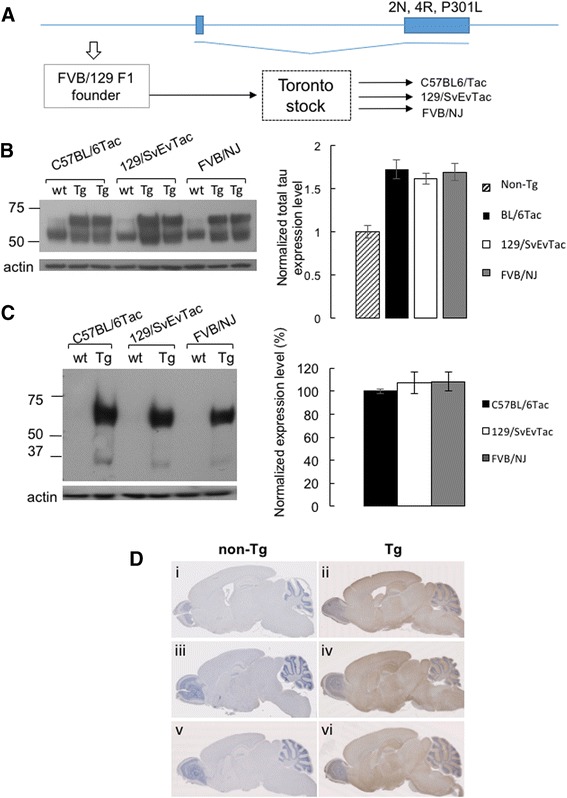
Methods: Given heterogeneities observed in a transgenic (Tg) mouse line expressing low levels of human (2 N, 4R) P301L Tau, we backcrossed founder stocks of mice to C57BL/6Tac, 129/SvEvTac and FVB/NJ inbred backgrounds to discern the role of genetic versus environmental effects on disease-related phenotypes.

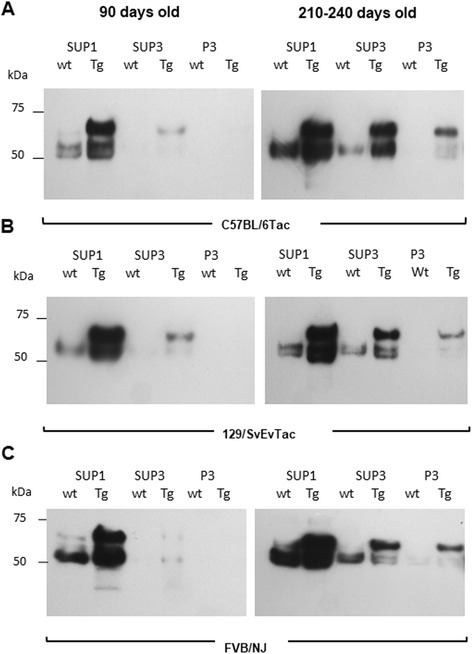
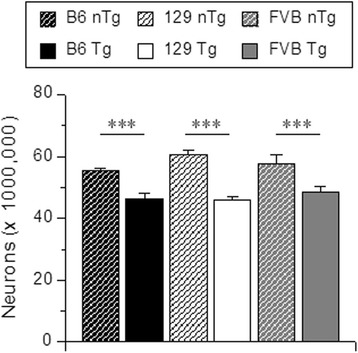
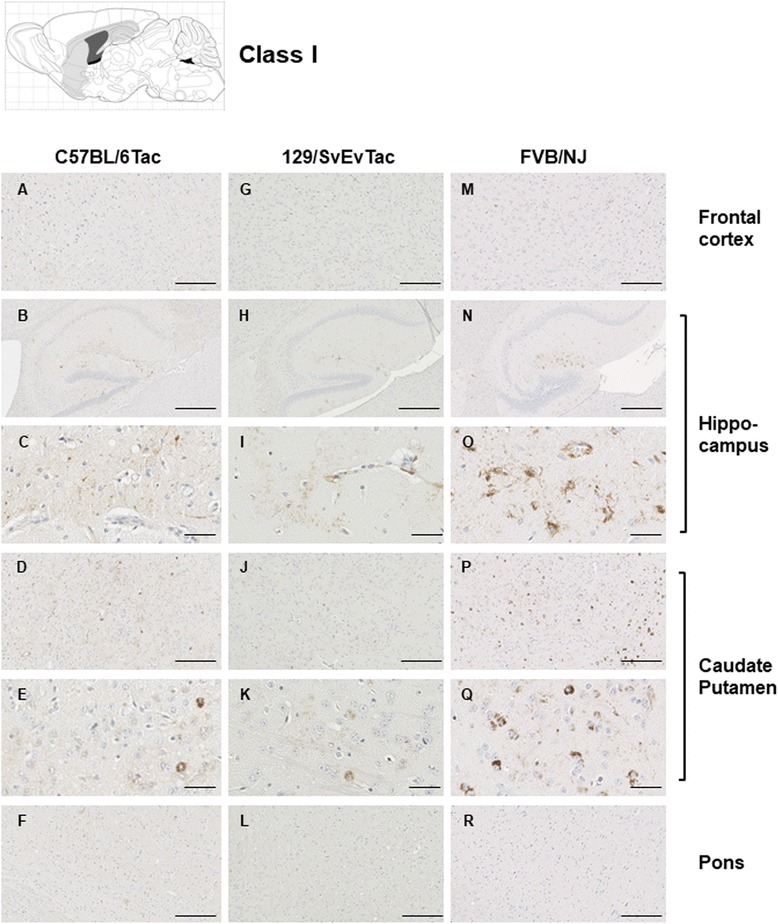
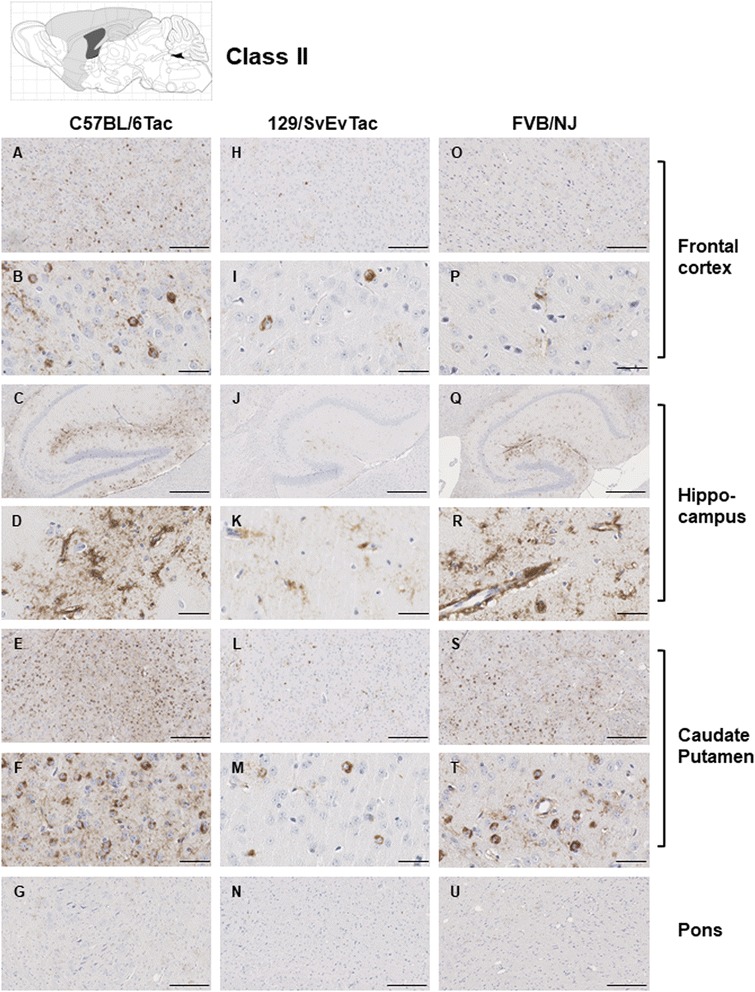
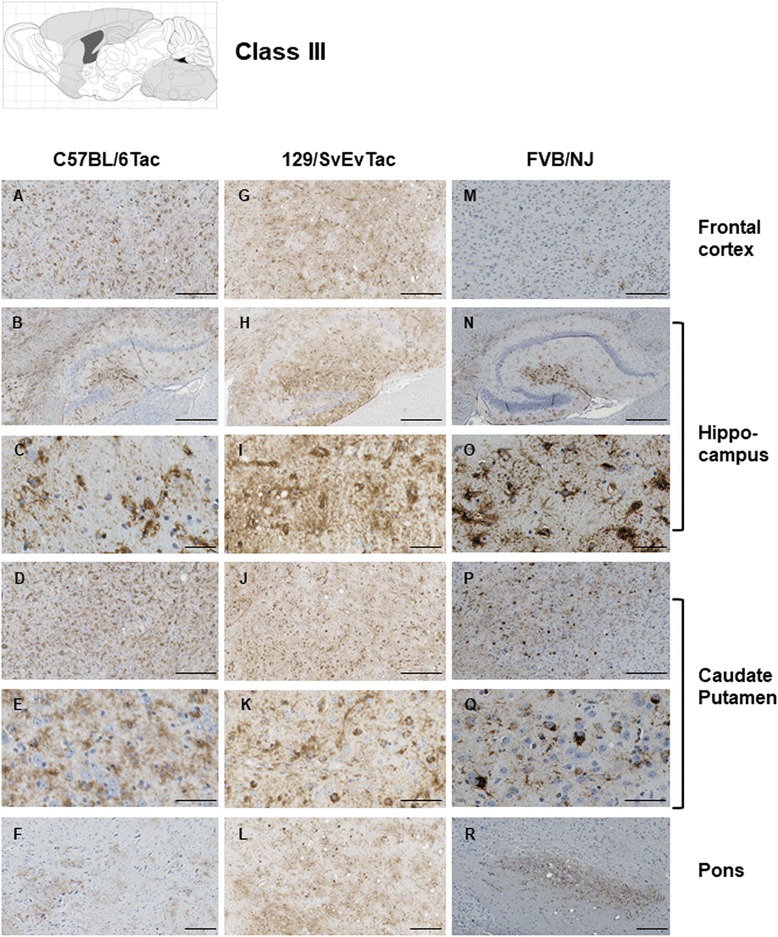
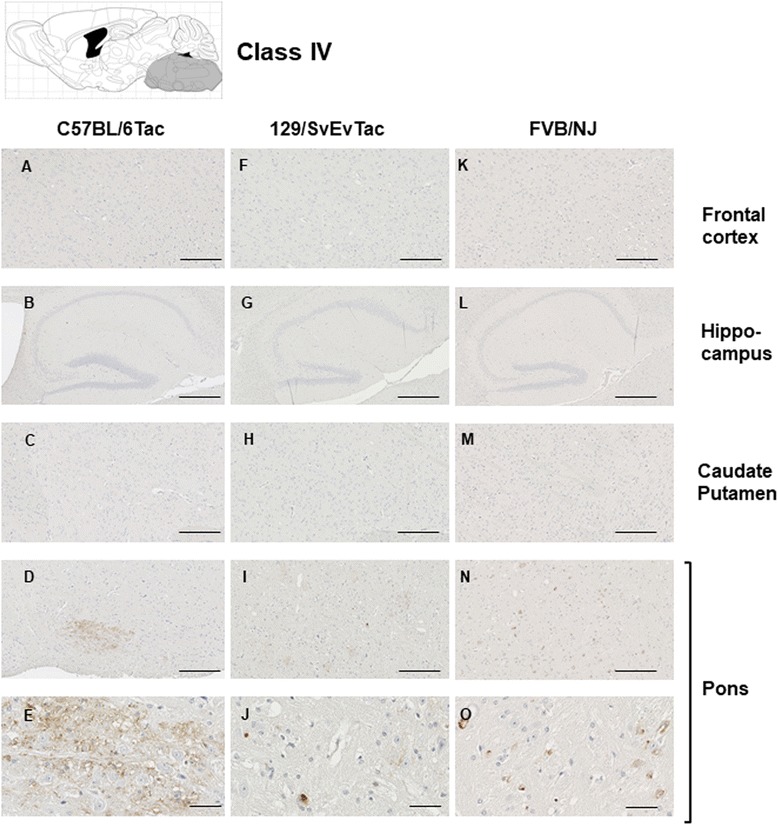
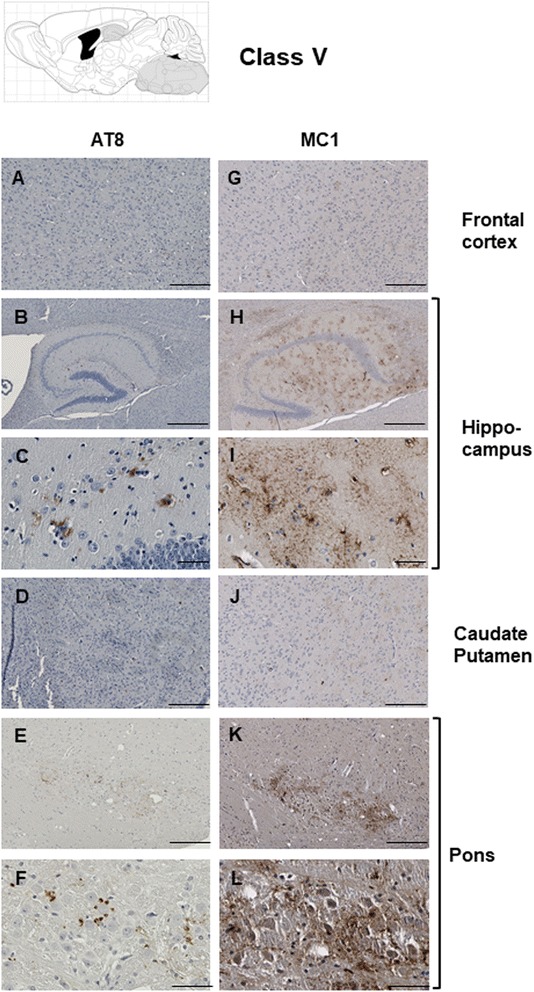
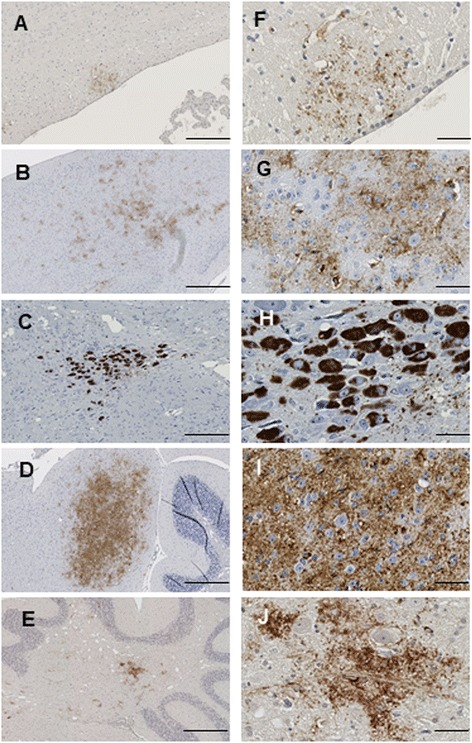
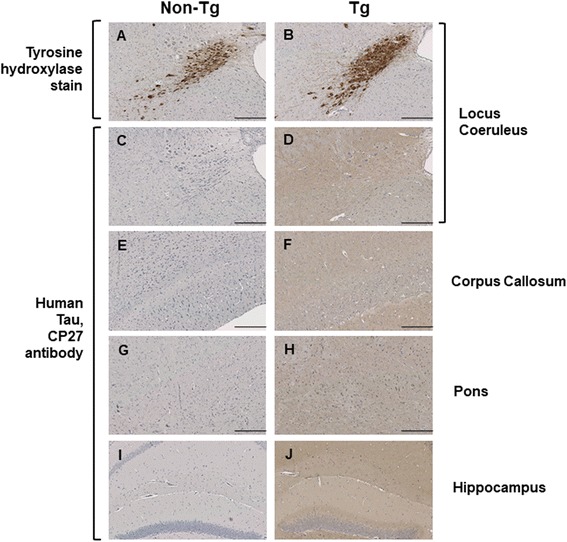
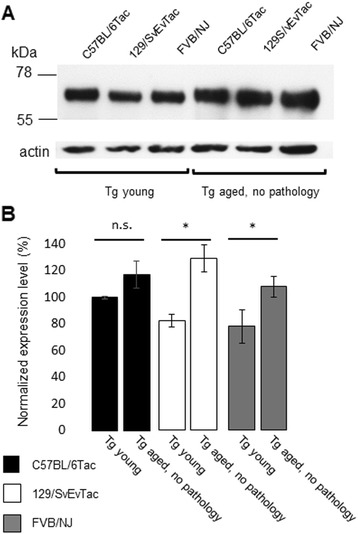
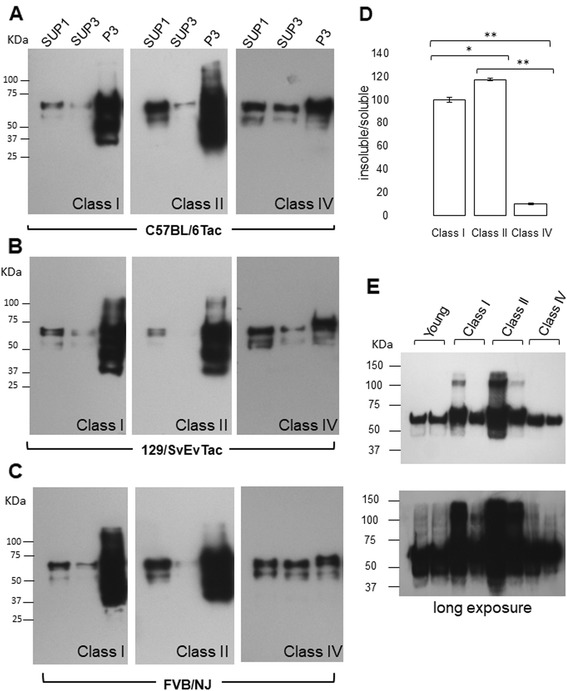
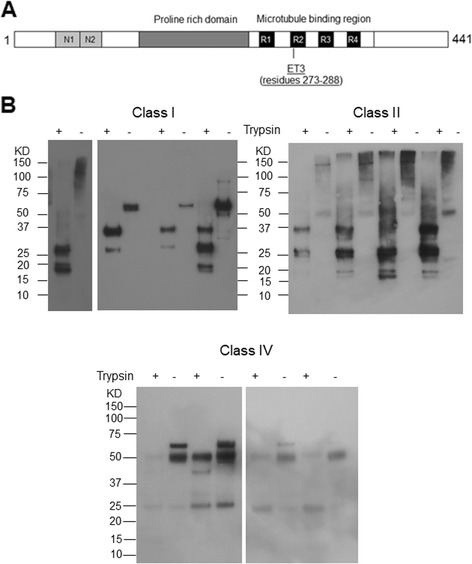
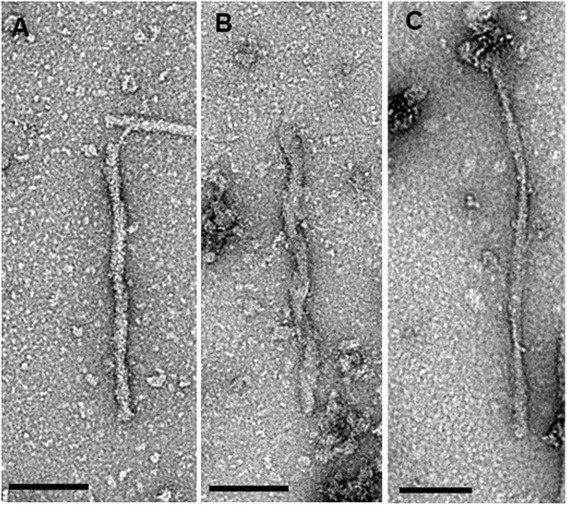
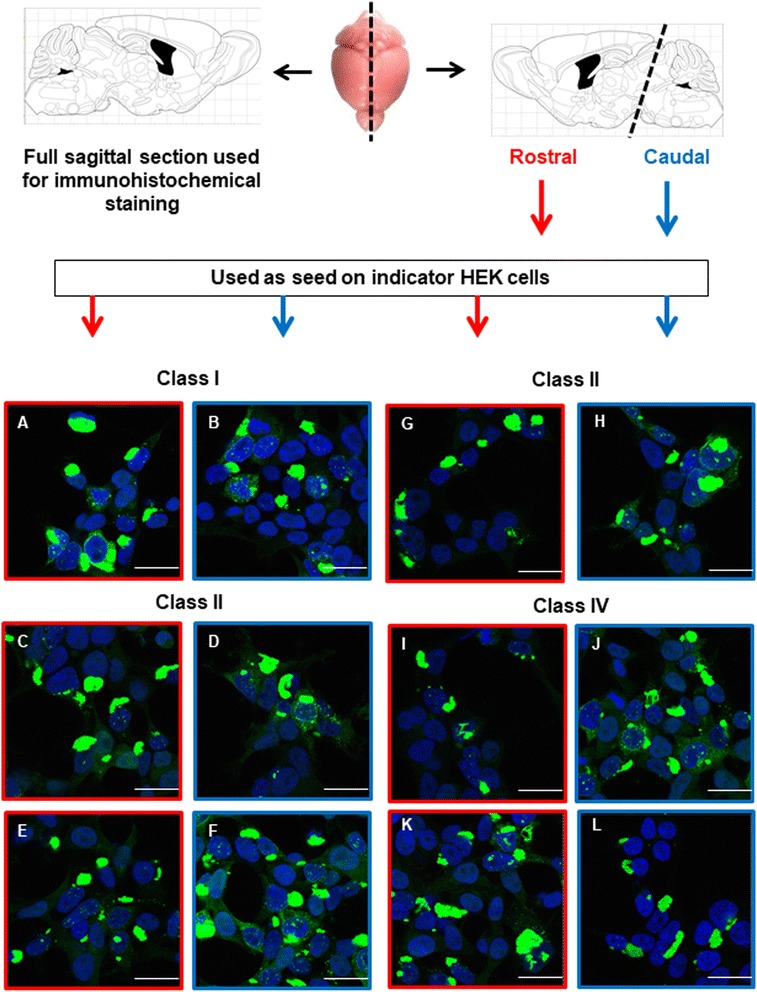
Results: Three inbred derivatives of a TgTauP301L founder line had similar quality and steady-state quantity of Tau production, accumulation of abnormally phosphorylated 64-68 kDa Tau species from 90 days of age onwards and neuronal loss in aged Tg mice. Variegation was not seen in the pattern of transgene expression and seeding properties in a fluorescence-based cellular assay indicated a single "strain" of misfolded Tau. However, in other regards, the aged Tg mice were heterogeneous; there was incomplete penetrance for Tau deposition despite maintained transgene expression in aged animals and, for animals with Tau deposits, distinctions were noted even within each subline. Three classes of rostral deposition in the cortex, hippocampus and striatum accounted for 75% of pathology-positive mice yet the mean ages of mice scored as class I, II or III were not significantly different and, hence, did not fit with a predictable progression from one class to another defined by chronological age. Two other patterns of Tau deposition designated as classes IV and V, occurred in caudal structures. Other pathology-positive Tg mice of similar age not falling within classes I-V presented with focal accumulations in additional caudal neuroanatomical areas including the locus coeruleus. Electron microscopy revealed that brains of Classes I, II and IV animals all exhibit straight filaments, but with coiled filaments and occasional twisted filaments apparent in Class I. Most strikingly, Class I, II and IV animals presented with distinct western blot signatures after trypsin digestion of sarkosyl-insoluble Tau.

Conclusions: Qualitative variations in the neuroanatomy of Tau deposition in genetically constrained slow models of primary Tauopathy establish that non-synchronous, focal events contribute to the pathogenic process. Phenotypic diversity in these models suggests a potential parallel to the phenotypic variation seen in P301L patients.

Keywords: Aging; Focal pathology; Neuronal loss; P301L mutation; Stochastic events; Transgenic mouse.


Conflict of interest statement

Ethics approval

All animal studies described herein were performed in accordance with Canadian Council on Animal Care (CCAC) guidelines, with specific protocols approved by the animal care use committee for Health Sciences Laboratory Animal Services at the University of Alberta (protocol AUP00000356).

Consent for publication

Not applicable.

Competing interests

The authors declare that they have no competing interests.

Publisher’s Note

Springer Nature remains neutral with regard to jurisdictional claims in published maps and institutional affiliations.

Figures

Fig. 1
Fig. 1
Total human Tau and total phosphorylated Tau in 3 congenic strains of TgTauP301L mice. a schematic of the cosmid transgene and derivation of a founder Tg line (open arrow). A Toronto breeding stock (T, indicated by dashed square) was used to generate three inbred derivatives. In panels b and c, brain homogenates of Tg mice from all 3 congenic strains and controls were analyzed for total Tau and total human Tau expression levels using western blot. b A representative blot showing total Tau expression in Tg mice of all congenic strains and control animals. Graph represents relative expression levels of total Tau normalized to actin loading control and then compared to control non-Tg mice n = 2 per Tg sample per inbred stain with values for non-Tg sample pooled from the three strains and assigned the value “1.0”. Antibody is DA9:1/500). TgTauP301L mice have ~1.7X Tau expression level (1.77, 1.61, 1.69 for C57BL/6Tac, 129/SvEvTac and FVB/NJ respectively) compared to controls. c A representative blot showing total human Tau expression level in Tg mice and controls. Graph represents total human Tau expression levels in transgenic mice of all 3 congenic strains (n = 3 each) normalized to C57BL/6Tac (100%; antibody CP27, 1/500). d Total human Tau distribution (CP27) in brain of Tg mice (280–324 days old) from C57BL/6Tac (ii), 129/SvEvTac (iv) and FVB/NJ (vi) backgrounds, with corresponding non-Tg animals shown in panels i, ii and iii
Fig. 2
Fig. 2
Presence of phosphorylated Tau species in fractioned brain of 90 and 240 days old mice from 3 genetic backgrounds. Half brains of TgTauP301L and non-Tg littermate controls were subjected to fractionation and presence of phosphorylated Tau species were investigated in different fractions. Inbred strains were investigated at 90 and 210–240 days of age, as indicated. a C57BL/6Tac, (b) 129/SvEvTac, and (c) FVB/NJ. For all samples, 10 μg of total protein was loaded on the gel. Antibody: CP13 (1/500; phosphoserine 202). SUP = Supernatant and P = pellet fractions
Fig. 3
Fig. 3
Quantification of neurons in whole brain of aged TgTauP301L and non-Tg littermate mice. Total number of neurons in TgTauP301L and non-transgenic mice. *** p < 0.001. n = 7 for all genotypes
Fig. 4
Fig. 4
Class I Tau pathology. Immunostaining with the phosphorylation-dependent anti-Tau antibody AT8 in the brain of TgTau mice illustrating the different patterns of deposition. Three different genetic backgrounds are represented C57BL/6 J (panels a to f); 129/SvEvTac (panels g to l) and FVB/NJ (panels m to r). Individual animals of each inbred strain presented here (and also in Figs.5-9) with the different antibody analyses shown in Figs. S2-S17 representing probing of closely adjacent sections from the same animals as Figs. 4-9. Several structures characteristic of the pattern of deposition are shown: while the frontal cortex is negative (panels a, g, m), the hippocampus (“Hpc”, panels b, c, h, i, n, o) exhibits GFT’s and occasional NFT’s, the caudate putamen (d, e, j, k, p, q) exhibits NFT’s while the Pons (panels f, l, r) is negative for immunostaining. Scale bar = 500 μm for panels b, h, and n. Scale bar = 250 μm for panels a, d, f, g, j, l, m, p, r. Scale bar = 50 μm for panels c, e, i, k, o and q
Fig. 5
Fig. 5
Class II Tau pathology. Three different genetic backgrounds have been studied with AT8 antibody as per Fig. 4. In distinction to class I there is staining in the cortex corresponding to NFT’s and GFT’s (a, h, o, b, i, p) but like class I has staining in hippocampus (panels c, j, q, d, k and r) and caudate putamen (panels e, l, s, f, m, t), with the pons being spared (g, n, u). Scale bar = 500 μm for panels c, j and q. Scale bar = 250 μm for panels a, e, g, h, l, n, o, s and u. Scale bar = 50 μm for panels b, d, f, i, k, m, p, r and t
Fig. 6
Fig. 6
Class III Tau pathology. Different genetic backgrounds and anatomical structures have been studied with AT8 antibody as per Fig. 4. The distinction from class I and II is the involvement of the pons (f, l, r). Scale bar = 500 μm for panels b, h, and n. Scale bar = 250 μm for panels a, d, f, g, j, l, m, p, and r. Scale bar = 50 μm for panels c, e, i, k, o, and q
Fig. 7
Fig. 7
Class IV Tau pathology. Different genetic backgrounds and anatomical structures have been studied with AT8 antibody as per Fig. 4. In contrast to classes I-III, immunostaining is restricted to the pons (d, e, i, j, n, o). Scale bar = 500 μm for panels b, g, and l. Scale bar = 250 μm for panels a, c, d, f, h, i, k, m, and n. Scale bar = 50 μm for panels e, j, and o. Cells presented in panel j exhibit vacuoles
Fig. 8
Fig. 8
Class V Tau pathology. Class V comprised the rarest class of pathology. Three out of four occurrences were in the 129/SvEvTac background and a single mouse from this background is represented with AT8 or MC1 staining. In contrast to class IV, immunostaining encompasses the hippocampus (b, c, h, i). Scale bar = 500 μm for panels b, and h. Scale bar = 250 μm for panels a, d, e, g, j, and k. Scale bar = 50 μm for panels c, f, i, and l.
Fig. 9
Fig. 9
Focal staining in aged TgTauP301L mice. Representative images of focal immunostaining of sagittal brain sections analysed with AT8 antibody. Corpus callosum (panels a, f), retrosplenial areas (panels b, g), Locus coeruleus (panels c, h), inferior colliculus (panels d, i) and cerebellar fiber tracts (panels e, j) are presented. Scale bar = 250 μm for panels a, b, c, d, and e. Scale bar = 50 μm for panels f, g, h, i and j
Fig. 10
Fig. 10
Transgene-encoded human Tau is not expressed in a focal pattern in areas subject to focal staining in aged mice. Neuroanatomical areas prone to focal deposition in aged Tg mice were assessed before the onset of AT8-positive immunostaining. (a, c, e, g, i) non-Tg and (b, d, f, h, j) TgTauP301L mice (C57BL6/Tac background, ages 355 and 309 d, respectively) stained for tyrosine hydroxylase antibody in the locus coeruleus. The remaining panels indicate sections from different brain areas from non-Tg mice and Tg mice stained with using CP27 antibody, with Tg mice not exhibiting focal patterns of staining. c, d: locus coeruleus; e, f: corpus callosum; g, h: Pons; i, j: Hippocampus. All scale bars = 250 μm
Fig. 11
Fig. 11
Presence of Tau protein in aged Tg animals with negative pathology. a Matching hemibrains of aged animals found lacking AT8 immunostaining (lanes 4–6, ages 723, 608, and 604 d respectively) were processed for western blot analysis and probed with antibody alongside young Tg mice (lanes 1–3, 66, 84 and 58d, respectively). Actin re-probe (lower panel) indicates similar sample loadings. b represents densitometric analyses of the blot data expressed normalized to actin and adjusted to C57BL/6Tac (“100%”). Aged pathology-negative Tg mice had more, rather than less, Tau than their young counterparts from the same inbred strain background, this reaching significance for the 129/SvEvTac and FVB/NJ backgrounds
Fig. 12
Fig. 12
Insoluble Tau species in the brains of aged TgTauP301L mice. Fractionated brains comprising supernatant pellet 1 (SUP1), supernatant pellet 3 (SUP3), and pellet 3 (P3) of aged TgTau(P301L) mice were analyzed by western blot analysis. One example of Class I, II and IV is shown for each genetic background. a C57BL/6Tac mice at ages 587, 732, and 530 days left to right (b), 129/SvEvTac at ages 662, 592, and 466 days left to right, and (c) FVB/NJ mice at ages 646, 658, and 639 days left to right. For all samples, 10 μg of total protein was loaded on the gel. Antibody: CP13 (1/500; phosphoserine 202). SUP = Supernatant, and P = pellet fractions. d P3/S3 ratios of animals presented in A-C. Ratios were pooled across strain backgrounds. Class I vs. II p = 0.020; I vs IV, p = 0.08; II vs, IV, p = 0.003. e S1P fraction of animals with classes I, II and IV pathology to show the presence of oligomeric species in the soluble extract, antibody: CP27 (1/500)
Fig. 13
Fig. 13
Trypsin-resistance of sarkosyl-insoluble Tau fractions. a A schematic of antibody epitope is presented. b 10 μg of P3 fractions from animals of classes I, II and 15 μg of P3 for animals of IV were subjected to trypsin digestion (1/100 for enzyme/protein ratio) and analyzed by western blotting. The banding patterns in samples are represented before and after trypsin-digestion. The samples are organized by age in an increasing order. Animals from class I, left to right C57BL/6 J, FVB/NJ, two C57BL/6 J and FVB/NJ. Animals from class II, left to right C57BL/6 J, two 129/SvEvTac, FVB/NJ and C57BL/6 J and 129SvEv/Tac and two FVB/NJ and C57BL/6 J animals from class IV. The exposure time for different paired samples electrophoresed and transferred from the same gel was adjusted to obtain similar signal intensities for the predominant immunoreactive species. ET3 anti-Tau (4R specific, residues 273–288) was used to detect Tau fragments at 1/250 dilution
Fig. 14
Fig. 14
Negative stain electron microscopy of insoluble Tau fractions. The morphology of individual Tau filaments was readily discernible and three separate filament types were observed: straight filaments (a), coiled filaments (b), and twisted ribbon-like filaments (c). Scale bars = 100 nm
Fig. 15
Fig. 15
Assessment of Tau strains in a cell-based seeding assay. Upper panel: Mouse brains have been cut saggitaly with the right hemispheres fixed in formalin for further processing and embedding in paraffin and for use in immunohistochemistry. Left hemispheres were cut transversally according to the diagram (dashed line). Each rostral or caudal portion was then homogenized and used as a seed on cell cultures as described. Lower panels represent the fluorescent micrographs obtained from seeding assays with rostral (red border) or caudally-derived (blue border) derived homogenates. When transduced into Clone 1 cells, which express Tau RD-YFP but lack aggregates, all homogenates seed morphologically indistinguishable Tau inclusions, which feature tangles of filamentous Tau (panels a-l). These inclusions are morphologically distinct from those seeded by Clone 9 (nuclear speckles) and Clone 10 (ordered inclusion) lysates (see Additional file 10: Figure S21)

Similar articles

Cited by

References

    1. Foster NL, Wilhelmsen K, Sima AA, Jones MZ, D'Amato CJ, Gilman S. Frontotemporal dementia and parkinsonism linked to chromosome 17: a consensus conference. Conference Participants. Ann Neurol 1997;41(6):706–715. - PubMed
    1. Hutton M, Lendon CL, Rizzu P, Baker M, Froelich S, Houlden H, Pickering-Brown S, Chakraverty S, Isaacs A, Grover A, et al. Association of missense and 5′-splice-site mutations in tau with the inherited dementia FTDP-17. Nature. 1998;393(6686):702–705. doi: 10.1038/31508. - DOI - PubMed
    1. Spillantini MG, Murrell JR, Goedert M, Farlow MR, Klug A, Ghetti B. Mutation in the tau gene in familial multiple system tauopathy with presenile dementia. Proc Natl Acad Sci U S A. 1998;95(13):7737–7741. doi: 10.1073/pnas.95.13.7737. - DOI - PMC - PubMed
    1. Lewis J, McGowan E, Rockwood J, Melrose H, Nacharaju P, Van Slegtenhorst M, Gwinn-Hardy K, Paul Murphy M, Baker M, Yu X, et al. Neurofibrillary tangles, amyotrophy and progressive motor disturbance in mice expressing mutant (P301L) tau protein. Nat Genet. 2000;25(4):402–405. doi: 10.1038/78078. - DOI - PubMed
    1. Götz J, Chen F, Barmettler R, Nitsch RM. Tau filament formation in transgenic mice expressing P301L tau. J Biol Chem. 2001;276(1):529–534. doi: 10.1074/jbc.M006531200. - DOI - PubMed

LinkOut - more resources