. 2017 Oct 3;26(4):633-647.e7.
doi: 10.1016/j.cmet.2017.09.009.

MYC and MCL1 Cooperatively Promote Chemotherapy-Resistant Breast Cancer Stem Cells via Regulation of Mitochondrial Oxidative Phosphorylation

Affiliations

MYC and MCL1 Cooperatively Promote Chemotherapy-Resistant Breast Cancer Stem Cells via Regulation of Mitochondrial Oxidative Phosphorylation

Kyung-Min Lee et al. Cell Metab. .

Abstract

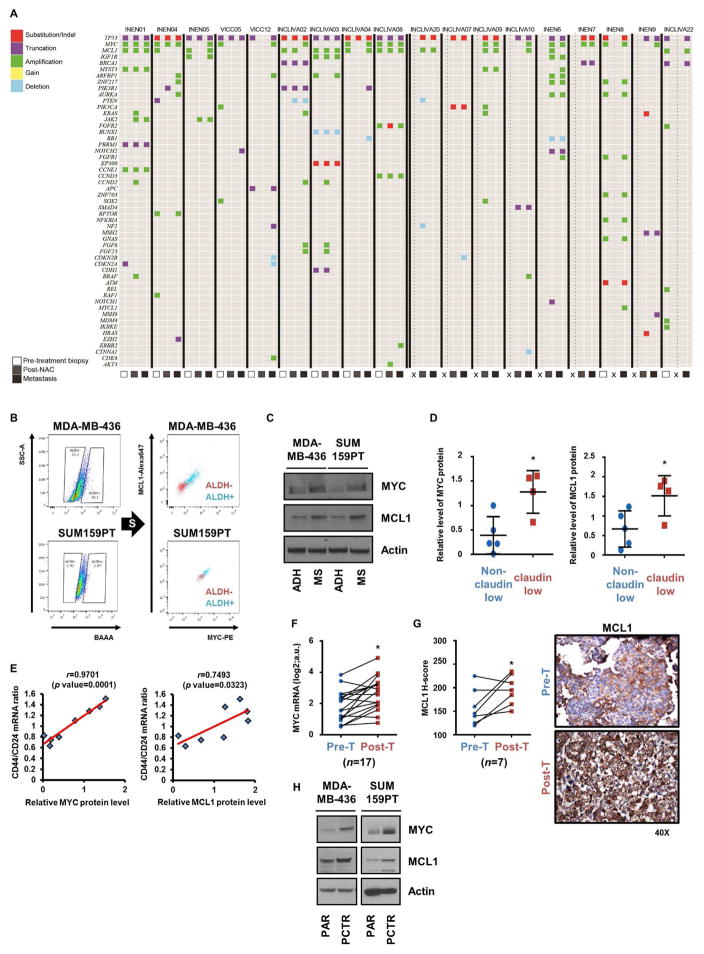
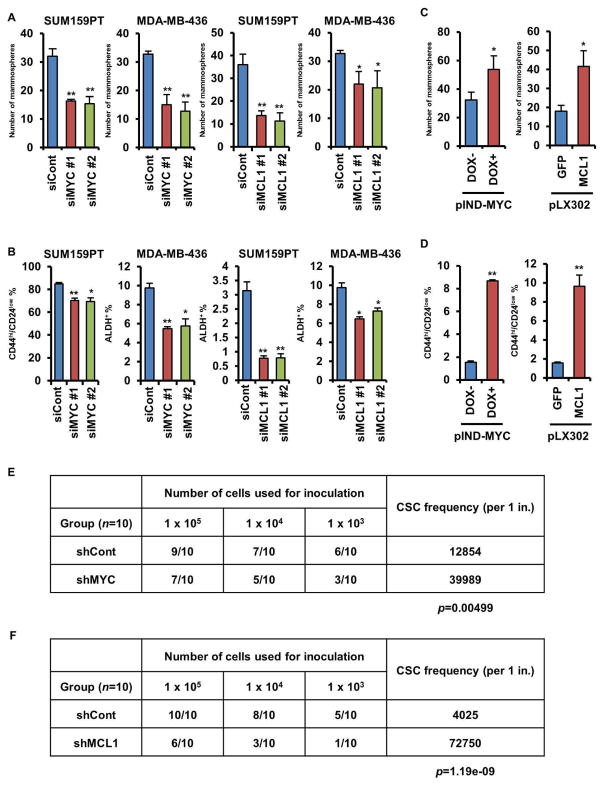
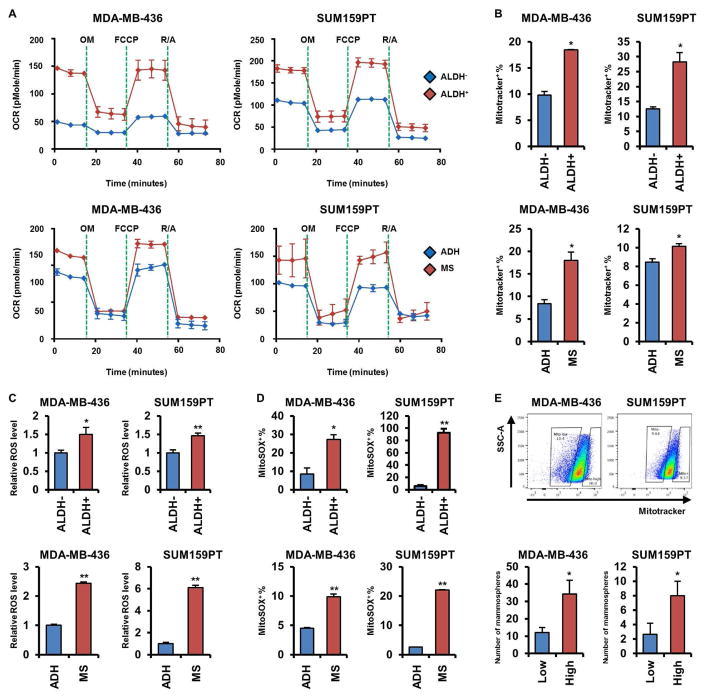
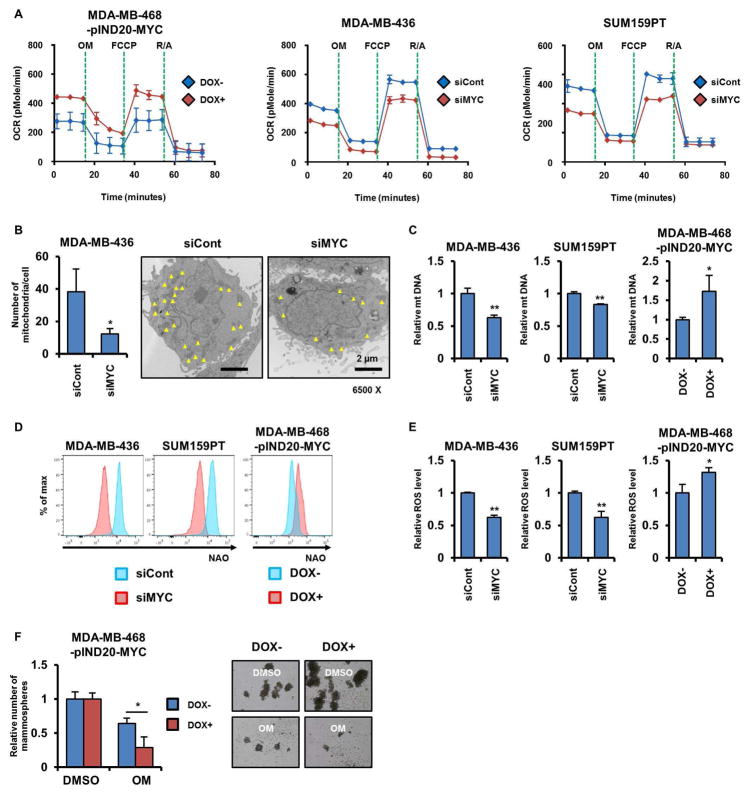
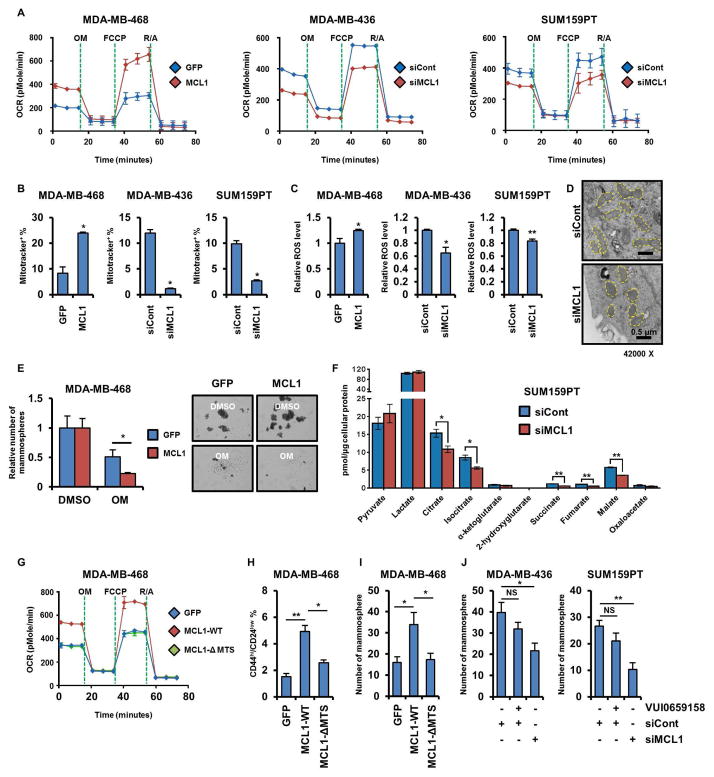
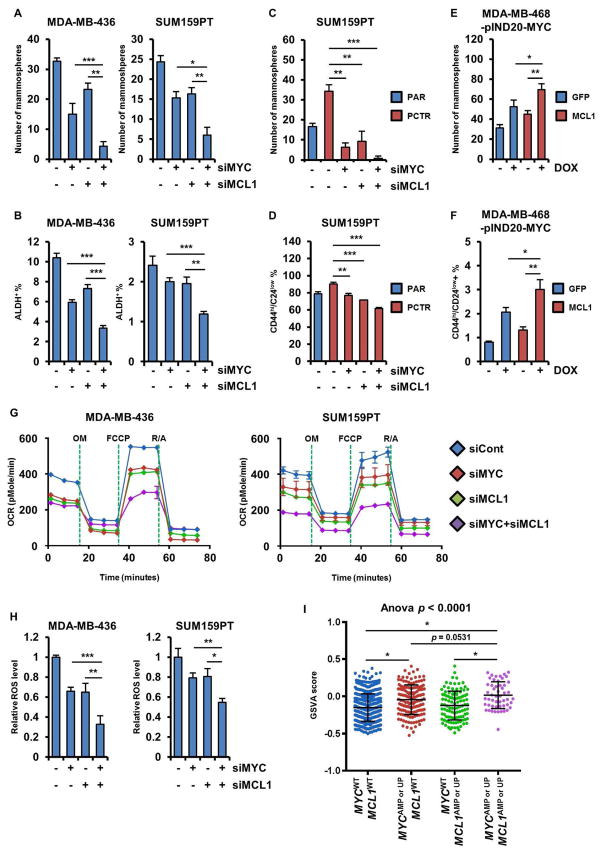
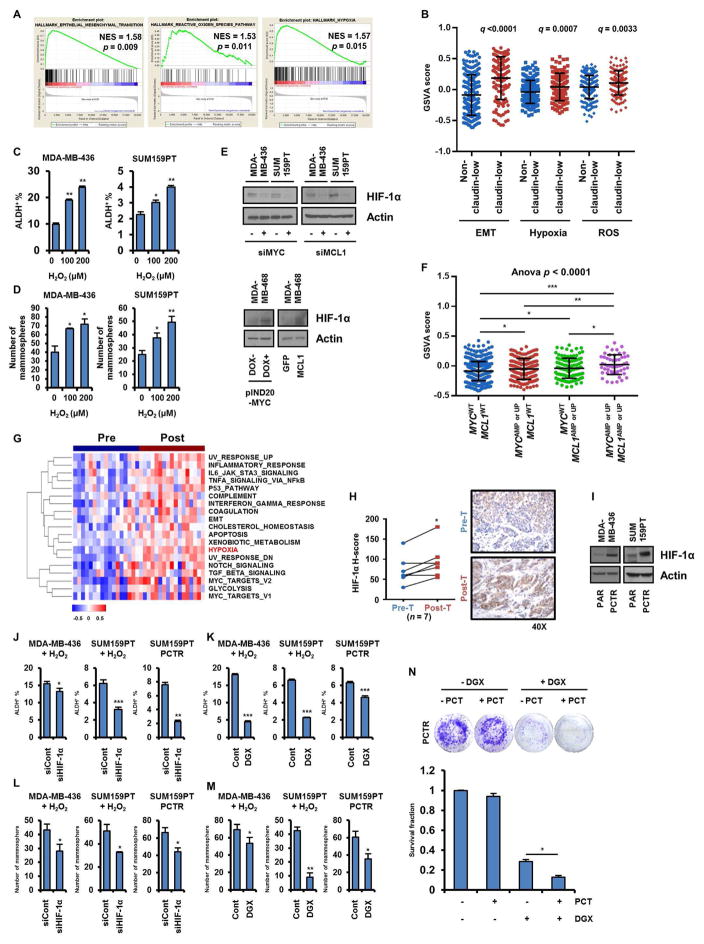
Most patients with advanced triple-negative breast cancer (TNBC) develop drug resistance. MYC and MCL1 are frequently co-amplified in drug-resistant TNBC after neoadjuvant chemotherapy. Herein, we demonstrate that MYC and MCL1 cooperate in the maintenance of chemotherapy-resistant cancer stem cells (CSCs) in TNBC. MYC and MCL1 increased mitochondrial oxidative phosphorylation (mtOXPHOS) and the generation of reactive oxygen species (ROS), processes involved in maintenance of CSCs. A mutant of MCL1 that cannot localize in mitochondria reduced mtOXPHOS, ROS levels, and drug-resistant CSCs without affecting the anti-apoptotic function of MCL1. Increased levels of ROS, a by-product of activated mtOXPHOS, led to the accumulation of HIF-1α. Pharmacological inhibition of HIF-1α attenuated CSC enrichment and tumor initiation in vivo. These data suggest that (1) MYC and MCL1 confer resistance to chemotherapy by expanding CSCs via mtOXPHOS and (2) targeting mitochondrial respiration and HIF-1α may reverse chemotherapy resistance in TNBC.

Keywords: MCL1; MYC; cancer stem cell; chemotherapy resistance; mitochondrial respiration; triple negative breast cancer.


Figures

Figure 1
Figure 1. MYC and MCL1 are amplified in post-NAC TNBC tumors and overexpressed in CSCs
(A) Plot of genetic alterations as determined by targeted NGS in tumor DNA. X represents no biopsy was available. (B) ALDH+ cells were sorted and then subjected to intracellular labeling with MYC and MCL1 antibodies. (C) Cells were cultured in adherent conditions (ADH) or as mammospheres (MS) for 7 days. Cell lysates were subjected to immunoblot analysis with the indicated antibodies. (D) Relative levels of MYC and MCL1 protein in lysates from TNBC cell lines and quantified by Image J (*p<0.05). (E) MYC and MCL1 protein levels were plotted against the ratio of CD44:CD24 mRNA in the TNBC cell lines (Pearson’s correlation). (F) Levels of MYC mRNA in breast cancer biopsies before chemotherapy (Pre-T) and after chemotherapy (Post-T) were measured by NanoString analysis (n=17; paired t test, *p<0.005). (G) Left panel: H score of IHC analysis of MCL1 from tumor biopsies before chemotherapy and after chemotherapy (n=7; paired t test, *p<0.05). Right panel: Representative MCL1 IHC. (H) MYC, MCL1 and actin immunoblot analyses of lysates from paclitaxel resistant (PCTR) and parental (PAR) cells. Data are represented as mean ± SD.
Figure 2
Figure 2. MYC and MCL1 increase mammosphere formation and enrich for CSCs
(A, C) SUM159PT and MDA-MB-436 cells were transfected with two different MYC or MCL1 siRNAs (A). MDA-MB-468 cells stably transduced with pINDUCER20-MYC (expression induced by 100 ng/mL DOX) or pLX302-GPF or -MCL1 were subjected to mammosphere assay (C). The indicated cells were seeded in mammosphere assays for 7 days (* p<0.05, **p<0.005); original magnification, x100. (B, D) ALDH+ or CD44hi/CD24low fractions in cells manipulated as in A and C were analyzed by FACS (*p<0.005, **p<0.0005). (E, F) SUM159PT cells stably transduced with MYC or MCL1 shRNA were serially diluted and then injected subcutaneously (s.c.) in the lateral dorsum of athymic female mice for ELDA. Data are represented as mean ± SD.
Figure 3
Figure 3. Breast CSCs exhibit an enhanced mitochondrial respiratory phenotype
(A) OCRs were determined in cells sorted by ALDH activity (upper panel) or grown as mammospheres or in adherent condition (lower panel). (B) MDA-MB-436 and SUM159PT cells sorted or grown as in A were stained with Mitotracekr Red CMXRos and then analyzed by flow cytometry (*p<0.005). (C) ROS levels were determined by ROS-Glo as described in Experimental Procedures (*p<0.05, **p<0.005). (D) Cells were stained with MitoSOX Red and analyzed by flow cytometry (*p<0.005, **p<0.0005). (E) Cells were sorted by flow cytometry upon intensity of Mitotracker Red CMXRos (upper) and then seeded in mammosphere assays for 7 days (* p<0.05). Data are represented as mean ± SD.
Figure 4
Figure 4. MYC drives CSC enrichment via mitochondrial biogenesis
(A) OCRs were determined by Seahorse XFe96 extracellular flux analyzer. (B) Number of mitochondria in cells transduced with MYC siRNA was measured as described in Experimental Procedures (*p<0.05). The yellow arrows point to each mitochondrion. (C) Levels of mitochondrial DNA were measured by real time quantitative PCR using the Human Mitochondrial DNA Monitoring Primer Set (*p<0.05, **p<0.005). (D) Fluorescent intensity of cells stained with NAO was determined by flow cytometry. (E) ROS levels were determined by ROS-Glo (*p<0.05, **p<0.005). (F) Cells transduced with pINDUCER20-MYC were seeded in mammosphere assays and treated with DMSO or 0.1 μM oligomycin A ± 100 ng/mL DOX for 7 days (*p<0.05). Data are represented as mean ± SD.
Figure 5
Figure 5. MCL1-induced increase in CSCs is mediated by mtOXPHOS
(A–C) OCRs were determined by Seahorse XFe96 extracellular flux analyzer (A). Cells were stained with Mitotracker Red CMXRos and then were analyzed by flow cytometry (B; *p<0.0005) ROS levels were determined by ROS-Glo (C; *p<0.05, **p<0.005). (D) Cells were transduced with MCL1 siRNA and then prepared for transmission electron microscope imaging. Yellow dots outline each individual mitochondrion. (E) Cells transduced with MCL1 were seeded in mammosphere assays and treated with DMSO or 0.1 μM oligomycin A for 7 days (*p<0.05). (F) Cells were transduced with MCL1 siRNA and then lysed and subjected to LC-MS/MS. TCA cycle metabolites were analyzed as described in Methods (Multiple t-tests, *q<0.05, **q<0.0005). (G–I) OCRs and the proportion of CD44hi/CD24low cells were determined by Seahorse XFe96 extracellular flux analyzer (G) and flow cytometry (H), respectively (*p<0.005, **p<0.0005). Cells were seeded in mammosphere assays for 7 days (I; *p<0.05). (J) Cells were transduced with MCL1 siRNA or treated with VU0659158 for 4 days and then seeded in mammosphere assays for 7 days (*p<0.05, ** p <0.005). Data are represented as mean ± SD.
Figure 6
Figure 6. MYC and MCL1 cooperate to expand CSCs
(A, C) Cells were transduced with MYC and/or MCL1. After 4 days, cells were seeded in mammosphere assays for 7 days (*p<0.05, **p<0.005, ***p<0.0005). (B, D) Proportion of ALDH+ or CD44hi/CD24low cells was determined by flow cytometry (*p<0.05, **p<0.005, ***p<0.0005). (E, F) MDA-MB-468 cells transduced with pLX302-GFP or -MCL1 were re-transduced with pINDUCER20-MYC. Cells were then seeded in a mammosphere assay for 7 days ± 100 ng/mL DOX (E). Proportion of CD44hi/CD24low cells was determined by flow cytometry after 4 days of treatment with DOX (F). (G) OCRs were determined by Seahorse XFe96 extracellular flux analyzer. (H) ROS levels were examined by ROS-Glo (*p<0.05, **p<0.005, ***p<0.0005). (I) GSVA score was examined with a gene set [Reactome_Pyruvate metabolism and Citric Acid (TCA) cycle] in breast cancers in TCGA (*p<0.0005). Data are represented as mean ± SD.
Figure 7
Figure 7. Enrichment of CSCs driven by MYC and MCL1 is mediated by ROS-induced HIF-1α stabilization
(A) mRNA expression data of TNBC cell lines (n=20) in the CCLE was analyzed using GSEA. Plots indicate hallmark gene sets enriched in claudin-low TNBC cell lines. (B) TNBCs in the METABRIC database (n=320) were divided as claudin-low and non-claudin low based on PAM50 analysis. GSVA scores were plotted accordingly. (C, D) Cells treated with H2O2 for 4 days were subjected to ALDH assay (C, *p<0.005, **p<0.0005) or seeded in mammosphere assays for 7 days (D, *p<0.05, **p<0.005). (E, I) Lysates were subjected to immunoblot analysis with HIF-1α and actin antibodies. (F) GSVA scores were generated with a gene set (Hallmark_Hypoxia) in TCGA breast tumors (*p<0.05, **p<0.005, ***p<0.0005). (G) Hallmark gene sets enriched in TNBCs after chemotherapy were determined using GSVA. Heatmap shows significantly enriched gene sets (q<0.05). (H) IHC analysis of HIF-1α in FFPE sections from TNBC biopsies before and after chemotherapy (n = 7; paired t tests, *p<0.05). (J, K) Cells were transduced with HIF1A siRNA (J, left and middle panels) or treated with 50 nM digoxin (K, left and middle panels) in presence of 200 μM H2O2 for 4 days. Cells were then subjected to ALDH assay (*p<0.05, **p<0.005, ***p<0.0005). (L, M) Cells manipulated as in J and K were seeded in mammosphere assays for 7 days (*p<0.05, **p<0.0005). (N) PCTR SUM159PT cells were treated with 50 nM paclitaxel ± 100 nM digoxin for 10 days (*p<0.0005). Data are represented as mean ± SD.

References

    1. Akgul C. Mcl-1 is a potential therapeutic target in multiple types of cancer. Cell Mol Life Sci. 2009;66:1326–1336. - PMC - PubMed
    1. Akita H, Marquardt JU, Durkin ME, Kitade M, Seo D, Conner EA, Andersen JB, Factor VM, Thorgeirsson SS. MYC activates stem-like cell potential in hepatocarcinoma by a p53-dependent mechanism. Cancer research. 2014;74:5903–5913. - PMC - PubMed
    1. Al-Hajj M, Wicha MS, Benito-Hernandez A, Morrison SJ, Clarke MF. Prospective identification of tumorigenic breast cancer cells. Proc Natl Acad Sci U S A. 2003;100:3983–3988. - PMC - PubMed
    1. Alirol E, Martinou JC. Mitochondria and cancer: is there a morphological connection? Oncogene. 2006;25:4706–4716. - PubMed
    1. Balko JM, Giltnane JM, Wang K, Schwarz LJ, Young CD, Cook RS, Owens P, Sanders ME, Kuba MG, Sanchez V, et al. Molecular profiling of the residual disease of triple-negative breast cancers after neoadjuvant chemotherapy identifies actionable therapeutic targets. Cancer Discov. 2014;4:232–245. - PMC - PubMed

MeSH terms

Substances