

Braun's Lipoprotein Facilitates OmpA Interaction with the Escherichia coli Cell Wall
- PMID: 28978443
- PMCID: PMC5627309
- DOI: 10.1016/j.bpj.2017.08.011
Braun's Lipoprotein Facilitates OmpA Interaction with the Escherichia coli Cell Wall
Abstract
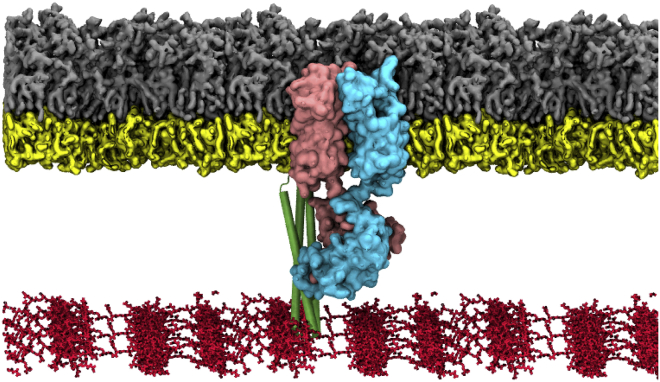
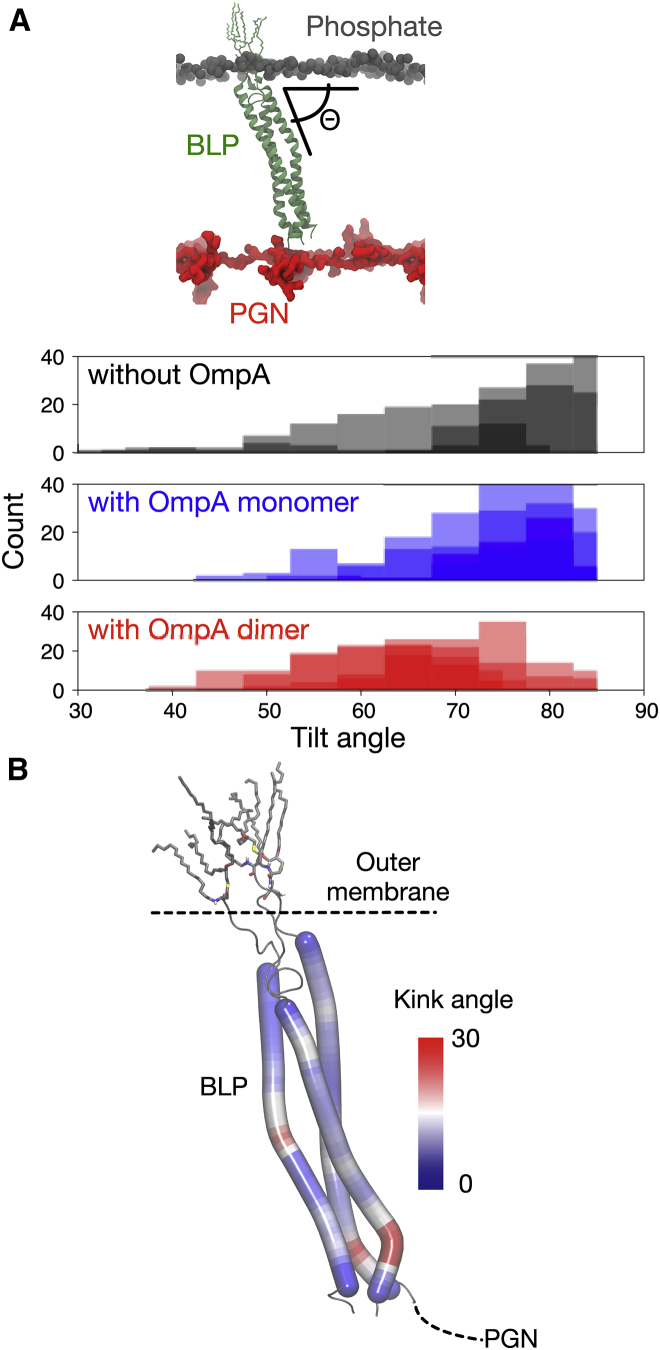
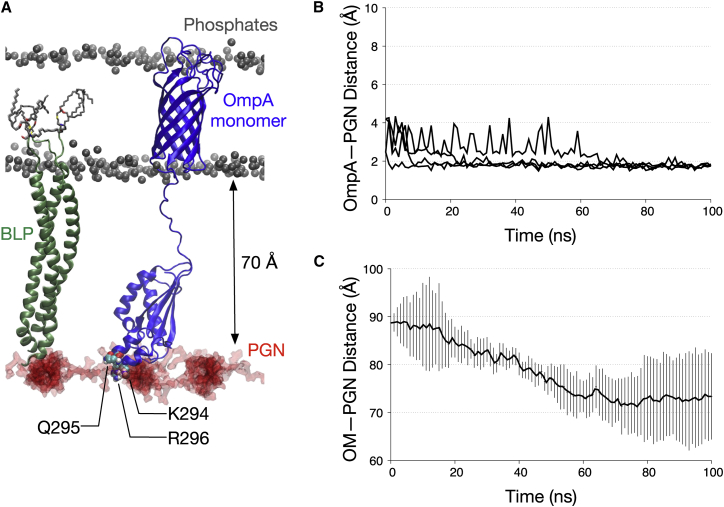
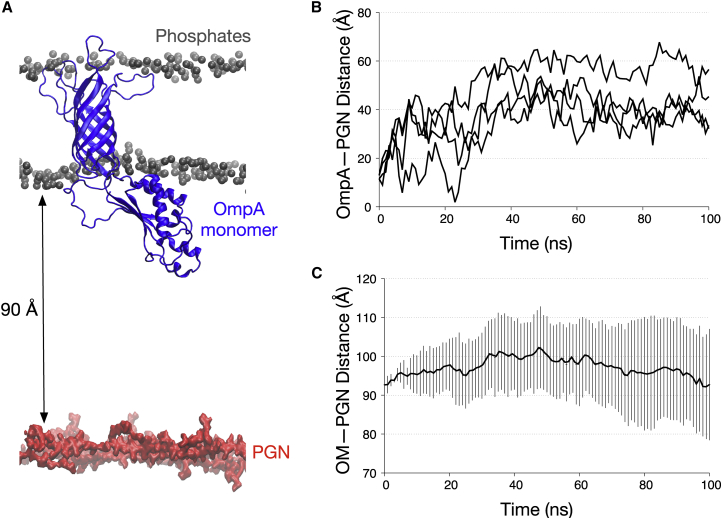
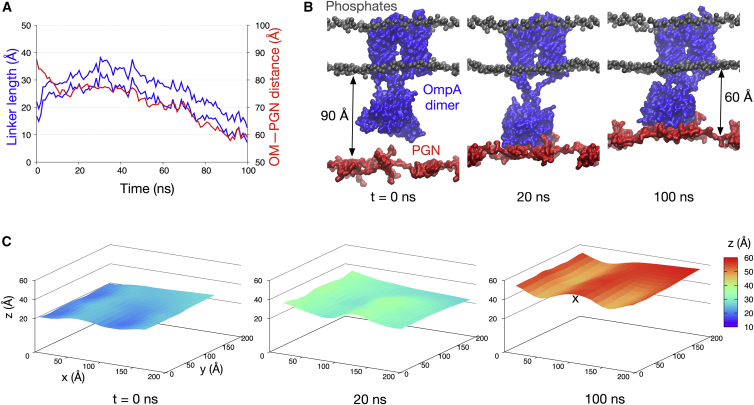
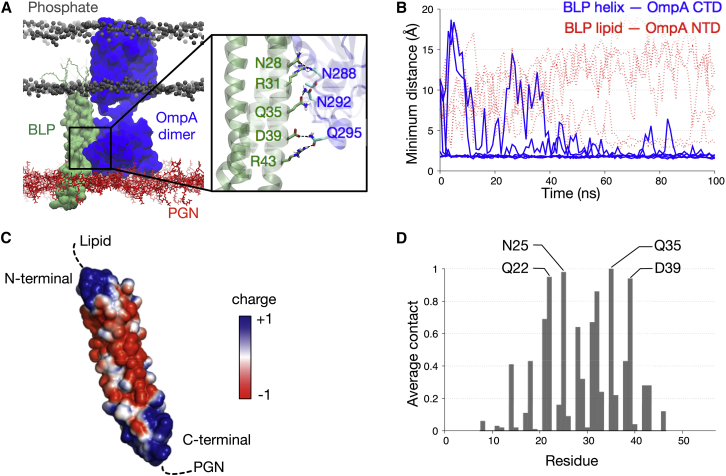
Gram-negative bacteria such as Escherichia coli are protected by a complex cell envelope. The development of novel therapeutics against these bacteria necessitates a molecular level understanding of the structure-dynamics-function relationships of the various components of the cell envelope. We use atomistic MD simulations to reveal the details of covalent and noncovalent protein interactions that link the outer membrane to the aqueous periplasmic region. We show that the Braun's lipoprotein tilts and bends, and thereby lifts the cell wall closer to the outer membrane. Both monomers and dimers of the outer membrane porin OmpA can interact with peptidoglycan in the presence of Braun's lipoprotein, but in the absence of the latter, only dimers of OmpA show a propensity to form contacts with peptidoglycan. Our study provides a glimpse of how the molecular components of the bacterial cell envelope interact with each other to mediate cell wall attachment in E. coli.
Copyright © 2017 Biophysical Society. Published by Elsevier Inc. All rights reserved.
Figures
Similar articles
-
Binding from Both Sides: TolR and Full-Length OmpA Bind and Maintain the Local Structure of the E. coli Cell Wall.Structure. 2019 Apr 2;27(4):713-724.e2. doi: 10.1016/j.str.2019.01.001. Epub 2019 Jan 31. Structure. 2019. PMID: 30713026
-
DpaA Detaches Braun's Lipoprotein from Peptidoglycan.mBio. 2021 May 4;12(3):e00836-21. doi: 10.1128/mBio.00836-21. mBio. 2021. PMID: 33947763 Free PMC article.
-
Details of hydrophobic entanglement between small molecules and Braun's lipoprotein within the cavity of the bacterial chaperone LolA.Sci Rep. 2019 Mar 6;9(1):3717. doi: 10.1038/s41598-019-40170-z. Sci Rep. 2019. PMID: 30842499 Free PMC article.
-
Atomistic and Coarse Grain Simulations of the Cell Envelope of Gram-Negative Bacteria: What Have We Learned?Acc Chem Res. 2019 Jan 15;52(1):180-188. doi: 10.1021/acs.accounts.8b00377. Epub 2018 Dec 18. Acc Chem Res. 2019. PMID: 30562009 Review.
-
Lipoproteins: Structure, Function, Biosynthesis.Subcell Biochem. 2019;92:39-77. doi: 10.1007/978-3-030-18768-2_3. Subcell Biochem. 2019. PMID: 31214984 Review.
Cited by
-
The lipoprotein Pal stabilises the bacterial outer membrane during constriction by a mobilisation-and-capture mechanism.Nat Commun. 2020 Mar 11;11(1):1305. doi: 10.1038/s41467-020-15083-5. Nat Commun. 2020. PMID: 32161270 Free PMC article.
-
Dual function of OmpM as outer membrane tether and nutrient uptake channel in diderm Firmicutes.Nat Commun. 2023 Nov 6;14(1):7152. doi: 10.1038/s41467-023-42601-y. Nat Commun. 2023. PMID: 37932269 Free PMC article.
-
Adaptation of the periplasm to maintain spatial constraints essential for cell envelope processes and cell viability.Elife. 2022 Jan 27;11:e73516. doi: 10.7554/eLife.73516. Elife. 2022. PMID: 35084330 Free PMC article.
-
Effects of Nanopillar Size and Spacing on Mechanical Perturbation and Bactericidal Killing Efficiency.Nanomaterials (Basel). 2021 Sep 22;11(10):2472. doi: 10.3390/nano11102472. Nanomaterials (Basel). 2021. PMID: 34684913 Free PMC article.
-
A previously uncharacterized divisome-associated lipoprotein, DalA, is needed for normal cell division in Rhodobacterales.mBio. 2023 Aug 31;14(4):e0120323. doi: 10.1128/mbio.01203-23. Epub 2023 Jun 30. mBio. 2023. PMID: 37389444 Free PMC article.
References
-
- Lugtenberg E.J., Peters R. Distribution of lipids in cytoplasmic and outer membranes of Escherichia coli K12. Biochim. Biophys. Acta. 1976;441:38–47. - PubMed
-
- Vollmer W., Bertsche U. Murein (peptidoglycan) structure, architecture and biosynthesis in Escherichia coli. Biochim. Biophys. Acta. 2008;1778:1714–1734. - PubMed
-
- Vollmer W., Blanot D., de Pedro M.A. Peptidoglycan structure and architecture. FEMS Microbiol. Rev. 2008;32:149–167. - PubMed
MeSH terms
Substances
Grants and funding
LinkOut - more resources
Full Text Sources
Other Literature Sources
Molecular Biology Databases
