

Lipid Order Degradation in Autoimmune Demyelination Probed by Polarized Coherent Raman Microscopy
- PMID: 28978445
- PMCID: PMC5627311
- DOI: 10.1016/j.bpj.2017.07.033
Lipid Order Degradation in Autoimmune Demyelination Probed by Polarized Coherent Raman Microscopy
Abstract
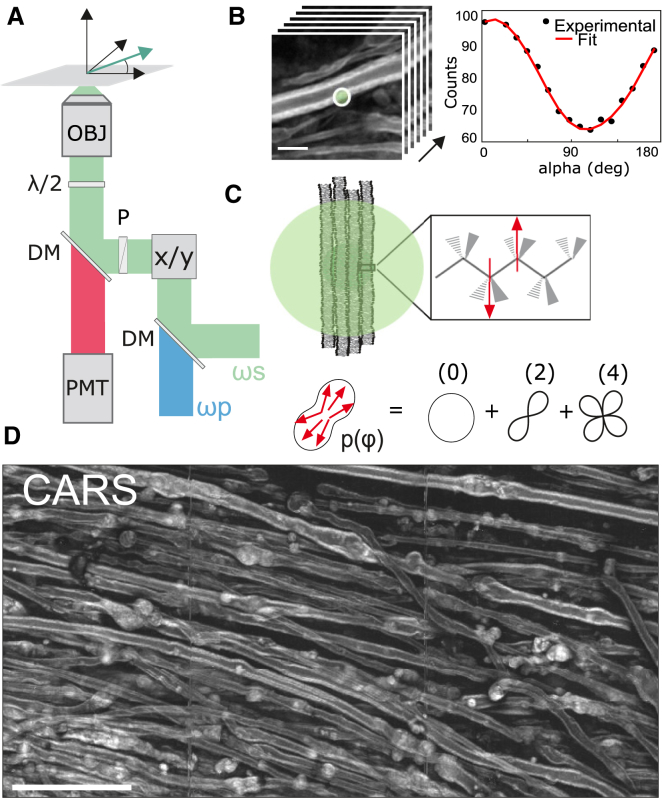
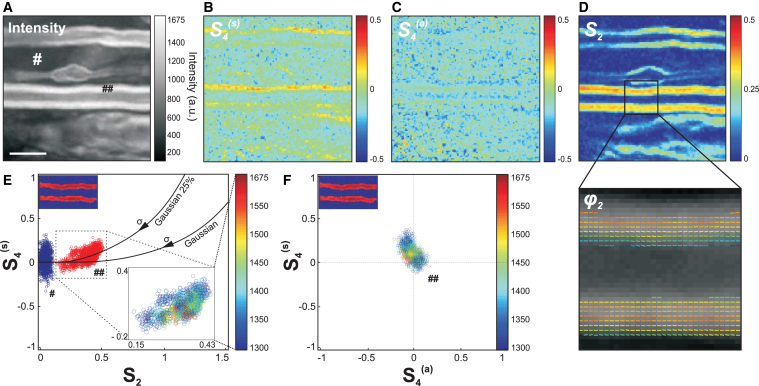
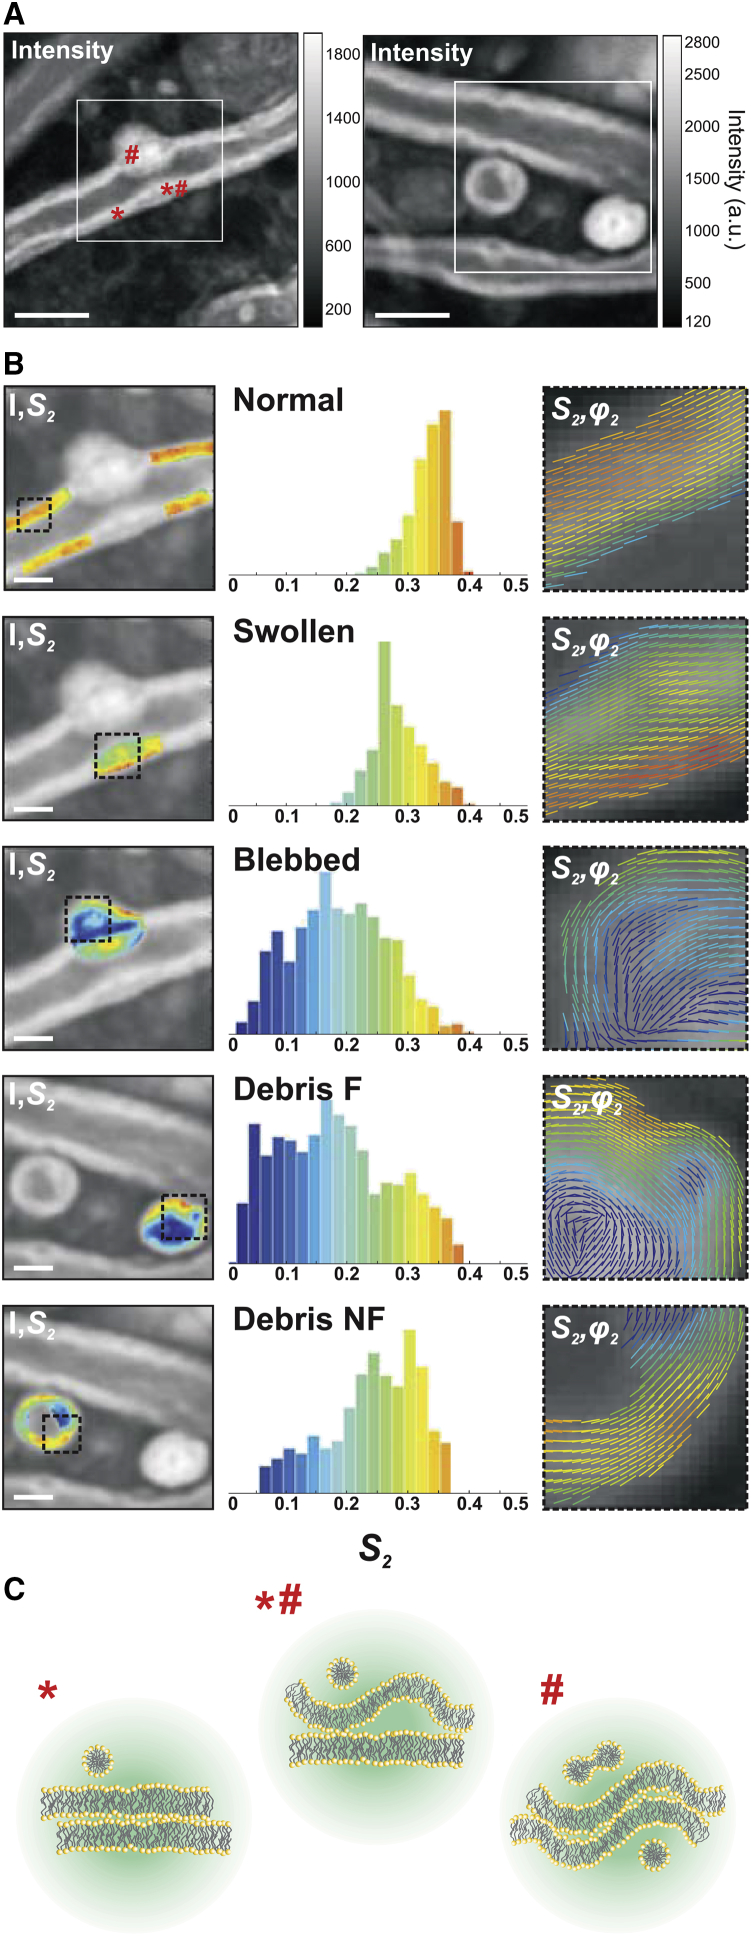
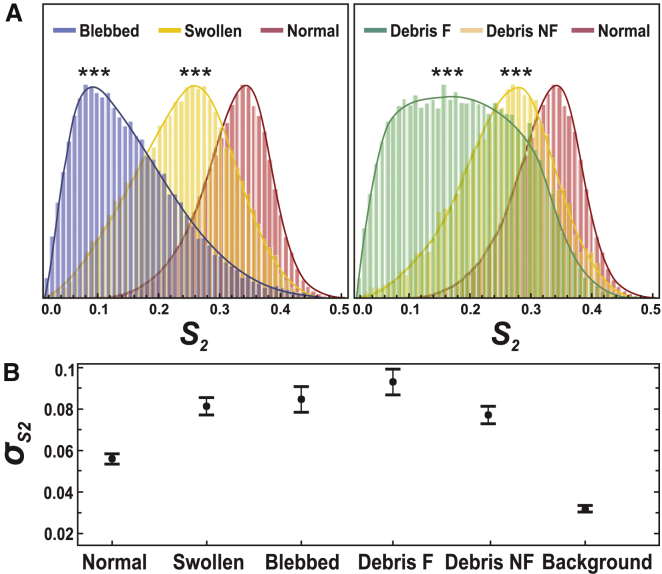
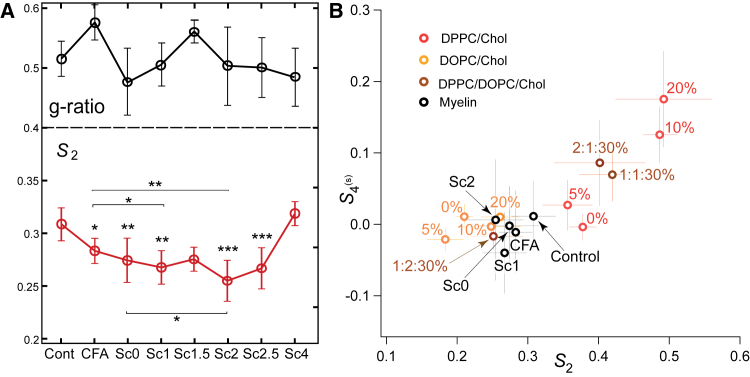
Myelin around axons is currently widely studied by structural analyses and large-scale imaging techniques, with the goal to decipher its critical role in neuronal protection. Although there is strong evidence that in myelin, lipid composition, and lipid membrane morphology are affected during the progression of neurodegenerative diseases, there is no quantitative method yet to report its ultrastructure in tissues at both molecular and macroscopic levels, in conditions potentially compatible with in vivo observations. In this work, we study and quantify the molecular order of lipids in myelin at subdiffraction scales, using label-free polarization-resolved coherent anti-Stokes Raman, which exploits coherent anti-Stokes Raman sensitivity to coupling between light polarization and oriented molecular vibrational bonds. Importantly, the method does not use any a priori parameters in the sample such as lipid type, orientational organization, and composition. We show that lipid molecular order of myelin in the mouse spinal cord is significantly reduced throughout the progression of experimental autoimmune encephalomyelitis, a model for multiple sclerosis, even in myelin regions that appear morphologically unaffected. This technique permits us to unravel molecular-scale perturbations of lipid layers at an early stage of the demyelination progression, whereas the membrane architecture at the mesoscopic scale (here ∼100 nm) seems much less affected. Such information cannot be brought by pure morphological observation and, to our knowledge, brings a new perspective to molecular-scale understanding of neurodegenerative diseases.
Copyright © 2017 Biophysical Society. Published by Elsevier Inc. All rights reserved.
Figures
Similar articles
-
Early axonal damage and progressive myelin pathology define the kinetics of CNS histopathology in a mouse model of multiple sclerosis.Clin Immunol. 2013 Oct;149(1):32-45. doi: 10.1016/j.clim.2013.06.004. Epub 2013 Jun 18. Clin Immunol. 2013. PMID: 23899992
-
Paranodal myelin retraction in relapsing experimental autoimmune encephalomyelitis visualized by coherent anti-Stokes Raman scattering microscopy.J Biomed Opt. 2011 Oct;16(10):106006. doi: 10.1117/1.3638180. J Biomed Opt. 2011. PMID: 22029353 Free PMC article.
-
Susceptibility-weighted imaging in the experimental autoimmune encephalomyelitis model of multiple sclerosis indicates elevated deoxyhemoglobin, iron deposition and demyelination.Mult Scler. 2013 May;19(6):721-31. doi: 10.1177/1352458512460602. Epub 2012 Oct 1. Mult Scler. 2013. PMID: 23027879
-
Immune profile of an atypical EAE model in marmoset monkeys immunized with recombinant human myelin oligodendrocyte glycoprotein in incomplete Freund's adjuvant.J Neuroinflammation. 2015 Sep 17;12:169. doi: 10.1186/s12974-015-0378-5. J Neuroinflammation. 2015. PMID: 26377397 Free PMC article.
-
Quantitative myelin imaging with coherent anti-Stokes Raman scattering microscopy: alleviating the excitation polarization dependence with circularly polarized laser beams.Opt Express. 2009 Oct 12;17(21):18419-32. doi: 10.1364/OE.17.018419. Opt Express. 2009. PMID: 20372572
Cited by
-
Reduced cholesterol alters the biophysical properties of repaired myelin.Biochim Biophys Acta Mol Cell Biol Lipids. 2025 Jun;1870(5):159637. doi: 10.1016/j.bbalip.2025.159637. Epub 2025 May 20. Biochim Biophys Acta Mol Cell Biol Lipids. 2025. PMID: 40403837 Free PMC article.
-
Raman Techniques: Fundamentals and Frontiers.Nanoscale Res Lett. 2019 Jul 12;14(1):231. doi: 10.1186/s11671-019-3039-2. Nanoscale Res Lett. 2019. PMID: 31300945 Free PMC article. Review.
-
Third harmonic imaging contrast from tubular structures in the presence of index discontinuity.Sci Rep. 2023 May 15;13(1):7850. doi: 10.1038/s41598-023-34528-7. Sci Rep. 2023. PMID: 37188736 Free PMC article.
-
From Research to Diagnostic Application of Raman Spectroscopy in Neurosciences: Past and Perspectives.Free Neuropathol. 2022 Aug 5;3:19. doi: 10.17879/freeneuropathology-2022-4210. eCollection 2022 Jan. Free Neuropathol. 2022. PMID: 37284145 Free PMC article.
-
Quantitative birefringence microscopy for imaging the structural integrity of CNS myelin following circumscribed cortical injury in the rhesus monkey.Neurophotonics. 2021 Jan;8(1):015010. doi: 10.1117/1.NPh.8.1.015010. Epub 2021 Mar 22. Neurophotonics. 2021. PMID: 33763502 Free PMC article.
References
-
- Morell P., Quarles R.H. Myelin formation, structure and biochemistry. In: Siegel G.J., Albers R.W., Brady S.T., Price D.L., editors. Basic Neurochemistry: Molecular, Cellular and Medical Aspects. 7th Ed. Elsevier/Academic Press; San Diego, CA: 1999. pp. 51–71.
-
- Aggarwal S., Yurlova L., Simons M. Central nervous system myelin: structure, synthesis, and assembly. Trends Cell Biol. 2011;21:585–593. - PubMed
-
- Moore G.R. Current concepts in the neuropathology and pathogenesis of multiple sclerosis. Can. J. Neurol. Sci. 2010;37(Suppl 2):S5–S15. - PubMed
-
- van der Valk P., Amor S. Preactive lesions in multiple sclerosis. Curr. Opin. Neurol. 2009;22:207–213. - PubMed
-
- Dalcanto M.C., Wiśniewski H.M., Raine C.S. Vesicular disruption of myelin in autoimmune demyelination. J. Neurol. Sci. 1975;24:313–319. - PubMed
MeSH terms
Substances
LinkOut - more resources
Full Text Sources
Other Literature Sources
