. 2017 Oct 3;21(1):37-46.
doi: 10.1016/j.celrep.2017.09.017.

Desynchronizing Embryonic Cell Division Waves Reveals the Robustness of Xenopus laevis Development

Affiliations

Desynchronizing Embryonic Cell Division Waves Reveals the Robustness of Xenopus laevis Development

Graham A Anderson et al. Cell Rep. .

Abstract

The early Xenopus laevis embryo is replete with dynamic spatial waves. One such wave, the cell division wave, emerges from the collective cell division timing of first tens and later hundreds of cells throughout the embryo. Here, we show that cell division waves do not propagate between neighboring cells and do not rely on cell-to-cell coupling to maintain their division timing. Instead, intrinsic variation in division period autonomously and gradually builds these striking patterns of cell division. Disrupting this pattern of division by placing embryos in a temperature gradient resulted in highly asynchronous entry to the midblastula transition and misexpression of the mesodermal marker Xbra. Remarkably, this gene expression defect is corrected during involution, resulting in delayed yet normal Xbra expression and viable embryos. This implies the existence of a previously unknown mechanism for normalizing mesodermal gene expression during involution.

Keywords: Xenopus laevis; asynchrony; cell cycle; cell division waves; early embryonic development; embryogenesis; mesoderm induction; metachronous cell division; midblastula transition; robustness.


Figures

Figure 1
Figure 1. Waves in Early Xenopus laevis Development
The Xenopus laevis embryo undergoes multiple spatially-organized and dynamic events in its early development. SEP denotes the sperm entry point, and mpf is minutes post-fertilization. Adapted from Nieuwkoop and Faber, 1994.
Figure 2
Figure 2. Cell Division Waves in Three Dimensions
The first 12 divisions of the X. laevis embryo are regular in time and nearly-synchronous within a round of division. Deviations from synchrony take the form of a wave of divisions. (A) Top view of X. laevis embryos at the 1-, 2-, 4-, and 8-cell stage, 18°C. (B) Cell cycle periods in the top view as a function of time at 18°C. The first cell cycle is much longer and was omitted for clarity. Cell cycle periods shortened slightly through division six, then began lengthening around division 9 or 10, followed by an increase in period at divisions 11 and 12. Error bands are ± one standard deviation. (C) Top-down view of cell division waves at 18°C. Cell division waves originated opposite the sperm entry point (SEP) and terminated near the SEP. Color scale denotes the timing of cell division with cooler colors being earlier divisions. Contours are at two minute intervals. (D) Top view of cell division as a function of position and time at 18°C. Lines were fit to rounds of division to illustrate their progression across the surface of the embryo in spatial waves. Centroids of parent cells were projected on to a line that runs along the direction of the division wave and plotted on the y axis. (E) Side view of X. laevis embryos at the 1-, 2-, 4-, and 8-cell stage. (F) Cell cycle periods in the side view as a function of time at 18°C. The second division is difficult to accurately score in the side view and is omitted along with the first for clarity. Trend of cell cycle periods is similar to the top view in B, but with more variation. Error bands are ±one standard deviation. (G) Side view of cell division waves at 18°C. Color scale and contours as in (C). (H) Side view of cell division as a function of position and time at 18°C. Centroids of parent cells are projected on to a line that runs along the animal-vegetal axis. (I) The direction of the first cleavage plane correlates with the direction of the post-fertilization wave. (J) Cell division waves anti-correlate with the direction of the post-fertilization wave. The post-fertilization wave begins near the sperm entry point and progresses away from it. The cell division wave begins opposite the SEP and progresses toward it. A total of 47 embryos were analyzed in panel I and 92 in panel J.
Figure 3
Figure 3. A Temperature Gradient Reveals Lack of Coupling in Cell Divisions
(A) Temperature gradient device. (B) Desynchronizing cell divisions. Embryo was initially maintained at 23°C, then a temperature gradient of 11°C - 25°C was applied during the time marked by the horizontal red bar, from 70 mpf to 107 mpf. The second round of cell divisions was desynchronized as a result, with the two divisions occurring approximately 15 min apart. Temperature was then uniformly set to 18°C for the remainder of time. Subsequent divisions were labeled red (descendants of the warmed cell) and blue (descendants of the cooled cell). Vertical lines indicate average division time of each group, and gray regions indicate the difference in average division time between the groups. (C) Cell divisions in a mock-treated control embryo at 18°C. (D) The difference in average division time between descendants of cooled cells and descendants of warmed cells. These values correspond to the width of gray regions in panel B. The error band is ± 1 standard deviation of the timing difference. (E) Average periods in lineages descended from the cooled cell (blue) and warmed cell (red) at the two-cell stage. Error bards are ± 1 standard deviation of the period. (F) Comparison of early and late division timing. Average timing differences measured at divisions two and three were compared with average timing differences measured at divisions seven and eight. For gradient embryos, timing differences were between descendants of warmed and cooled cells, and the temperature gradient was applied with different durations, ranging from 37 to 57 min (always starting at 70 mpf). For control embryos, timing differences were between descendants of the two-cell stage. Red point is the embryo in panels B, D, and E.
Figure 4
Figure 4. A Simple Model Accounts for Cell Division Waves
(A) Cell cycle periods for cells in the animal half (blue) and vegetal half (red) of nine unperturbed embryos at 18°C. Black bars are medians, and the shaded boxes indicate 25th and 75th percentiles. (B) The first six simulated divisions of a cubic space representing the embryo. (C-F) C and E are simulated cell division waves in the side view (C) and top view (E). D and F are experimentally measured cell division waves at 18°C for comparison. See also Figure S1.
Figure 5
Figure 5. A Side-to-Side Temperature Gradient Leads to Asynchronous MBT Entry
(A) Snapshots of embryo at 23°C at three different time points after it has experienced a side-to-side temperature gradient (11°C-25°C) from 1:10 hpf – 5:45 hpf. Two regions of equal size have been selected on the previously cold and previously warm side. (B) Number of visible cells in the previously cold region (blue) and the previously warm region (red) as indicated in (A). The number of visible cells have been calculated by taking the initial number of cells and then increasing it by one every time a cell division is observed. The black lines show a smoothed fit using the “robust LOESS” (quadratic fit) option in Matlab. (C)The average division rate of the visible cells as calculated from the fitted curves in (B). The time of maximal average division rate is taken as a measure for MBT onset. MBT is found to occur approx. 60 min later in the previously cold region than in the previously warm region (with a standard deviation of 16 min - 3 analyzed embryos).
Figure 6
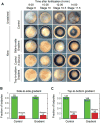
Figure 6. A Long Temperature Gradient Induces a Mesodermal Induction Defect and Reveals a Resynchonizing Mechanism
(A) Xbra expression after MBT. Time course of Xbra expression in gradient embryos treated in the side-to-side and top-to-bottom directions. Unstained and mock-treated control embryos are shown for comparison. (B-C) Phenotype and survival of embryos two weeks after gradient treatment. “Alive” includes embryos that survived with a generally normal phenotype, and “abnormal” includes embryos that did not survive and embryos that experienced clear developmental defects such as dorsalization, ventralization, and bent body axes.

References

    1. Amaya E, Stein PA, Musci TJ, Kirschner MW. FGF signaling in the early specification of mesoderm in Xenopus. Development. 1993;118:477–487. - PubMed
    1. Black SD. Experimental reversal of the normal dorsal-ventral timing of blastopore formation does not reverse axis polarity in Xenopus laevis embryos. Dev Biol. 1989;134:376–381. - PubMed
    1. Boterenbrood EC, Narraway JM, Hara K. Duration of cleavage cycles and asymmetry in the direction of cleavage waves prior to gastrulation in Xenopus laevis. Roux Arch Dev Biol. 1983;192:216–221. - PubMed
    1. Bowes JB, Snyder KA, Segerdell E, Jarabek CJ, Azam K, Zorn AM, Vize PD. Xenbase: gene expression and improved integration. Nucleic Acids Res. 2010;38:D607–D612. - PMC - PubMed
    1. Brown EE, Denegre JM, Danilchik MV. Deep cytoplasmic rearrangements in ventralized Xenopus embryos. Dev Biol. 1993;160:148–156. - PubMed

LinkOut - more resources