. 2017 Oct 3;21(1):97-109.
doi: 10.1016/j.celrep.2017.09.004.

Mutations in Membrin/GOSR2 Reveal Stringent Secretory Pathway Demands of Dendritic Growth and Synaptic Integrity

Affiliations

Mutations in Membrin/GOSR2 Reveal Stringent Secretory Pathway Demands of Dendritic Growth and Synaptic Integrity

Roman Praschberger et al. Cell Rep. .

Abstract

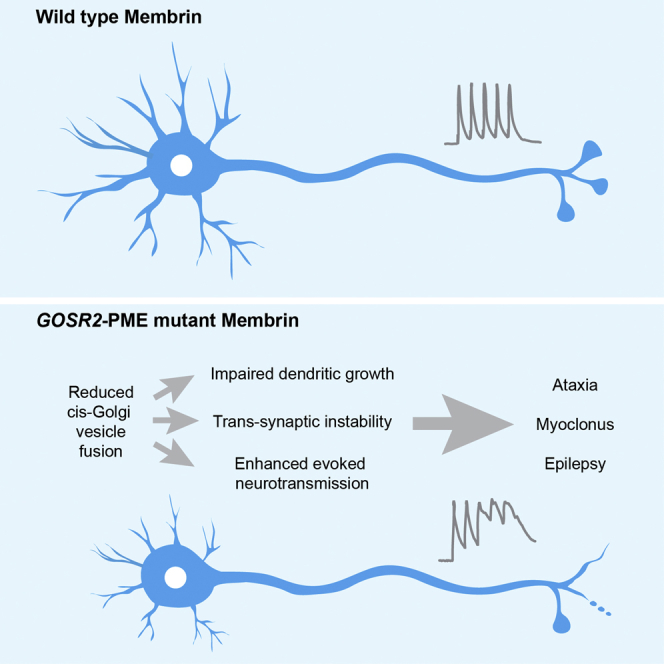
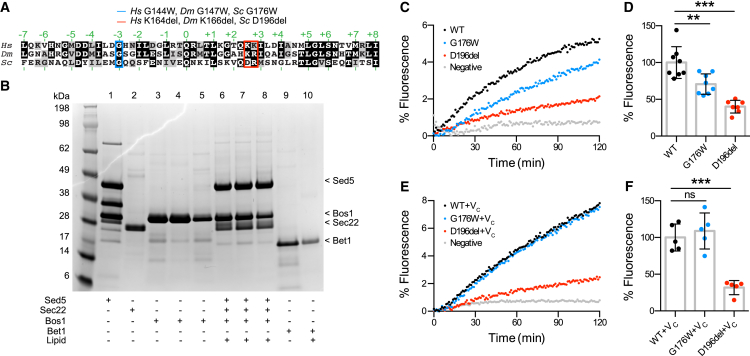
Mutations in the Golgi SNARE (SNAP [soluble NSF attachment protein] receptor) protein Membrin (encoded by the GOSR2 gene) cause progressive myoclonus epilepsy (PME). Membrin is a ubiquitous and essential protein mediating ER-to-Golgi membrane fusion. Thus, it is unclear how mutations in Membrin result in a disorder restricted to the nervous system. Here, we use a multi-layered strategy to elucidate the consequences of Membrin mutations from protein to neuron. We show that the pathogenic mutations cause partial reductions in SNARE-mediated membrane fusion. Importantly, these alterations were sufficient to profoundly impair dendritic growth in Drosophila models of GOSR2-PME. Furthermore, we show that Membrin mutations cause fragmentation of the presynaptic cytoskeleton coupled with transsynaptic instability and hyperactive neurotransmission. Our study highlights how dendritic growth is vulnerable even to subtle secretory pathway deficits, uncovers a role for Membrin in synaptic function, and provides a comprehensive explanatory basis for genotype-phenotype relationships in GOSR2-PME.

Keywords: GOSR2; GS27; Membrin; dendrite growth; progressive myoclonus epilepsy; synaptic integrity.


Figures

None
Graphical abstract
Figure 1
Figure 1
Reduced Liposome Fusion Rates due to Orthologous GOSR2-PME Mutations (A) SNARE domain alignment of Homo sapiens (Hs), Drosophila melanogaster (Dm), and Saccharomyces cerevisiae (Sc) Membrin (UniProt: O14653-1), Membrin (UniProt: Q9VRL2), and Bos1 (UniProt: P25385), respectively. Layer amino acids critical for forming the tetrameric cis-Golgi SNARE complex are indicated in green. The disease-causing G144W and K164del (one of two consecutive lysines is deleted) and the Drosophila and yeast orthologous residues are highlighted in blue and red. (B) Yeast Golgi SNARE proteins Sed5 (lane 1), Sec22 (lane 2), WT Bos1 (lane 3) and G176W/D196del Bos1 mutants (lane 4/5) were purified and reconstituted into acceptor liposomes as t-SNARE complexes comprised of Sed5/Sec22/Bos1 (lanes 6/7/8, respectively). Overall stoichiometry of Sed5/Sec22/Bos1 was ∼1.0×/1.0×/1.2× (Figure S1). Yeast Golgi SNARE protein Bet1 was purified (lane 9) and reconstituted into donor liposome (lane 10) containing 7-nitro-2-1,3-benzoxadiazol-4-yl (NBD)-phosphoethanolamine (PE) and rhodamine-PE fluorescent lipids. (C) Example traces showing increase in NBD fluorescence due to fusion between WT or G176W/D196del Bos1-containing t-SNARE complex acceptor liposomes and Bet1 donor liposomes. Data are expressed as a fraction of maximal NBD fluorescence after addition of detergent. (D) Endpoint (120 min) quantification of experiment as described in (C), normalized to WT. n = 8, 8, 7 for WT, G176W and D196del. (E) Example traces of experiment as in (C) with the modification that 50 μM of a peptide comprising the C-terminal half of the Bet1 SNARE domain (VC) was added. (F) Endpoint (120 min) quantification of experiment as described in (E), normalized to WT (n = 5). Replicate values, mean, and SD are shown. ∗∗p < 0.01; ∗∗∗p < 0.001; ns, not significant (p > 0.05); one-way ANOVA with Dunnett’s multiple comparison test.
Figure 2
Figure 2
Mutant Membrin Retains the Capability to Localize to the cis-Golgi (A) FLAG-tagged WT and G144W/K164del mutant Membrin were overexpressed in control fibroblasts and co-stained for the FLAG tag and the cis-Golgi resident protein GPP130. Example confocal slices are shown for each overexpressed construct. (B) Pearson’s correlation coefficients between FLAG and GP130 signals of the experiment described in (A) are shown. n = 16, 16, and 17 for WT, G144W, and K164del. (C) Pearson’s correlation coefficients between endogenous Membrin and GPP130 signals of the experiment described in (D) are shown. n = 12, 13, and 15 for control 1, control 2, and G144W. (D) Example confocal slices of control and Membrin G144W mutant fibroblasts co-stained for endogenous Membrin and GPP130. Replicate values, mean and SD are shown. p < 0.05; ∗∗p < 0.01; ∗∗∗p < 0.001; one-way ANOVA with Dunnett’s multiple comparison test.
Figure 3
Figure 3
Membrin Mutations Cause Early Lethality and Locomotor Defects in Drosophila (A) Genotypes of the GOSR2-PME Drosophila model used in this study. FLAG-tagged WT or mutant membrin (harboring the orthologous G147W/K166del mutations) is globally expressed via the daughterless-Gal4 driver in a membrin-null (membrin1524) background. The shorthand Mem-WT, Mem-G147W, and Mem-K166del is used throughout the paper. (B) The membrin1524 allele was balanced over the fluorescently labeled TM3 Kr > GFP chromosome to discern heterozygote animals. Homozygosity for membrin1524 caused largely L1 lethality, as at the L2 stage, hardly any non-GFP-positive larvae were detected. n = 50, 53, and 56 for L1, L2, and L3 larvae. (C) Global expression of WT, G147W, and K166del mutant Membrin rescued membrin-null Drosophila to the pupal stage. Data are expressed relative to Mem-WT. n = 1,222, 1,308, and 1,260 eggs/embryos for Mem-WT/-G147W/-K166del. (D) Mem-G147W and Mem-K166del Drosophila exhibited a drastic decrease in eclosion rates compared to Mem-WT. n = 120, 112, and 97 for Mem-WT/-G147W/-K166del non-tubby pupae. (E) Freely moving Mem-G147W and Mem-K166del L3 larvae crossed fewer 4-mm grids in 60 s than Mem-WT larvae. n = 19, 20, and 21 for Mem-WT/-G147W/-K166del. Replicate values, mean, and SD are shown. (F) Global membrin RNAi-mediated knockdown caused pharate adult stage lethality. n = 378, 162, and 313 for da-Gal4 driver and membrin RNAi transgene only controls and experimental knockdown. (G) Global overexpression of mutant UAS-membrin in WT Membrin animals with da-Gal4 resulted in reduced eclosion. n = 284, 514, and 403 for UAS-membrin[WT]/[G147W]/[K166del]. (H) Neuronal overexpression of mutant UAS-membrin in WT Membrin animals with nsyb-Gal4 resulted in reduced eclosion. n = 616, 491, and 618 for UAS-membrin[WT]/[G147W]/[K166del]. p < 0.05; ∗∗p < 0.01; ∗∗∗p < 0.001; ns, not significant (p > 0.05); Fisher’s exact test with Bonferroni correction (B–D and F–H) or one-way ANOVA with Dunnett’s multiple comparison test (E).
Figure 4
Figure 4
Membrin Mutations Cause Dendritic Growth Deficits (A) Maximum intensity projections of ddaC abdominal segment 5 neurons genetically labeled with ppk > CD4::tdGFP in Mem-WT/-G147W/-K166del. Respective tracings of the dendritic arbors are shown below. Arrowheads indicate axons. (B) Total dendritic length extracted from tracings as shown in (A). 9 A5 ddaC neurons per genotype were traced and analyzed in (B)–(E). (C) Number of terminal branches of ddaC A5 neurons. (D) Number of intersections of dendritic tracings with concentric circles with 2 pixel/circle increasing radii. Mean ± SEM are shown. (E) Total intersection of Sholl analysis as shown in (D). (F) CD4::tdGFP in large segments of primary ddaC A5 dendrites adjacent to the soma were photobleached with a 50 μm2 region of interest and fluorescence recovery quantified 25 μm from the soma proximal bleach margin. Means of n = 9, 8, and 9 ddaC neurons for Mem-WT/-G147W/-K166del are shown. Asterisks and ns indicate endpoint comparison after 29.5-min recovery. Replicate values, mean, and SD are shown unless otherwise stated. p < 0.05; ∗∗p < 0.01; ∗∗∗p < 0.001; ns, not significant (p > 0.05); one-way ANOVA with Dunnett’s multiple comparison test.
Figure 5
Figure 5
Membrin Mutations Alter Presynaptic Morphology and Axonal Stereotypy (A) Top: confocal z-stacks showing projections from ppk-positive sensory neurons labeled with membrane-tagged CD4::tdGFP innervating the ventral nerve cord (VNC) of L3 larvae. Synaptic neuropil of the VNC is labeled with anti-BRP. Below: magnified regions of segmental nerves. (B and C) Quantification of CD4::tdGFP fluorescence in the VNC neuropil (B) or in segmental nerves (C) normalized to BRP and expressed relative to Mem-WT. n = 5, 5, and 6 (B) and n = 20, 22, and 20 (C) for Mem-WT/-G147W/-K166del. (D) Top: example confocal z-stacks of HRP-labeled motor neurons innervating muscle 6/7, segment 3 of L3 larvae. Arrowheads point to small, isolated boutons that appear unattached to the axon. Below: magnified terminal boutons. In contrast to the rounded morphology in Mem-WT larvae, terminal boutons in Mem-G147W and Mem-K166del larvae often exhibit elongated protrusions. Further examples are depicted in Figure S6C. (E) Average number of boutons (type 1b and 1s) at muscle 6/7, segment 3. n = 18, 18, and 19 for Mem-WT/-G147W/-K166del. (F) Percentage of terminal boutons with elongated protrusions. Mean and SEM are shown. n = 32, 31, and 31 for Mem-WT/-G147W/-K166del. (G) Maximal axonal width of motor neurons innervating muscle 6/7, segment 3. n = 32, 30, and 31 for Mem-WT/-G147W/-K166del. (H) Coefficient of variation (calculated as SD/mean) in axonal width for each genotype. Replicate values, mean and SD are shown unless otherwise stated. p < 0.05; ∗∗p < 0.01; ∗∗∗p < 0.001; ns, not significant (p > 0.05); one-way ANOVA with Dunnett’s multiple comparison test (B and C) or Kruskal-Wallis test with Dunn’s post hoc test (E–G).
Figure 6
Figure 6
Synaptic Retraction and Presynaptic Cytoskeletal Fragmentation in membrin Mutants (A) Top: Maximum intensity z projection of confocal stacks showing pre- and postsynaptic apposition between BRP-labeled active zones and postsynaptic GLURIII glutamate receptors. Arrowheads denote regions where glutamate receptors lack their presynaptic active zone counterparts. Below: magnified view of regions exhibiting loss of BRP-labeled active zones in Mem-G147W and Mem-K166del synapses. (B) Normalized density of BRP puncta per NMJ area. n = 14, 13, and 11 for Mem-WT/-G147W/-K166del. Replicate values, mean, and SD are shown. (C) Average number of synaptic boutons where BRP fails to oppose GLURIII. n = 14, 13, and 12 for Mem-WT/-G147W/-K166del. Replicate values, mean, and SEM are shown. (D) Confocal z-stack maximum intensity projections illustrating localization of Ankyrin-2-XL (ANK2-XL) and Futsch. Small arrowheads point to synaptic domains containing either fragmented Futsch and ANK2-XL or reduced amounts of Futsch. Large arrowheads point to synaptic boutons and elongated protrusion apparently lacking both Futsch and ANK2-XL. p < 0.05; ∗∗p < 0.01; ns, not significant (p > 0.05); Kruskal-Wallis test with Dunn’s post hoc test.
Figure 7
Figure 7
Physiological Abnormalities at membrin Mutant NMJs (A) Representative traces of miniature excitatory postsynaptic potentials (mEPSPs) recorded from Mem-WT/-G147W/-K166del L3 larval muscle 6 abdominal segments 2–4. (B) Cumulative frequency plot of mEPSP intervals. 800 events per genotype from 8 animals each are shown. (C) Illustrative traces depicting mild to severe EPSP waveform distortion following 5 stimuli at 10 Hz. Traces are normalized to the peak amplitude. (D) Analysis of total number of abnormal events as a result of 10 Hz stimulation. 15 events were analyzed from each recording from 10 animals per genotype. (E) Overlay of averaged 10 Hz EPSP trains illustrating a significantly larger mean area under the curve in Mem-G147W and Mem-K166del compared to Mem-WT larvae (n = 10). (F) Mem-G147W and Mem-K166del larvae displayed longer recovery times after CNS electroshock compared to Mem-WT, indicative of increased seizure severity of the GOSR2-PME models. Mem-G147W and Mem-K166del recovery times were not significantly different compared to the Drosophila seizure model bang-senseless (bss). Replicate values, mean and SD are shown. n = 30 for Mem-WT/-G147W/-K166del/bss. p < 0.05; ∗∗∗p < 0.001; Kolmogorov-Smirnov test and Bonferroni correction (B), Fisher’s exact test and Bonferroni correction (D), one-way ANOVA with Dunnett’s multiple comparison test (E), and Kruskal-Wallis test with Dunn’s post hoc test (F).

References

    1. Aridor M., Fish K.N. Selective targeting of ER exit sites supports axon development. Traffic. 2009;10:1669–1684. - PMC - PubMed
    1. Bassuk A.G., Wallace R.H., Buhr A., Buller A.R., Afawi Z., Shimojo M., Miyata S., Chen S., Gonzalez-Alegre P., Griesbach H.L. A homozygous mutation in human PRICKLE1 causes an autosomal-recessive progressive myoclonus epilepsy-ataxia syndrome. Am. J. Hum. Genet. 2008;83:572–581. - PMC - PubMed
    1. Bischof J., Maeda R.K., Hediger M., Karch F., Basler K. An optimized transgenesis system for Drosophila using germ-line-specific phiC31 integrases. Proc. Natl. Acad. Sci. USA. 2007;104:3312–3317. - PMC - PubMed
    1. Bishop D.L., Misgeld T., Walsh M.K., Gan W.-B., Lichtman J.W. Axon branch removal at developing synapses by axosome shedding. Neuron. 2004;44:651–661. - PubMed
    1. Boissé Lomax L., Bayly M.A., Hjalgrim H., Møller R.S., Vlaar A.M., Aaberg K.M., Marquardt I., Gandolfo L.C., Willemsen M., Kamsteeg E.-J. ‘North Sea’ progressive myoclonus epilepsy: phenotype of subjects with GOSR2 mutation. Brain. 2013;136:1146–1154. - PubMed

MeSH terms