. 2017 Nov 6;214(11):3293-3310.
doi: 10.1084/jem.20170689. Epub 2017 Oct 4.

The infarcted myocardium solicits GM-CSF for the detrimental oversupply of inflammatory leukocytes

Affiliations

The infarcted myocardium solicits GM-CSF for the detrimental oversupply of inflammatory leukocytes

Atsushi Anzai et al. J Exp Med. .

Abstract

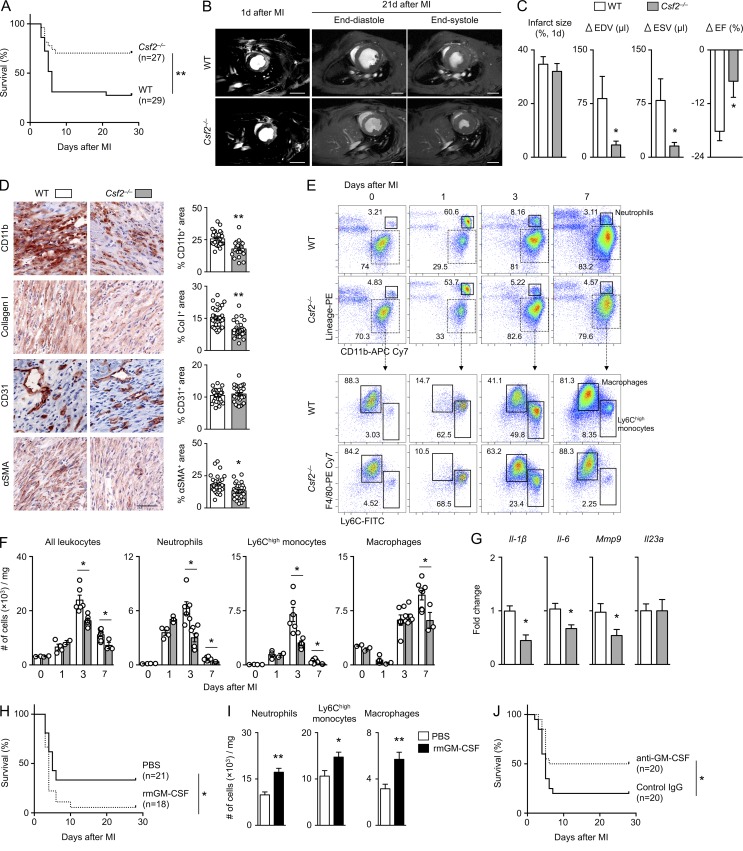
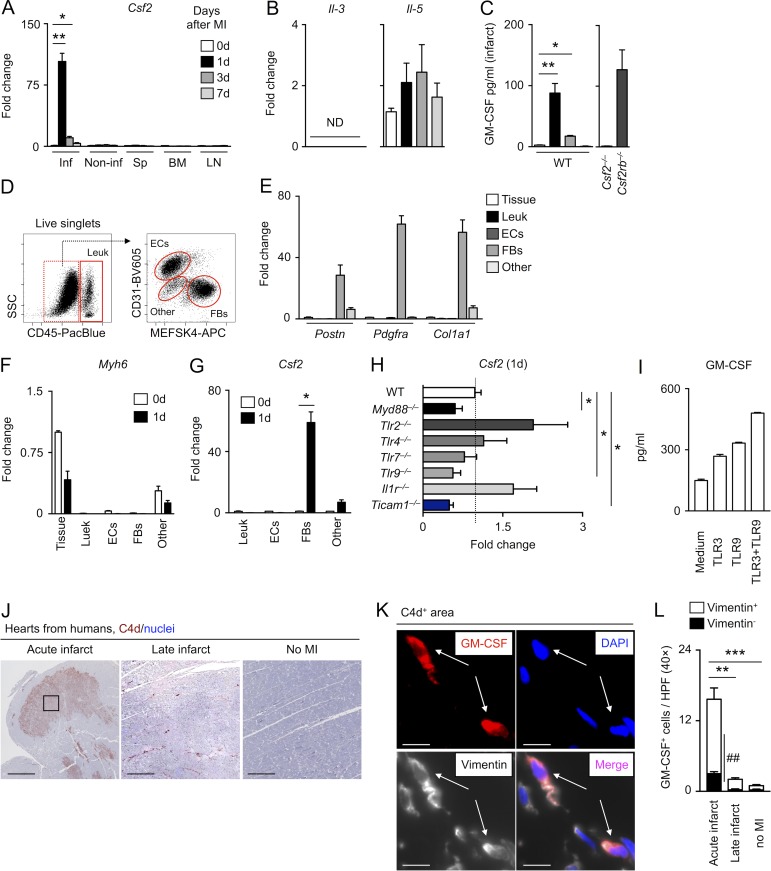
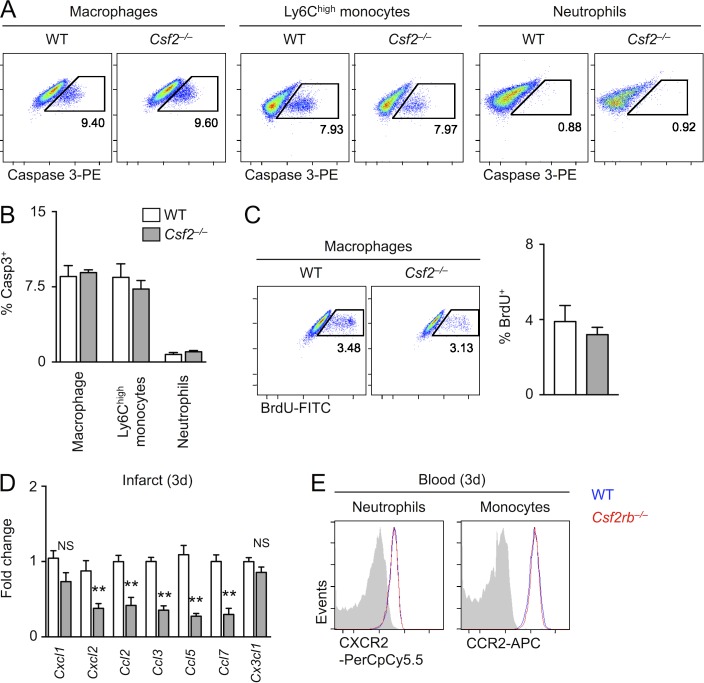
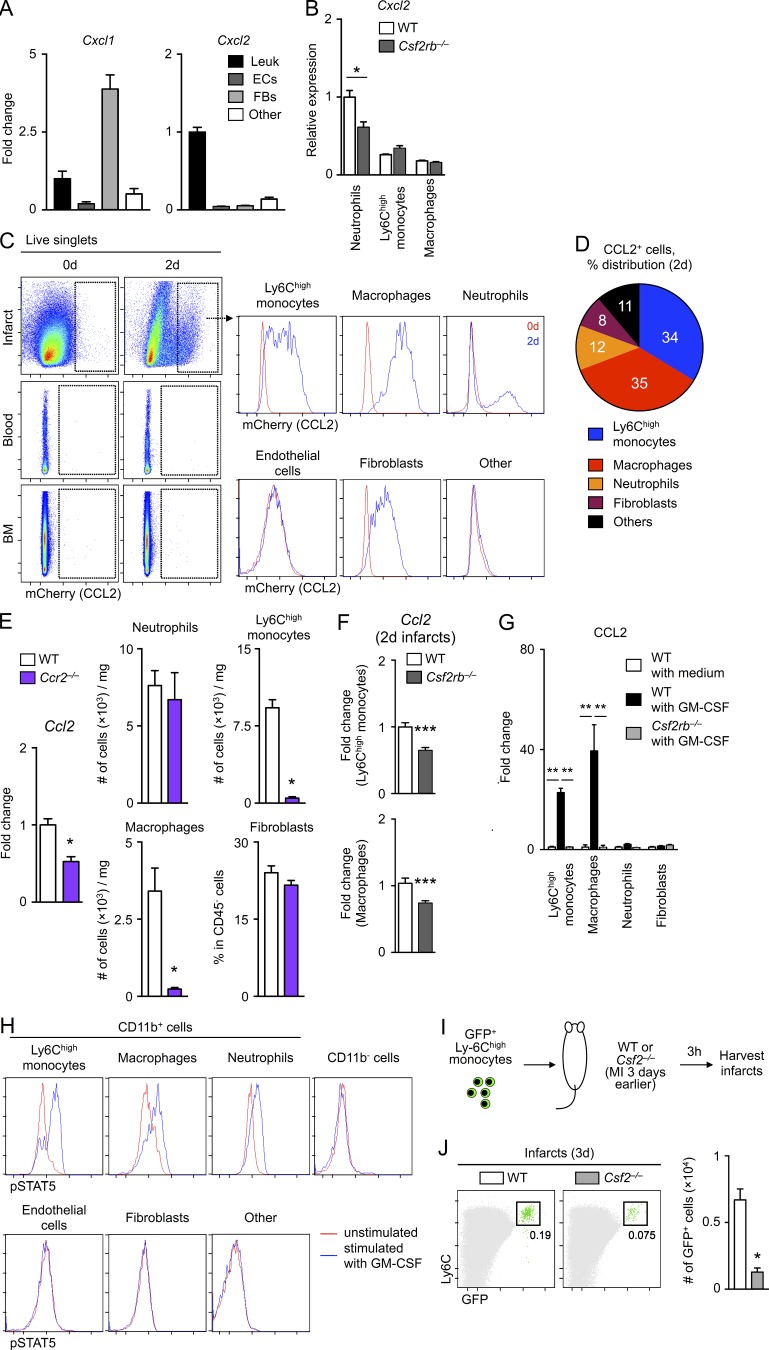
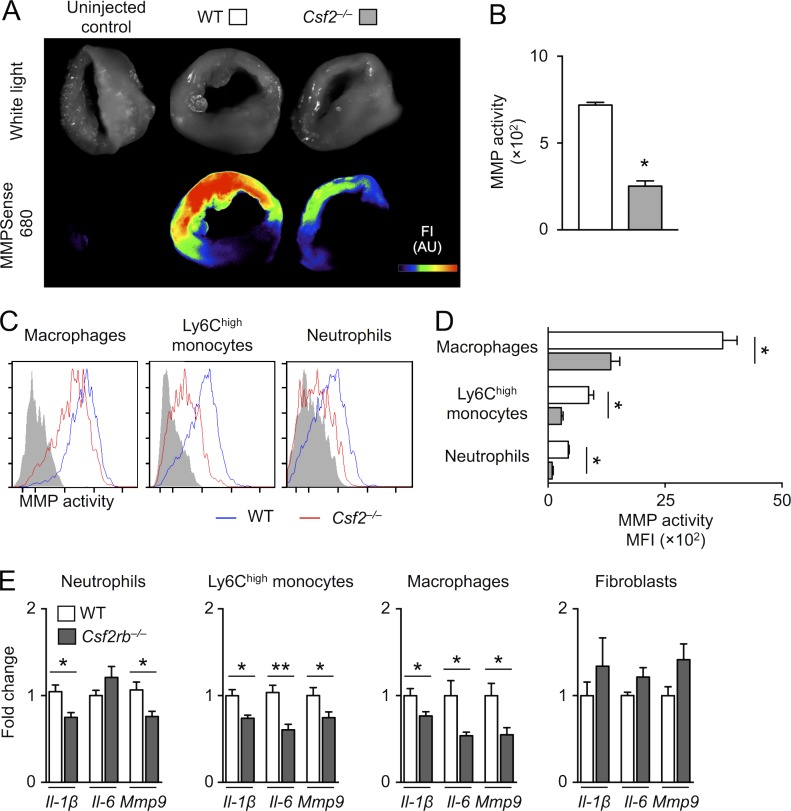
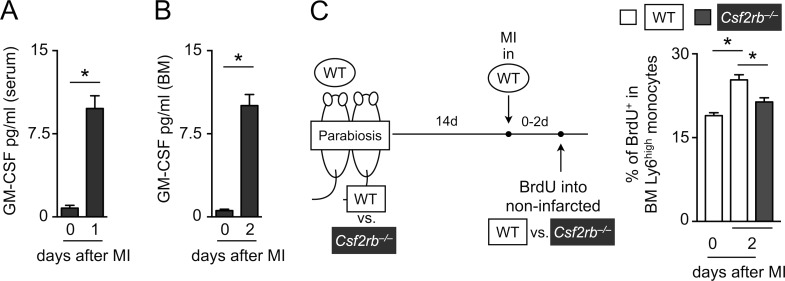
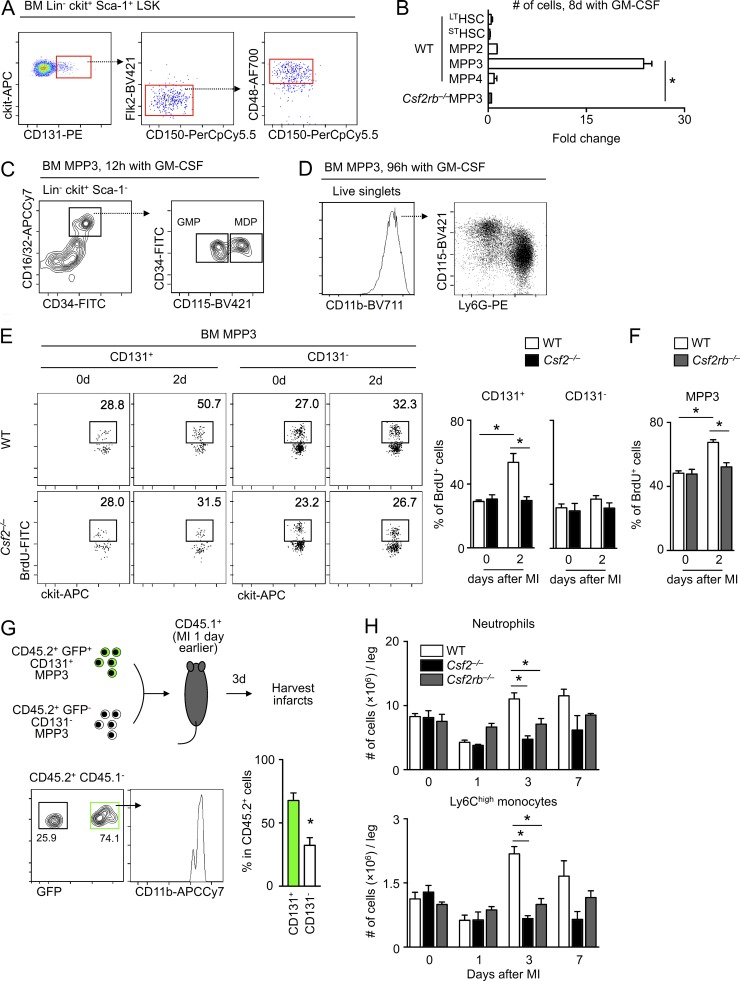
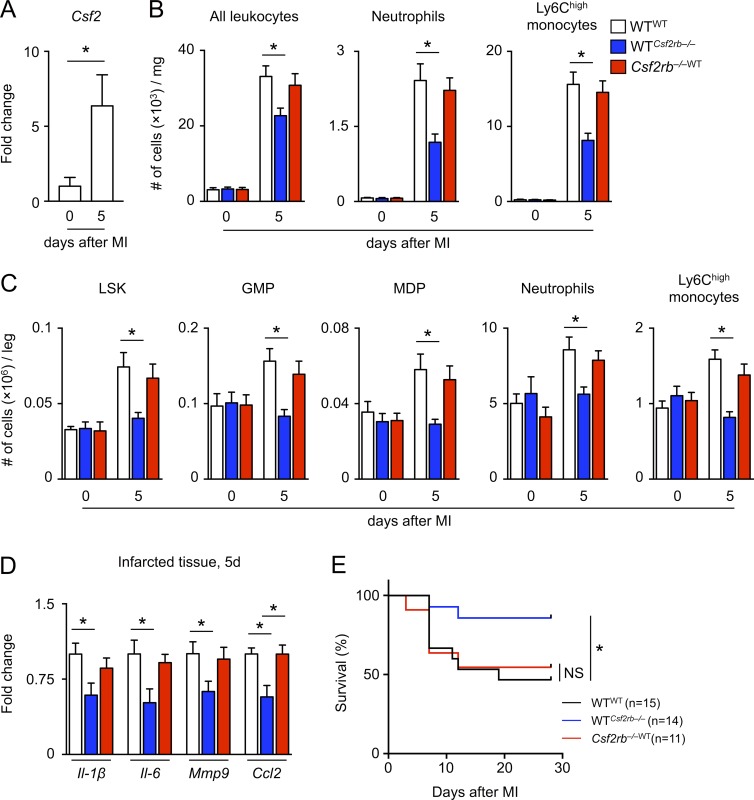
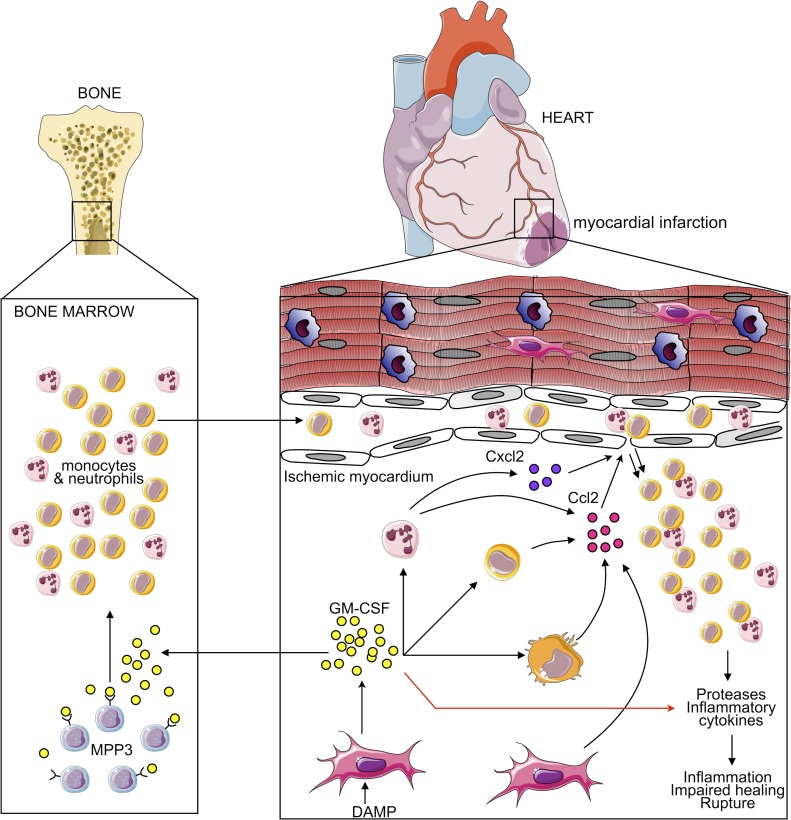
Myocardial infarction (MI) elicits massive inflammatory leukocyte recruitment to the heart. Here, we hypothesized that excessive leukocyte invasion leads to heart failure and death during acute myocardial ischemia. We found that shortly and transiently after onset of ischemia, human and mouse cardiac fibroblasts produce granulocyte/macrophage colony-stimulating factor (GM-CSF) that acts locally and distally to generate and recruit inflammatory and proteolytic cells. In the heart, fibroblast-derived GM-CSF alerts its neighboring myeloid cells to attract neutrophils and monocytes. The growth factor also reaches the bone marrow, where it stimulates a distinct myeloid-biased progenitor subset. Consequently, hearts of mice deficient in either GM-CSF or its receptor recruit fewer leukocytes and function relatively well, whereas mice producing GM-CSF can succumb from left ventricular rupture, a complication mitigated by anti-GM-CSF therapy. These results identify GM-CSF as both a key contributor to the pathogenesis of MI and a potential therapeutic target, bolstering the idea that GM-CSF is a major orchestrator of the leukocyte supply chain during inflammation.


Figures

Figure 1.
Figure 1.
GM-CSF is detrimental in MI. (A) Post-MI survival rate in WT and Csf2−/− mice. Data are from three independent experiments. **, P < 0.01. (B) Representative MRI images showing infarct size with late gadolinium enhancement on 1 d and heart morphology at end-diastolic and end-systolic phases 21 d after MI in WT and Csf2−/− mice. Bars, 4 mm. (C) Quantification of infarct size at 1 d as well as individual changes in indicated parameters from 1 to 21 d post-MI (n = 6–7 per group from two independent experiments). *, P < 0.05. (D) Immunohistochemical study of infarcted tissue for CD11b, collagen I, CD31, and α-smooth muscle actin (αSMA) in WT and Csf2−/− mice 7 d after MI. Quantification of 10 randomly assigned fields of view per sample (n = 5 per group). Bar, 30 µm. *, P < 0.05; **, P < 0.01. (E) Representative flow dot plots of MI tissue cell suspensions before and 1, 3, and 7 d after MI in WT and Csf2−/− mice. (F) Flow cytometry–based quantification of indicated cells in the hearts of WT and Csf2−/− mice before and 1, 3, and 7 d after MI (n = 3–7 per group from at least two independent experiments). *, P < 0.05. (G) mRNA levels of indicated cytokines in the infarcted tissue of WT and Csf2−/− mice 3 d after MI (n = 5–8 per group from three independent experiments). *, P < 0.05. (H) Post-MI survival rate in recombinant mouse GM-CSF (rmGM-CSF)-injected and PBS-injected WT mice. Data are from three independent experiments. *, P < 0.05. (I) Flow cytometry–based quantification of indicated cells in the hearts of rmGM-CSF–injected and PBS-injected WT mice 3 d after MI (n = 7 per group from three independent experiments). *, P < 0.05; **, P < 0.01. (J) Post-MI survival rate in mice treated with anti–GM-CSF neutralization antibody and control IgG. Data are from three independent experiments. *, P < 0.05. For statistical analysis, log-rank test was applied to compare survival curves, and two-tailed unpaired t test was performed to compare two groups. Results are shown as mean ± SEM.
Figure 2.
Figure 2.
GM-CSF is produced by cardiac fibroblasts after MI in mice and humans. (A) Csf2 mRNA levels in the infarcted tissue, uninfarcted tissue, spleen, BM, and mediastinal lymph node 1, 3, and 7 d after MI. Control mice were analyzed before MI (day 0; n = 3–5 per group from at least two independent experiments). *, P < 0.05, **, P < 0.01 vs. control. (B) Il-3 and Il-5 mRNA expression levels in infarcted tissue 1, 3, and 7 d after MI. Control mice were analyzed before MI (day 0; n = 5–6 per group from two independent experiments). (C) GM-CSF protein concentration in the heart homogenate of WT, Csf2−/−, and Csf2rb−/− mice 1, 3, and 7 d after MI. Control mice were analyzed before MI (day 0; n = 3–5 per group from two independent experiments) *, P < 0.05, **, P < 0.01 vs. control. (D) Flow cytometric gating strategy to determine total leukocytes (Leuk), endothelial cells (ECs), fibroblasts (FBs), and other stromal cells (Other) in the heart. (E) Expression levels of genes encoding periostin (Postn), platelet-derived growth factor receptor-α (Pdgfra), and collagen 1a1 (Col1a1) in infarcted tissue and indicated cells sorted from infarcted myocardium 1 d after MI. Values are normalized by gene levels in tissue (n = 5–6 per group from two independent experiments). (F) Gene levels of Myh6, which is specific for cardiomyocytes, in the heart tissue and the sorted heart subpopulations defined in D before and 1 d after MI. Data were normalized to 0 d tissue (n = 5–6 per group from two independent experiments). (G) Csf2 mRNA expression levels in the sorted heart subpopulations defined in D before and 1 d after MI (n = 4–5 mice from at least two independent experiments). *, P < 0.05 vs. 0 d. (H) Csf2 mRNA expression levels in infarcted tissue of WT, Myd88−/−, Tlr2−/−, Tlr4−/−, Tlr7−/−, Tlr9−/−, Il1r−/−, and Ticam1−/− (the gene that encodes TRIF) mice 1 d after MI (n = 4–8 mice from two to three independent experiments). *, P < 0.05 vs. WT heart. (I) GM-CSF protein concentration in supernatants of cardiac fibroblasts cultured in the presence or absence of TLR3 or TLR9 agonists (n = 4–6 per group from at least two independent experiments). (J) Representative immunohistochemical images of C4d staining in heart sections of patients with or without MI. Acute and late infarcts indicate the heart sections from patients who died within 2 d (acute) or 7 d (late) after MI onset. Bars, 1 mm. (K) Identification of GM-CSF+ vimentin+ cardiac fibroblasts (white arrows) in C4d+ area indicated by the square in J. Bars, 20 µm. (L) Quantification of GM-CSF+ cells in heart sections of patients with or without MI. Cells were counted in 25 randomly selected fields of view per sample. **, P < 0.01, ***, P < 0.001 vs. no MI; ##, P < 0.01 vs. vimentin. For statistical analysis, two-tailed unpaired t test was performed to compare two groups, and one-way ANOVA followed by Tukey’s test was performed for multiple comparisons. Results are shown as mean ± SEM.
Figure 3.
Figure 3.
GM-CSF promotes chemokine expression, but does not affect cell survival and proliferation in infarcted myocardium. (A) Representative flow cytometric dot plots of activated caspase 3 expression in WT and Csf2−/− macrophages, Ly-6Chigh monocytes, and neutrophils in infarcted tissue 3 d after MI. (B) Flow cytometry–based quantification of activated caspase 3+ cells shown in A (n = 4 per group from two independent experiments). (C) Flow cytometric analysis of BrdU incorporation into WT and Csf2−/− macrophages in the infarcted tissue 3 d after MI. BrdU was injected 2 h before death (n = 5 per group from two independent experiments). (D) Gene expression levels of Cxcl1, Cxcl2, Ccl2, Ccl3, Ccl5, Ccl7, and Cx3cl1 in 3-d-old infarcts of WT and Csf2−/− mice (n = 7–8 per group from three independent experiments). **, P < 0.01; NS, not significant. (E) Representative flow cytometric histograms for CXCR2 expression on blood neutrophils and CCR2 expression on blood Ly-6Chigh monocytes of WT and Csf2rb−/− mice 3 d after MI. For statistical analysis, two-tailed unpaired t test was performed to compare two groups. Results are shown as mean ± SEM.
Figure 4.
Figure 4.
GM-CSF recruits neutrophils and monocytes after MI by stimulating Cxcl2 and Ccl2 production. (A) Gene levels of Cxcl1 and Cxcl2 in the sorted heart subpopulations 3 d after MI. Data were normalized to Leuk (n = 4 per subpopulation from two independent experiments). (B) Cxcl2 mRNA expression levels in neutrophils, Ly-6Chigh monocytes, and macrophages sorted from 3-d-old infarcts of WT and Csf2rb−/− mice (n = 6 per population from at least two independent experiments). *, P < 0.05. (C) Representative flow cytometric images for mCherry expression in B6.Cg-Ccl2tm1.1Pame/J mouse heart, blood, and BM before and 2 d after MI. (D) Pie chart showing percentage distribution of mCherry+ cells for the indicated subpopulations in infarcted myocardium 2 d after MI. (E) Ccl2 mRNA expression in infarct and enumeration of indicated cells in the hearts of WT and Ccr2−/− mice 3 d after MI (n = 4–6 per group from two independent experiments). *, P < 0.05. (F) Ccl2 mRNA expression in WT and Csf2rb−/− Ly-6Chigh monocytes and macrophages in MI tissue 2 d after MI (n = 9–10 per group from at least three independent experiments). ***, P < 0.001. (G) Ly-6Chigh monocytes, macrophages, neutrophils, and fibroblasts were sorted from 2-d-old infarct of WT or Csf2rb−/− mice and cultured in the presence or absence of GM-CSF for 48 h. GM-CSF protein levels were measured in the supernatants. Values are normalized to WT with medium (n = 5–6 per group from two independent experiments). **, P < 0.01. (H) Representative flow cytometric histograms for pSTAT5 expression in the indicated cells. Single cell suspension from hearts 2 d after MI was incubated with or without GM-CSF and stained with pSTAT5. (I) Illustration of experimental approach with adoptive transfer of sorted GFP+ BM Ly-6Chigh monocytes (3 × 10⁶) into WT or Csf2−/− mice 3 d after permanent coronary ligation. (J) Representative flow dot plots of infarcted hearts of WT and Csf2−/− mice for GFP+ cells 3 h after the transfer. Quantification of GFP+ cells in the hearts of indicated animals is also shown (n = 4 per group from two independent experiments). *, P < 0.05. For statistical analysis, two-tailed unpaired t test was performed to compare two groups, and one-way ANOVA followed by Tukey’s test was performed for multiple comparisons. Results are shown as mean ± SEM.
Figure 5.
Figure 5.
GM-CSF promotes accumulation of proteolytic and inflammatory neutrophils and monocytes. (A) Representative pictures of ex vivo fluorescence reflectance imaging using MMPSense 680 for WT and Csf2−/− infarcted hearts 3 d after MI. FI, fluorescent intensity. (B) Quantification of MMP activity in 3-d-old infarcts of WT and Csf2−/− mice (n = 4–6 per group). *, P < 0.05. (C) Representative flow cytometric histograms for MMP activity in macrophages, Ly-6Chigh monocytes, and neutrophils. (D) Flow cytometry–based quantification of MMP activity (n = 4–6 per group). *, P < 0.05. (E) Gene expression levels of Il-1β, Il-6, and Mmp9 in neutrophils, Ly-6Chigh monocytes, macrophages, and fibroblasts sorted from WT and Csf2rb−/− MI tissue 3 d after MI (n = 5–12 per group from three independent experiments). *, P < 0.05; **, P < 0.01. For statistical analysis, two-tailed unpaired t test was performed to compare two groups. Results are shown as mean ± SEM.
Figure 6.
Figure 6.
Infarct-derived GM-CSF stimulates BM cell proliferation via circulation. (A and B) GM-CSF protein levels in serum (A) and BM (B) at indicated time points after MI (n = 4 per group from two independent experiments). *, P < 0.05. (C) Diagram of the experimental design and quantification of percentage of BrdU+ BM Ly-6Chigh monocytes in the indicated noninfarcted parabionts before and 2 d after MI. 14 d after parabiosis surgery, MI was induced in WT mice (circle). Noninfarcted mice (WT or Csf2rb−/− mice with square) were analyzed 2 d post-MI. BrdU was injected into noninfarcted mice 2 h before death (n = 4–5 per group from at least two independent experiments). *, P < 0.05. For statistical analysis, two-tailed unpaired t test was performed to compare two groups, and one-way ANOVA followed by Tukey’s test was performed for multiple comparisons. Results are shown as mean ± SEM.
Figure 7.
Figure 7.
CD131+ multipotent progenitor subset contributes to BM hematopoiesis in response to GM-CSF after MI. (A) Representative flow dot plots for CD131+ cells in BM LSK. (B) Cell numbers of sorted LSK subpopulations stimulated with GM-CSF for 8 d. The data were normalized by 5 × 10³ that were initially seeded into the culture plate (n = 3–4 per group from two to three independent experiments). *, P < 0.05. (C and D) Representative flow cytometric plots 12 h (C) and 96 h (D) after placement of sorted BM MPP3s in medium containing GM-CSF. (E) Representative flow dot plots and quantification of BrdU+ CD131+ or CD131 MPP3s in WT and Csf2−/− mice at indicated time points (n = 5–6 per group from three independent experiments). BrdU was injected 24 h before death. *, P < 0.05. (F) Quantification of BrdU+ MPP3s in WT and Csf2rb−/− mice before and 2 d after MI (n = 5–6 per group from three independent experiments). BrdU was injected 24 h before death. *, P < 0.05. (G) Illustration of experimental setup and flow dot plots of CD45.2+ cells in infarcted myocardium with quantification. Injected CD45.2+ CD131+ MPP3s are detected as GFP+, whereas CD45.2+ CD131 MPP3s are shown as GFP (n = 4–5 per group from two independent experiments). *, P < 0.05. (H) Time course of BM neutrophil and Ly-6Chigh monocyte numbers in WT, Csf2−/−, and Csf2rb−/− mice after MI (n = 4–7 per group from at least three independent experiments). *, P < 0.05. For statistical analysis, two-tailed unpaired t test was performed to compare two groups, and one-way ANOVA followed by Tukey’s test was performed for multiple comparisons. Results are shown as mean ± SEM.
Figure 8.
Figure 8.
GM-CSF licenses BM-derived cells to cause left ventricular rupture and immunopathology after coronary artery ligation. WT mice were lethally irradiated and reconstituted with BM cells from either WT or Csf2rb−/− mice (WTWT and WTCsf2rb−/− mice, respectively). Csf2rb−/−WT mice were made by reconstitution of irradiated Csf2rb−/− mice with WT BM. (A) Csf2 mRNA expression levels in infarcted tissue of WTWT mice before and 5 d after MI (n = 3–6 per group from two independent experiments). *, P < 0.05. (B) Flow cytometry–based quantification of indicated cells in the hearts of WTWT, WTCsf2rb−/−, and Csf2rb−/−WT mice before and 5 d after MI (n = 4–7 per group from at least two independent experiments). *, P < 0.05. (C) Quantification of indicated BM cell fractions of WTWT, WTCsf2rb−/−, and Csf2rb−/−WT mice before and 5 d after MI (n = 4–7 per group from at least two independent experiments). *, P < 0.05. (D) mRNA expression levels of Il-1β, Il-6, Mmp9, and Ccl2 in infarcted tissue of WTWT, WTCsf2rb−/−, and Csf2rb−/−WT mice 5 d after MI (n = 6–8 per group from at least two independent experiments). *, P < 0.05. (E) Post-MI survival rate after MI in WTWT, WTCsf2rb−/−, and Csf2rb−/−WT mice. Data are from three independent experiments. *, P < 0.05. For statistical analysis, log-rank test was applied to compare survival curves, two-tailed unpaired t test was performed to compare two groups, and one-way ANOVA followed by Tukey’s test was performed for multiple comparisons. Results are shown as mean ± SEM.
Figure 9.
Figure 9.
Proposed model. The cartoon depicts functions by which GM-CSF aggravates healing after MI. GM-CSF is produced by cardiac fibroblasts in response to damage-associated molecular patterns (DAMP). Fibroblast-produced GM-CSF acts locally on myeloid cells, which promote chemokine-dependent leukocyte recruitment. Fibroblast-generated GM-CSF also acts at a distance in the BM, where it stimulates CD131+ MPP3 to produce proteolytic and inflammatory neutrophils and monocytes. Together, these local and systemic functions result in enhanced production and recruitment of cells that aggravate post-MI healing.

References

    1. Anzai A., Anzai T., Nagai S., Maekawa Y., Naito K., Kaneko H., Sugano Y., Takahashi T., Abe H., Mochizuki S., et al. . 2012. Regulatory role of dendritic cells in postinfarction healing and left ventricular remodeling. Circulation. 125:1234–1245. 10.1161/CIRCULATIONAHA.111.052126 - DOI - PubMed
    1. Becher B., Tugues S., and Greter M.. 2016. GM-CSF: From Growth Factor to Central Mediator of Tissue Inflammation. Immunity. 45:963–973. 10.1016/j.immuni.2016.10.026 - DOI - PubMed
    1. Bradley T.R., and Metcalf D.. 1966. The growth of mouse bone marrow cells in vitro. Aust. J. Exp. Biol. Med. Sci. 44:287–300. 10.1038/icb.1966.28 - DOI - PubMed
    1. Brown D.W., Giles W.H., and Croft J.B.. 2001. White blood cell count: an independent predictor of coronary heart disease mortality among a national cohort. J. Clin. Epidemiol. 54:316–322. 10.1016/S0895-4356(00)00296-1 - DOI - PubMed
    1. Bruno S., Bussolati B., Scacciatella P., Marra S., Sanavio F., Tarella C., and Camussi G.. 2006. Combined administration of G-CSF and GM-CSF stimulates monocyte-derived pro-angiogenic cells in patients with acute myocardial infarction. Cytokine. 34:56–65. 10.1016/j.cyto.2006.03.014 - DOI - PubMed

MeSH terms

Substances