

AQP4e-Based Orthogonal Arrays Regulate Rapid Cell Volume Changes in Astrocytes
- PMID: 28978666
- PMCID: PMC6596517
- DOI: 10.1523/JNEUROSCI.0776-17.2017
AQP4e-Based Orthogonal Arrays Regulate Rapid Cell Volume Changes in Astrocytes
Abstract
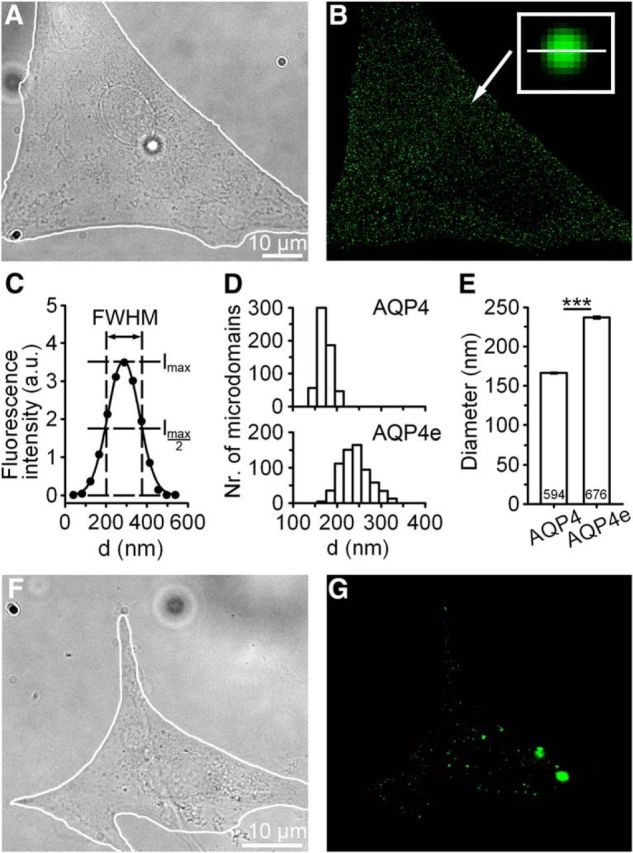
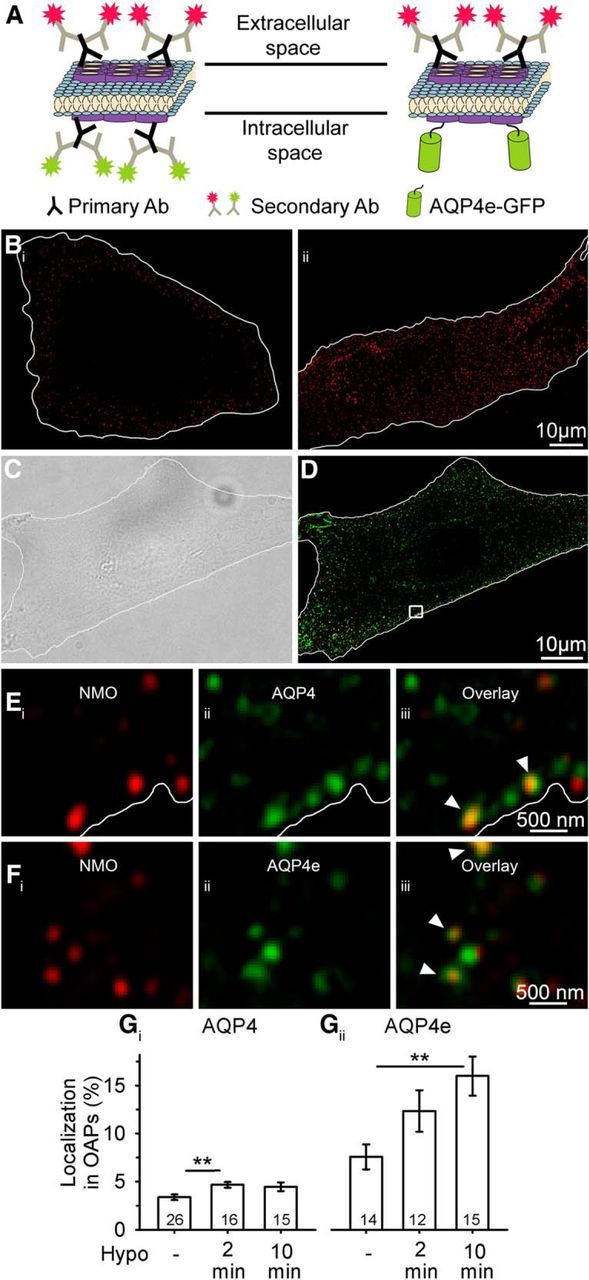
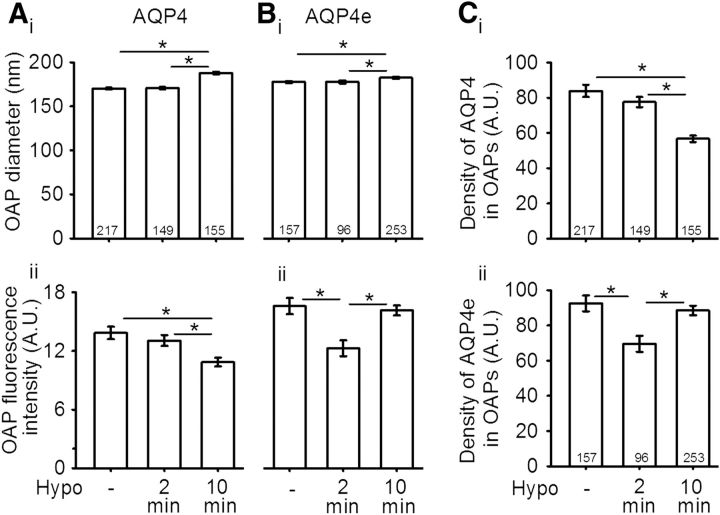
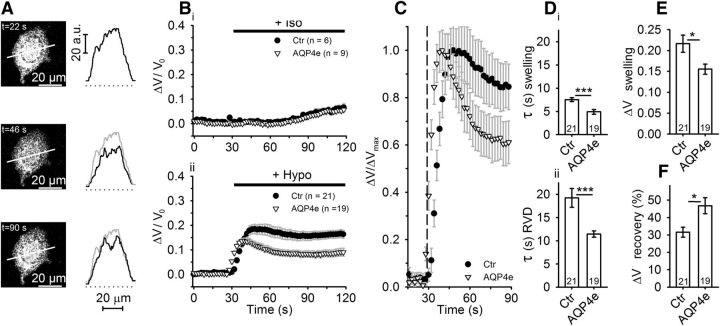
Water channel aquaporin 4 (AQP4) plays a key role in the regulation of water homeostasis in the brain. It is predominantly expressed in astrocytes at the blood-brain and blood-liquor interfaces. Although several AQP4 isoforms have been identified in the mammalian brain, two, AQP4a (M1) and AQP4c (M23), have been confirmed to cluster into plasma membrane supramolecular structures, termed orthogonal arrays of particles (OAPs) and to enhance water transport through the plasma membrane. However, the role of the newly described water-conductive mammalian isoform AQP4e is unknown. Here, the dynamics of AQP4e aggregation into OAPs and its role in the regulation of astrocyte water homeostasis have been studied. Using super-resolution structured illumination, atomic force, and confocal microscopies, the results revealed that, in female rat astrocytes, AQP4e isoform colocalizes with OAPs, affecting its structural dynamics. In hypoosmotic conditions, which elicit cell edema, OAP formation was considerably enhanced by overexpressed AQP4e. Moreover, the kinetics of the cell swelling and of the regulatory volume decrease was faster in astrocytes overexpressing AQP4e compared with untransfected controls. Furthermore, the increase in maximal cell volume elicited by hypoosmotic stimulation was significantly smaller in AQP4e-overexpressing astrocytes. For the first time, this study demonstrates an active role of AQP4e in the regulation of OAP structural dynamics and in water homeostasis.SIGNIFICANCE STATEMENT Water channel aquaporin 4 (AQP4) plays a key role in the regulation of water homeostasis in the brain. To date, only AQP4a and AQP4c isoforms have been confirmed to enhance water transport through plasmalemma and to cluster into orthogonal arrays of particles (OAPs). We here studied the dynamics, aggregation, and role in the regulation of astrocyte water homeostasis of the newly described water-conductive mammalian isoform AQP4e. Our main findings are as follows: brain edema mimicking hypoosmotic conditions stimulates the formation of new OAPs with larger diameters, due to the incorporation of additional cytoplasmic AQP4 channels and the redistribution of AQP4 channels of the existing OAPs; and AQP4e affects the dynamics of cell swelling and regulatory volume decrease in astrocytes exposed to hypoosmotic conditions.
Keywords: aquaporin 4; astrocytes; atomic force microscopy; glia; orthogonal arrays of particles; structured illumination microscopy.
Copyright © 2017 the authors 0270-6474/17/3710748-09$15.00/0.
Figures
Similar articles
-
Indirect Role of AQP4b and AQP4d Isoforms in Dynamics of Astrocyte Volume and Orthogonal Arrays of Particles.Cells. 2020 Mar 17;9(3):735. doi: 10.3390/cells9030735. Cells. 2020. PMID: 32192013 Free PMC article.
-
Insights into Cell Surface Expression, Supramolecular Organization, and Functions of Aquaporin 4 Isoforms in Astrocytes.Cells. 2020 Dec 7;9(12):2622. doi: 10.3390/cells9122622. Cells. 2020. PMID: 33297299 Free PMC article. Review.
-
Regulation of AQP4 surface expression via vesicle mobility in astrocytes.Glia. 2013 Jun;61(6):917-28. doi: 10.1002/glia.22485. Epub 2013 Mar 18. Glia. 2013. PMID: 23505074
-
AQP4-A25Q Point Mutation in Mice Depolymerizes Orthogonal Arrays of Particles and Decreases Polarized Expression of AQP4 Protein in Astrocytic Endfeet at the Blood-Brain Barrier.J Neurosci. 2022 Oct 26;42(43):8169-8183. doi: 10.1523/JNEUROSCI.0401-22.2022. Epub 2022 Sep 13. J Neurosci. 2022. PMID: 36100398 Free PMC article.
-
Structure and functions of aquaporin-4-based orthogonal arrays of particles.Int Rev Cell Mol Biol. 2011;287:1-41. doi: 10.1016/B978-0-12-386043-9.00001-3. Int Rev Cell Mol Biol. 2011. PMID: 21414585 Review.
Cited by
-
Plectin plays a role in the migration and volume regulation of astrocytes: a potential biomarker of glioblastoma.J Biomed Sci. 2024 Jan 23;31(1):14. doi: 10.1186/s12929-024-01002-z. J Biomed Sci. 2024. PMID: 38263015 Free PMC article.
-
Novel therapeutic modulators of astrocytes for hydrocephalus.Front Mol Neurosci. 2022 Sep 26;15:932955. doi: 10.3389/fnmol.2022.932955. eCollection 2022. Front Mol Neurosci. 2022. PMID: 36226316 Free PMC article. Review.
-
Astrocytes in Parkinson's Disease: From Role to Possible Intervention.Cells. 2023 Sep 22;12(19):2336. doi: 10.3390/cells12192336. Cells. 2023. PMID: 37830550 Free PMC article. Review.
-
Aquaporin-4 Removal from the Plasma Membrane of Human Müller Cells by AQP4-IgG from Patients with Neuromyelitis Optica Induces Changes in Cell Volume Homeostasis: the First Step of Retinal Injury?Mol Neurobiol. 2021 Oct;58(10):5178-5193. doi: 10.1007/s12035-021-02491-x. Epub 2021 Jul 15. Mol Neurobiol. 2021. PMID: 34263427
-
Astroglial role in the pathophysiology of status epilepticus: an overview.Oncotarget. 2018 Jun 1;9(42):26954-26976. doi: 10.18632/oncotarget.25485. eCollection 2018 Jun 1. Oncotarget. 2018. PMID: 29928494 Free PMC article. Review.
References
-
- Benfenati V, Caprini M, Dovizio M, Mylonakou MN, Ferroni S, Ottersen OP, Amiry-Moghaddam M (2011) An aquaporin-4/transient receptor potential vanilloid 4 (AQP4/TRPV4) complex is essential for cell-volume control in astrocytes. Proc Natl Acad Sci U S A 108:2563–2568. 10.1073/pnas.1012867108 - DOI - PMC - PubMed
Publication types
MeSH terms
Substances
LinkOut - more resources
Full Text Sources
Other Literature Sources