. 2017 Nov 8;37(45):10917-10931.
doi: 10.1523/JNEUROSCI.1005-17.2017. Epub 2017 Oct 4.

Foxp1 in Forebrain Pyramidal Neurons Controls Gene Expression Required for Spatial Learning and Synaptic Plasticity

Affiliations

Foxp1 in Forebrain Pyramidal Neurons Controls Gene Expression Required for Spatial Learning and Synaptic Plasticity

Daniel J Araujo et al. J Neurosci. .

Erratum in

Abstract

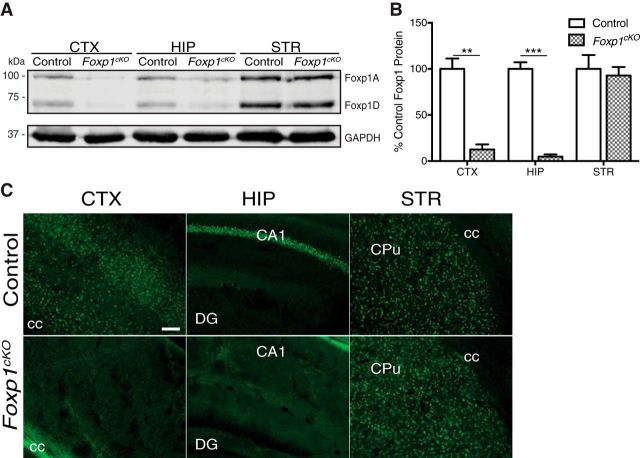
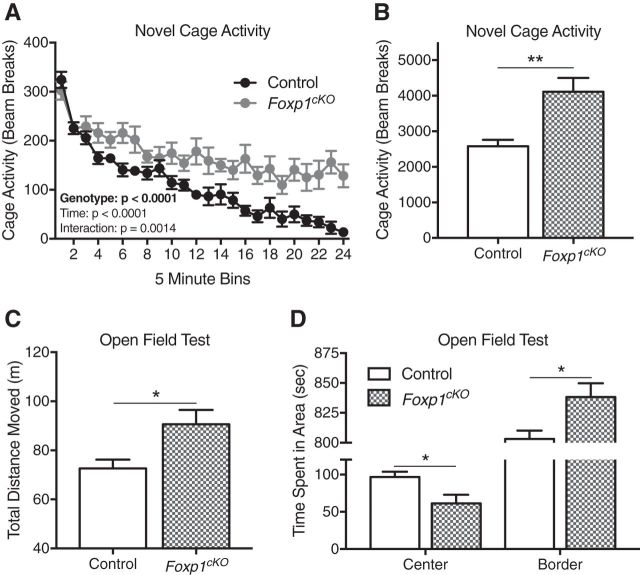
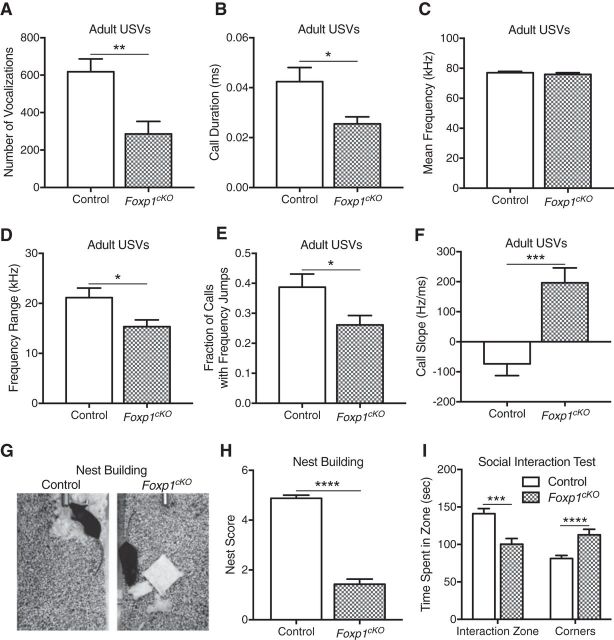
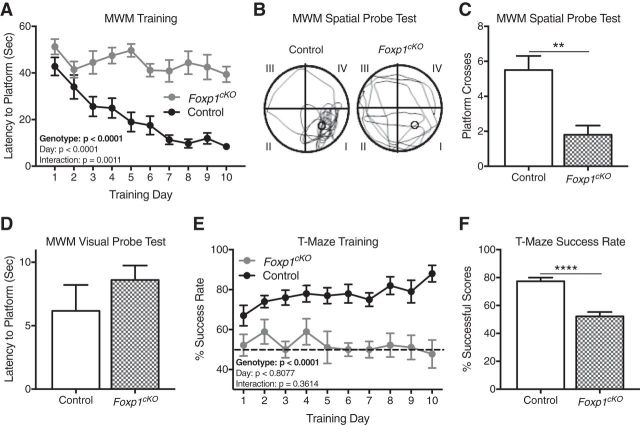
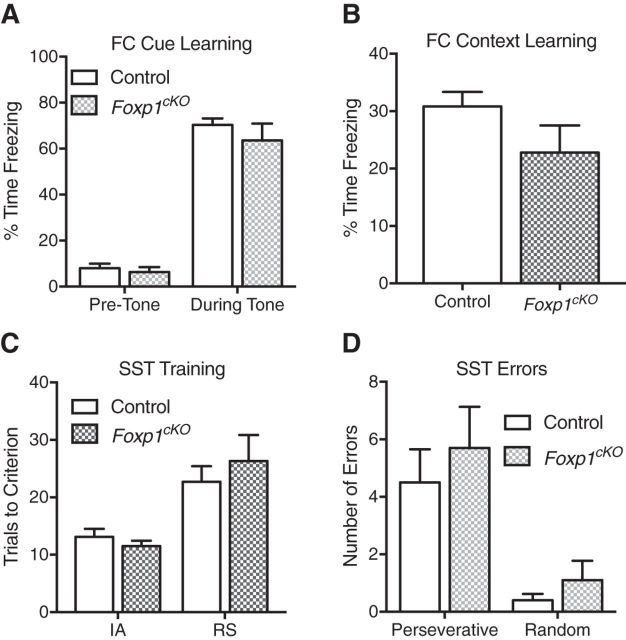
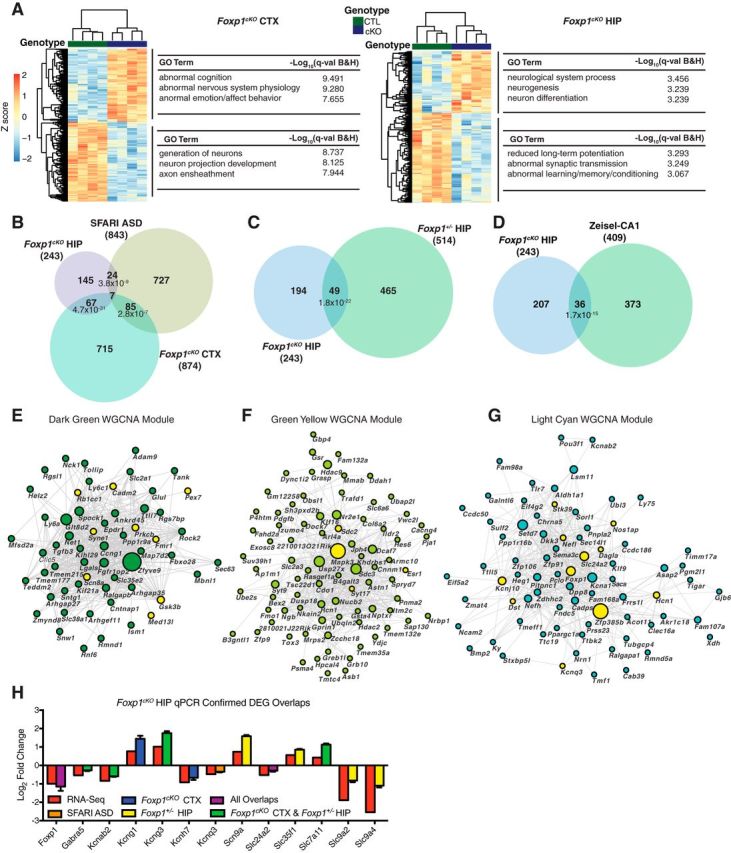
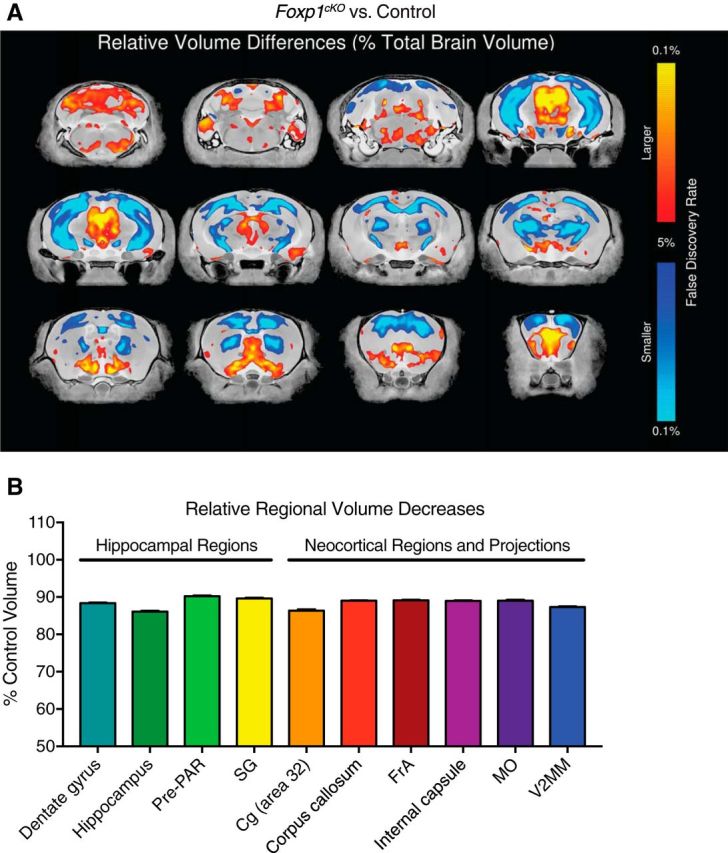
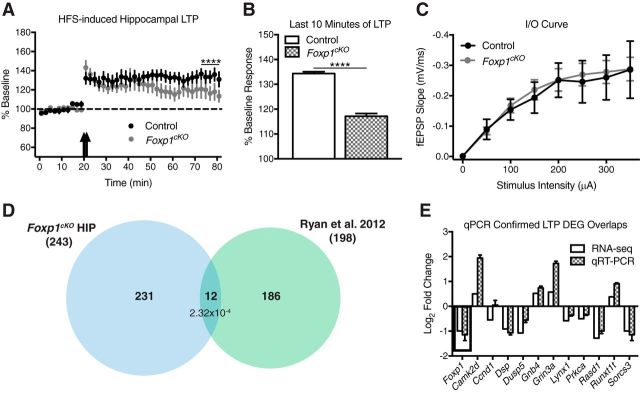
Genetic perturbations of the transcription factor Forkhead Box P1 (FOXP1) are causative for severe forms of autism spectrum disorder that are often comorbid with intellectual disability. Recent work has begun to reveal an important role for FoxP1 in brain development, but the brain-region-specific contributions of Foxp1 to autism and intellectual disability phenotypes have yet to be determined fully. Here, we describe Foxp1 conditional knock-out (Foxp1cKO) male and female mice with loss of Foxp1 in the pyramidal neurons of the neocortex and the CA1/CA2 subfields of the hippocampus. Foxp1cKO mice exhibit behavioral phenotypes that are of potential relevance to autism spectrum disorder, including hyperactivity, increased anxiety, communication impairments, and decreased sociability. In addition, Foxp1cKO mice have gross deficits in learning and memory tasks of relevance to intellectual disability. Using a genome-wide approach, we identified differentially expressed genes in the hippocampus of Foxp1cKO mice associated with synaptic function and development. Furthermore, using magnetic resonance imaging, we uncovered a significant reduction in the volumes of both the entire hippocampus as well as individual hippocampal subfields of Foxp1cKO mice. Finally, we observed reduced maintenance of LTP in area CA1 of the hippocampus in these mutant mice. Together, these data suggest that proper expression of Foxp1 in the pyramidal neurons of the forebrain is important for regulating gene expression pathways that contribute to specific behaviors reminiscent of those seen in autism and intellectual disability. In particular, Foxp1 regulation of gene expression appears to be crucial for normal hippocampal development, CA1 plasticity, and spatial learning.SIGNIFICANCE STATEMENT Loss-of-function mutations in the transcription factor Forkhead Box P1 (FOXP1) lead to autism spectrum disorder and intellectual disability. Understanding the potential brain-region-specific contributions of FOXP1 to disease-relevant phenotypes could be a critical first step in the management of patients with these mutations. Here, we report that Foxp1 conditional knock-out (Foxp1cKO) mice with loss of Foxp1 in the neocortex and hippocampus display autism and intellectual-disability-relevant behaviors. We also show that these phenotypes correlate with changes in both the genomic and physiological profiles of the hippocampus in Foxp1cKO mice. Our work demonstrates that brain-region-specific FOXP1 expression may relate to distinct, clinically relevant phenotypes.

Keywords: autism; gene expression; hippocampus; spatial learning; synaptic plasticity.


Figures

Figure 1.
Figure 1.
Generation of Foxp1cKO mice. A, Representative immunoblot displaying reduced Foxp1 protein levels in the CTX and HIP, but not the STR, of Foxp1cKO mice compared with littermate control mice. GAPDH was used as a loading control. B, Quantification of Foxp1 expression in adult Foxp1cKO mouse brains. Data are represented as means ± SEM. n = 3 control mice; n = 3 Foxp1cKO mice. **p = 0.002; ***p = 0.0002, Student's t test, compared with control levels normalized to GAPDH. C, Representative immunohistochemistry images showing that Foxp1 protein (green) expression is ablated in the projection neurons of the CTX and the CA1/CA2 subfields of the HIP, but preserved in the STR of Foxp1cKO mice. cc, Corpus callosum; DG, dentate gyrus; CPu, caudate/putamen. Scale bars indicate 100 μm.
Figure 2.
Figure 2.
Foxp1cKO mice display hyperactivity and anxiety-like behaviors. A, B, Foxp1cKO mice are hyperactive, as indicated by their increased activity in a novel cage environment. A, Foxp1cKO mice display sustained, increased activity in a novel cage. Data are represented as means ± SEM) n = 9 control mice; n = 7 Foxp1cKO mice. p < 0.0001, two-way ANOVA, compared between genotypes. B, As measured by their average activity over the course of 2 h, Foxp1cKO mice are hyperactive. Data are represented as means ± SEM. n = 9 control mice; n = 7 Foxp1cKO mice. **p = 0.002, Student's t test, compared between genotypes. C, Foxp1cKO mice are hyperactive, as determined by their total distance moved in the open field test. Data are represented as means ± SEM. n = 8 control mice; n = 8 Foxp1cKO mice. *p = 0.02, Student's t test, compared between genotypes. D, Foxp1cKO mice are anxious, as determined by the amount of time they spend in the border of the open-field apparatus. Data are represented as means ± SEM. n = 8 control mice; n = 8 Foxp1cKO mice. *p = 0.02, Student's t test, compared between genotypes.
Figure 3.
Figure 3.
Impaired social communication in Foxp1cKO mice. A, Adult Foxp1cKO male mice produce fewer total numbers of USVs in a mating paradigm. Data are represented as means ± SEM. n = 13 control mice; n = 15 Foxp1cKO mice. **p = 0.0019, Student's t test, compared between genotypes. B, Foxp1cKO mice exhibit a significant reduction in their mean call duration. Data are represented as means ± SEM. n = 13 control mice; n = 14 Foxp1cKO mice. *p = 0.011, Student's t test, compared between genotypes. C, Foxp1cKO mice show no differences in their mean call frequencies. Data are represented as means ± SEM. n = 13 control mice; n = 14 Foxp1cKO mice. p = 0.45, Student's t test, compared between genotypes. D, Adult Foxp1cKO male mice produce USVs with smaller frequency ranges. Data are represented as means ± SEM. n = 13 control mice; n = 14 Foxp1cKO mice. *p = 0.019, Student's t test, compared between genotypes. E, Foxp1cKO mice produce a smaller fraction of USVs with frequency jumps. Data are represented as means ± SEM. n = 13 control mice; n = 15 Foxp1cKO mice. *p = 0.025, Student's t test, compared between genotypes. F, Foxp1cKO mice show a significant difference in the average slope of their USVs. Data are represented as means ± SEM. n = 13 control mice; n = 14 Foxp1cKO mice. ***p = 0.0003, Student's t test, compared between genotypes. G, Representative photographs of the nests produced by littermate control and Foxp1cKO mice. H, Foxp1cKO mice produce nests with low-quality scores. Data are represented as means ± SEM. n = 8 control mice; n = 7 Foxp1cKO mice. ****p < 0.0001, Student's t test, compared between genotypes. I, Foxp1cKO mice are less social than their littermate controls, as determined by the decreased time they spend interacting with a sex-matched conspecific (time in interaction zone). Data are represented as means ± SEM. n = 16 control mice; n = 12 Foxp1cKO mice. **p < 0.01, ***p < 0.001, Student's t test, compared between genotypes.
Figure 4.
Figure 4.
Foxp1cKO mice display impairments in spatial learning. A, Foxp1cKO mice display poor learning via their escape latency in the training phase of the Morris water maze (MWM). Data are represented as means ± SEM. n = 12 control mice; n = 10 Foxp1cKO mice. p < 0.0001, two-way ANOVA, compared between genotypes. B, C, Foxp1cKO show poor memory via the number of platform crosses that they make during the MWM spatial probe. B, Representative trace of swimming paths taken by Foxp1cKO and control littermate mice on a spatial probe day. Roman numerals designate different quadrants. The original location of the hidden platform is indicated by a circle in quadrant I. C, Quantification of the number of platform crosses made by Foxp1cKO and control mice on a spatial probe day. Data are represented as means ± SEM. n = 12 control mice; n = 10 Foxp1cKO mice. **p = 0.002, Student's t test, compared between genotypes. D, Foxp1cKO mice display no difference in their ability to locate a raised platform during a visual probe day in the MWM. Data are represented as means ± SEM. n = 12 control mice; n = 10 Foxp1cKO mice. p = 0.34, Student's t test, compared between genotypes. E, Foxp1cKO mice demonstrate poor learning and memory, as measured by their percentage of successful trials during training in the T-maze. Dashed line represents success based on chance. Data are represented as means ± SEM. n = 10 control mice; n = 9 Foxp1cKO mice. p < 0.0001, two-way ANOVA, compared between genotypes. F, As measured by their average performance during training, Foxp1cKO mice display impaired learning in the T-maze. Data are represented as means ± SEM. n = 10 control mice; n = 10 Foxp1cKO mice. ****p < 0.0001, Student's t test, compared between genotypes. The main effects for genotype and postnatal day and their interactions are presented in A and E.
Figure 5.
Figure 5.
Foxp1cKO mice do not display deficits in generalized learning and memory. A, B, Foxp1cKO mice show no deficiencies in associative fear-memory tasks, as displayed by their performance in both the cue-dependent (A) and context-dependent (B) portions of a fear conditioning (FC) paradigm. Data are represented as means ± SEM. n = 16 control mice; n = 12 Foxp1cKO mice. p = 0.27, two-way ANOVA compared between genotypes (A), p = 0.12, Student's t test compared between genotypes (B). C, D, Foxp1cKO show no deficits in cognitive flexibility, as measured by the number of trials that they needed to reach criterion during both the initial association (IA) or the rule-shift (RS) portion of training for the set-shifting task (SST) (C) or the number of perseverative (Pers) or random (Rand) errors that they made in the RS portion of the SST (D). Data are represented as means ± SEM. n = 10 control; n = 9 Foxp1cKO mice. p = 0.65 (C) and p = 0.43 (D), two-way ANOVA, compared between genotypes.
Figure 6.
Figure 6.
Altered transcriptional programs in Foxp1cKO brains. A, Heat map showing that, based on the DEGs of either region, the CTX or HIP, segregate by genotype: Foxp1cKO (cKO) and control (CTL). Color indicates a Z score from −2 to 2 for each gene. Significantly enriched GO terms (https://toppgene.cchmc.org; GO enrichment is the negative log of a Benjamini–Hochberg-corrected p-value, q-value) associated with groups of genes are highlighted next to their respective DEG clusters. Representative GO categories for both the Foxp1cKO neocortex and hippocampus can be found in Figure 6-1. B, Significant overlaps between DEGs in Foxp1cKO mouse CTX and HIP and ASD-associated genes (SFARI-ASD genes; https://sfari.org/resources/sfari-gene). A total of 92 genes overlapped between Foxp1cKO CTX and SFARI-ASD genes (p = 2.8 × 10⁻⁷; hypergeometric test) and 31 genes overlapped between Foxp1cKO HIP and SFARI-ASD genes (p = 3.8 × 10⁻⁹; hypergeometric test). C, Significant overlaps between Foxp1cKO HIP DEGs and heterozygous Foxp1 knock-out (Foxp1+/−) HIP DEGs (Araujo et al., 2015). The Foxp1+/− HIP dataset was filtered using the same cutoffs for identifying DEGs (an adjusted p-value of ≤0.005 and an absolute log fold change of ≥0.3) that were applied to the Foxp1cKO datasets. A total of 49 genes overlapped between Foxp1+/− HIP and Foxp1cKO HIP (p = 1.8 × 10⁻²²; hypergeometric test). D, Significant overlaps between Foxp1cKO HIP DEGs and CA1 pyramidal neuron single-cell sequencing data (Zeisel et al., 2015). A total of 36 genes overlapped between Foxp1cKO HIP and Zeisel CA1 data (p = 1.7 × 10⁻¹⁵; hypergeometric test). The enrichment of DEGs in other single-cell categories are in Figure 6-2 (available at 10.1523/JNEUROSCI.1005-17.2017.f6-2). Visualization of the top 500 connections in the hippocampus-specific dark green module (E), the green yellow module (F), and the light cyan module (G). ASD-SFARI genes are highlighted in yellow. H, Confirmation of salient gene targets in independent Foxp1cKO hippocampal samples using qPCR. Red bars indicate RNA-seq-based log2-fold changes in expression. Colored bars represent the category of gene (SFARI-ASD and/or Foxp1cKO neocortex and/or Foxp1+/− hippocampus) that these Foxp1cKO hippocampal DEGs overlap with. Data are represented as means ± SEM. n = 3 control mice; n = 3 Foxp1cKO mice. All qPCR values are significant at p < 0.05 (Student's t test, compared with control levels, normalized to β-actin).
Figure 7.
Figure 7.
Altered regional brain volumes in Foxp1cKO mice. A, Fly-through of representative coronal slices of the Foxp1cKO brain highlighting average relative differences in regions with larger (red) or smaller (blue) volumes. B, Representation of the average relative volume decreases in several of the most significantly (in terms of percentage decreases from control 100% levels) affected hippocampal and neocortical areas in the Foxp1cKO mouse brain. Dashed line represents control levels. Data are represented as means ± SEM. All values are significant at p < 0.05, Student's t test, and FDR < 0.05. Cg, Cingulate cortex; FrA, frontal association cortex; MO, medial orbital cortex; Pre-PAR, pre-para subiculum; V2MM, secondary visual cortex mediomedial area. The top 20 increases and decreases in relative regional brain volumes (in terms of percentage difference from control volumes) are in Figure 7-1 (available at 10.1523/JNEUROSCI.1005-17.2017.f7-1).
Figure 8.
Figure 8.
Altered hippocampal synaptic plasticity in Foxp1cKO mice. A, B, In response to high-frequency stimulation (HFS), there is no difference in the initial magnitude of LTP in Foxp1cKO CA1 neurons (A), but there is a difference in the LTP response during the last 10 min of stimulation (B). Data are represented as means ± SEM. n = 15 control recordings; n = 20 Foxp1cKO recordings, Student's t test, compared between genotypes. C, Basal synaptic transmission is unchanged between Foxp1cKO and littermate control mice as measured by input/output curves comparing stimulus intensity to fEPSP slope in CA1 pyramidal neurons. Data are represented as means ± SEM. n = 15 control recordings; n = 19 Foxp1cKO recordings. p = 0.63, two-way ANOVA, compared between genotypes. D, Significant overlaps between Foxp1cKO HIP DEGs and LTP maintenance DEGs (Ryan et al., 2012). A total of 12 genes overlapped between the Foxp1cKO HIP and LTP maintenance datasets (p = 2.32 × 10⁻⁴; hypergeometric test). E, Confirmation of genes that overlapped between the Foxp1cKO hippocampal dataset and LTP maintenance genes in independent Foxp1cKO hippocampal samples using qPCR. Box insert highlights Foxp1. With the exception of Ccnd1, Dusp5, and Sorcs3, all qPCR values are significant at p < 0.05 (Student's t test, compared with control levels, normalized to β-actin). Data are represented as means ± SEM. n = 3 control mice; n = 3 Foxp1cKO mice.

References

    1. Ageranioti-Bélanger S, Brunet S, D'Anjou G, Tellier G, Boivin J, Gauthier M (2012) Behaviour disorders in children with an intellectual disability. Paediatr Child Health 17:84–88. 10.1093/pch/17.2.84 - DOI - PMC - PubMed
    1. Anders S, Huber W (2010) Differential expression analysis for sequence count data. Genome Biol 11:R106. 10.1186/gb-2010-11-10-r106 - DOI - PMC - PubMed
    1. Anders S, Pyl PT, Huber W (2015) HTSeq–a Python framework to work with high-throughput sequencing data. Bioinformatics 31:166–169. 10.1093/bioinformatics/btu638 - DOI - PMC - PubMed
    1. Andrews S. (2010) FastQC: a quality control tool for high throughput sequence data. Available at: http://www.bioinformatics.babraham.ac.uk/projects/fastqc.
    1. Araujo DJ, Anderson AG, Berto S, Runnels W, Harper M, Ammanuel S, Rieger MA, Huang HC, Rajkovich K, Loerwald KW, Dekker JD, Tucker HO, Dougherty JD, Gibson JR, Konopka G (2015) FoxP1 orchestration of ASD-relevant signaling pathways in the striatum. Genes Dev 29:2081–2096. 10.1101/gad.267989.115 - DOI - PMC - PubMed

MeSH terms

Substances