

Sterol transfer, PI4P consumption, and control of membrane lipid order by endogenous OSBP
- PMID: 28978670
- PMCID: PMC5666618
- DOI: 10.15252/embj.201796687
Sterol transfer, PI4P consumption, and control of membrane lipid order by endogenous OSBP
Abstract
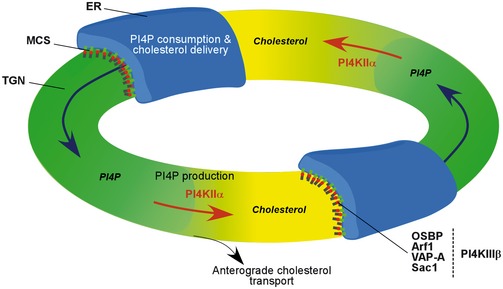
The network of proteins that orchestrate the distribution of cholesterol among cellular organelles is not fully characterized. We previously proposed that oxysterol-binding protein (OSBP) drives cholesterol/PI4P exchange at contact sites between the endoplasmic reticulum (ER) and the trans-Golgi network (TGN). Using the inhibitor OSW-1, we report here that the sole activity of endogenous OSBP makes a major contribution to cholesterol distribution, lipid order, and PI4P turnover in living cells. Blocking OSBP causes accumulation of sterols at ER/lipid droplets at the expense of TGN, thereby reducing the gradient of lipid order along the secretory pathway. OSBP consumes about half of the total cellular pool of PI4P, a consumption that depends on the amount of cholesterol to be transported. Inhibiting the spatially restricted PI4-kinase PI4KIIIβ triggers large periodic traveling waves of PI4P across the TGN These waves are cadenced by long-range PI4P production by PI4KIIα and PI4P consumption by OSBP Collectively, these data indicate a massive spatiotemporal coupling between cholesterol transport and PI4P turnover via OSBP and PI4-kinases to control the lipid composition of subcellular membranes.
Keywords: Golgi apparatus; cholesterol; lipid‐transfer protein; membrane contact site; phosphatidylinositol 4‐phosphate.
© 2017 The Authors.
Figures
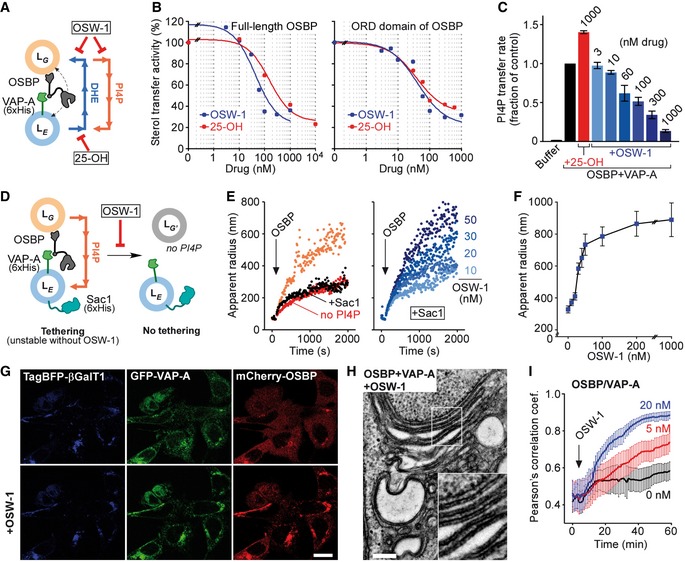
Experimental strategy for lipid exchange assays.
Inhibitory effect of OSW‐1 and 25‐OH on DHE transfer mediated by full‐length OSBP (0.1 μM; left panel) or by its ORD domain alone (0.1 μM; right panel). Liposomes mimicking the ER (LE) and the Golgi (LG; 63 μM lipids each) contained 18% DHE and 2.5% Dansyl‐PE, respectively. VAP‐A‐His was used at 1 μM. Data show the percent of maximal transfer activity obtained without drug.
Effect of OSW‐1 and 25‐OH on OSBP‐mediated PI4P transfer. LG contained 2 mol% PI4P and LE contained 2 mol% cholesterol (300 μM total lipids each). VAP‐A‐His was used at 3 μM. OSW‐1 gradually inhibited PI4P transfer whereas 25‐OH slightly stimulated PI4P transfer. See also Appendix Fig S1A and B. Data are mean ± SEM (n = 3).
Experimental strategy for liposome aggregation measurements. OSW‐1 stabilizes liposome tethering in the presence of Sac1.
Aggregation of LE and LG liposomes by OSBP as followed by DLS. The cuvette contained LE and LG liposomes (25 μM lipids each). LE had 2 mol% DGS‐NTA(Ni) and was decorated with VAP‐A‐His (0.2 μM) and Sac1‐His (10 nM) when indicated. LG contained 2 mol% PI4P otherwise indicated. When indicated, OSBP (0.2 μM) was added and promoted liposome aggregation. The presence of Sac1‐His diminished the growth of liposome aggregates (left panel). OSW‐1 antagonized the Sac1 effect in a dose‐dependent manner (right panel).
Size of liposome aggregates obtained from 10 autocorrelation curves after the reactions. Error bars represent SD.
HeLa cells coexpressing TagBFP‐βGalT1, GFP‐VAP‐A, and mCherry‐OSBP. βGalT1 labels the TGN and VAP‐A the ER network, whereas OSBP is mostly cytosolic (top). Upon OSW‐1 treatment (20 nM, for 1 h at 37°C), OSBP and VAP‐A concentrate to a perinuclear region (bottom). Scale bar: 20 μm. See also Movie EV1.
Thin‐section EM of cells expressing GFP‐VAP‐A and mCherry‐OSBP and treated with OSW‐1. Scale bar: 250 nm.
Evolution of the Pearson's correlation coefficient between mCherry‐OSBP and GFP‐VAP‐A over time. When indicated, OSW‐1 (5 or 20 nM final concentration) was added to the medium. DMSO was added in control experiment (0 nM). Data represent mean ± SEM (error bars; n = 4).
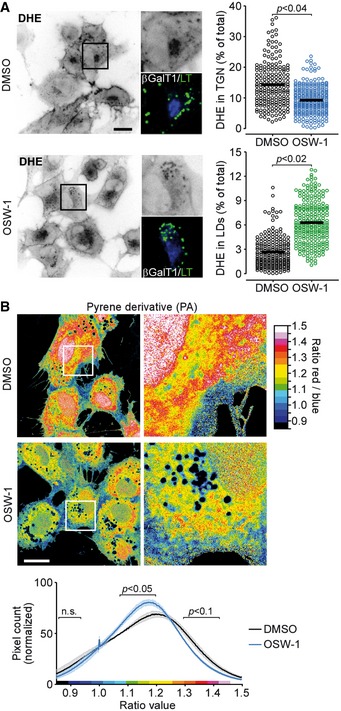
OSW‐1 affects intracellular DHE distribution. Widefield images of RPE‐1 cells transfected with TagBFP‐βGalT1 for 18 h. Cells were pulse‐chased with DHE and incubated with OSW‐1 (20 nM) for 2 h at 37°C, or DMSO (1%) as a control. Cells were labeled with the lipid droplet marker LipidTOX Green (LT) 15 min prior imaging. Note the hazy distribution of DHE, as well as its increased co‐localization with lipid droplets, in OSW‐1‐treated cells. Scale bar: 20 μm. Right panels show the amount of DHE present in the perinuclear region (top) or in lipid droplets (bottom) from DMSO (190 cells) and OSW‐1‐treated cells (240 cells), from two independent experiments. Each point represents the signal from a single cell with the mean fluorescence indicated by the black lines. Student's t‐test P‐values are shown.
Ratio imaging of RPE‐1 cells stained with 100 nM of PA. Scale bar: 20 μm. The pseudo‐colors represent the long (550–700 nm) to short (470–550 nm) emission wavelength ratio upon excitation at 405 nm, according to the scale shown on the right. The bottom panel represents the pixel distribution of the ratio (or tonal) value from cells treated with OSW1 or control cells. Data represent means ± SEM (error bars; n = 3). Student's t‐test P‐values are shown over the indicated ranges to compare OSW1 and DMSO‐treated cells.
- A
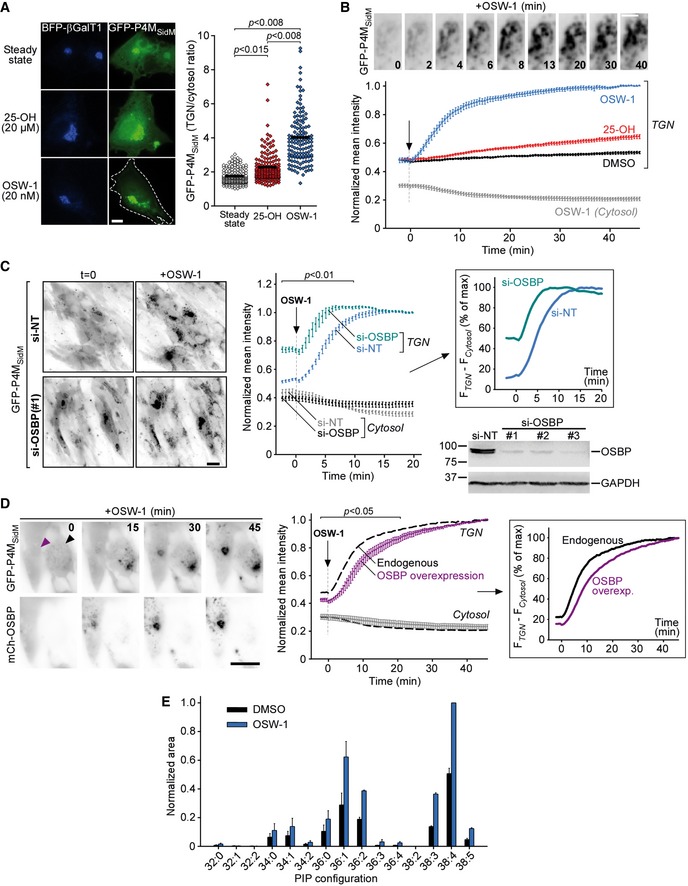
Epifluorescence images of RPE‐1 cells co‐transfected with TagBFP‐βGalT1 and the PI4P probe GFP‐P4MSidM for 18 h. When indicated, cells were incubated with 25‐OH (20 μM) or OSW‐1 (20 nM) during 45 min, washed, and fixed with PFA (3%) before imaging. Scale bar: 20 μm. In the graph showing the TGN/cytosol ratio of GFP‐P4MSidM, each point represents a single cell measurement (135–150 cells per condition, three independent experiments). The dim cytosol area of OSW‐1‐treated cell is demarcated by a white dashed line. Horizontal lines on the graph indicate the mean values. Student's t‐test P‐values are shown.
- B
Time‐lapse microscopy of RPE‐1 cells co‐transfected with TagBFP‐βGalT1 and the PI4P probe GFP‐P4MSidM for 18 h and treated with OSW‐1 (20 nM) as indicated. Top: individual frames from a movie of GFP‐P4MSidM (Movie EV2) featuring the TGN region. An inverted grayscale table was used, and fluorescence is shown in black. Scale bar: 5 μm. Bottom: time course of GFP‐P4MSidM at the TGN (defined by the βGalT1 mask) or in the cytosol (gray curve). The arrow indicates drug addition into the cell medium (t = 0). Data are means ± SEM of four to eight independent experiments.
- C, D
Same as in (B) with RPE‐1 cells stably expressing GFP‐P4MSidM and either treated for 72 h with siRNA against OSBP (C) or overexpressing (24 h) mCherry‐OSBP (D). Left: individual frames from time series. Scale bar: 20 μm. Central graphs: normalized intensity of GFP‐P4MSidM at the TGN (colored curves) and in the cytosol (gray); mean of four independent experiments ± SEM. Student's t‐test P‐values are shown. Right graphs: the specific GFP‐P4MSidM level at the TGN was obtained by subtracting the cytosol value from the TGN value. Panel (C) also shows a Western blot of the expression level of endogenous OSBP under the various conditions. In (D), the purple and black arrowheads indicate cells transfected or not with mCherry‐OSBP, respectively. The dotted lines report the curves of panel (B) obtained on control cells.
- E
Quantification of PIP species by LC‐MS/MS of RPE‐1 cells subjected to OSW‐1 (20 nM) treatment during 30 min at 37°C, or DMSO as a control. The relative peak areas are normalized to the highest one. Data represent means ± SEM (error bars; n = 3).
- A, B
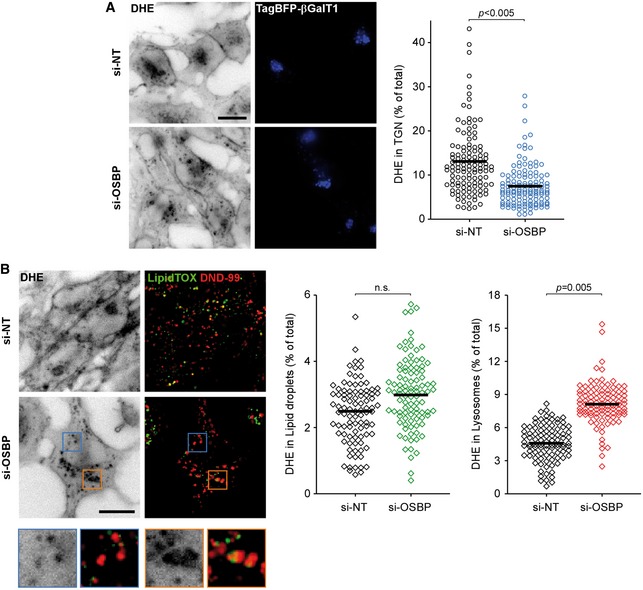
RPE1 cells transfected for 72 h with siRNA against OSBP or control siRNA (si‐NT) were subsequently pulse‐chased for 2 h at 37°C with DHE and analyzed as in Fig 2A for the amount of DHE in the TGN region as identified by the marker TagBFP‐βGalT1 (A), in lipid droplets (LipidTOX; B), or in late endosomal compartments (DND‐99; B). Scale bars: 20 μm. Each point represents the signal from a single cell structure in (A) and from a single field of cells in (B). All data are from three independent experiments and the means are shown. P‐values from Student's t‐test are quoted on the graphs.
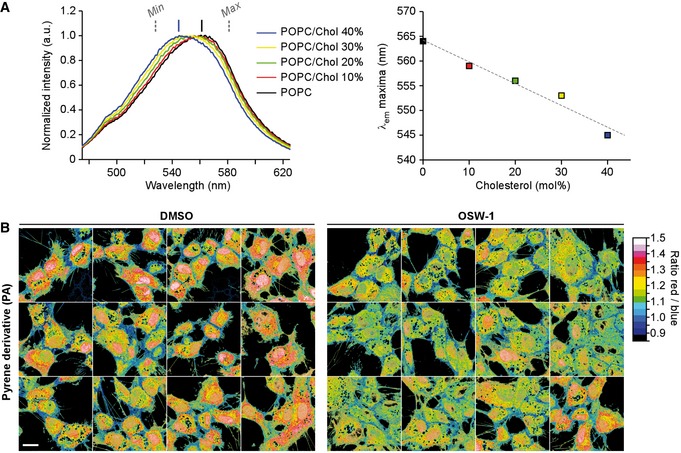
Fluorescence properties of PA (1 μM) added to POPC liposomes (200 μM) containing increasing amount of cholesterol. Excitation: 430 nm. Left: emission spectra. Right: plot of the maximum emission wavelength as a function of cholesterol concentration. For comparison, the dashed vertical lines on the spectrum panel indicate the extreme emission wavelength of PA on highly ordered (sphingomyelin + cholesterol liposomes) and highly disordered membrane (C18:1‐C18:1 PC) as previously reported (Niko et al, 2016). The solid vertical lines indicate the range of PA emission under our experimental conditions (POPC liposomes ± cholesterol).
Gallery of ratiometric images of RPE‐1 labeled with the lipid order probe PA after incubation with DMSO (1%) or OSW‐1 (20 nM) for 90 min at 37°C. Scale bar: 20 μm.
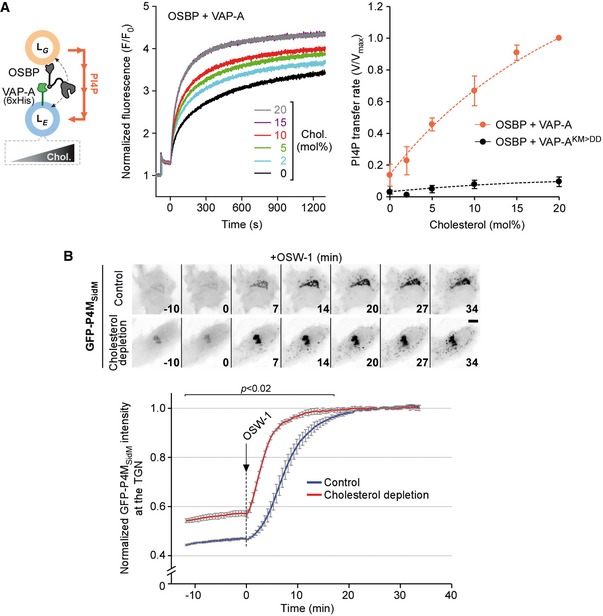
Real‐time PI4P transfer assay. Left panel: schematic. Middle panel: NBD‐PHFAPP1 was mixed with LG (300 μM lipids + 2 mol% PI4P + 2.5 mol% rhodamine‐PE) and VAP‐A (3 μM) followed by the addition of LE with increasing amounts of cholesterol [300 μM total lipids; 2% DGS‐NTA(Ni)]. At t = 0, OSBP (0.1 μM) was added to start the transfer reaction. Right panel: Dose–response curve for the effect of cholesterol concentration in liposomes LE on the PI4P transfer rate. The VAP‐AKM>DD mutant deficient in FFAT motif binding does not support PI4P transfer catalyzed by OSBP. Data represent means ± SEM (error bars; n = 3).
RPE‐1 cells stably expressing GFP‐P4MSidM were cultured in normal growth medium or in cholesterol depletion condition. In this case, cells were cultured overnight in medium supplemented with 1% lipoprotein‐deprived serum. Thereafter, lovastatin (10 μM) was added for 2 h to block cholesterol biosynthesis. Top: the enrichment of P4MSidM at the perinuclear region before and after OSW‐1 addition (20 nM) was monitored by time‐lapse microscopy. Bottom: time course of GFP‐P4MSidM at the TGN. The response to OSW‐1 was reduced at low cholesterol, suggesting less PI4P consumption under this condition. Graphs are from three independent experiments and are means ± SEM. Student's t‐test P‐value is shown over the indicated range to compare control and cholesterol‐depleted cells.
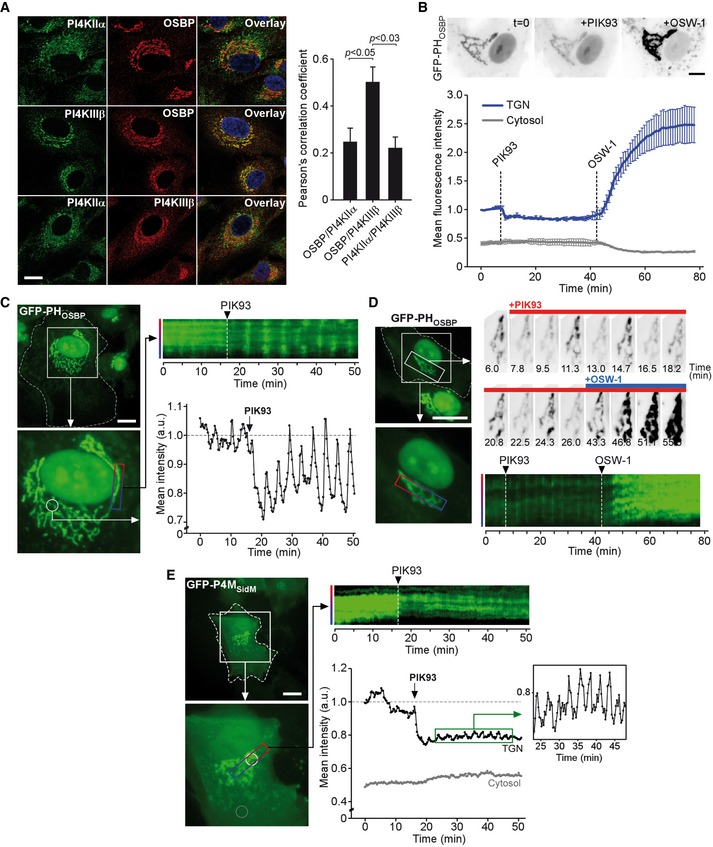
RPE‐1 cells were cultured on μ‐Dish35 mm coverslips for 24 h. Cells were fixed, permeabilized, and processed for immunofluorescence to assess the localization of endogenous OSBP, PI4KIIα, and PI4KIIIβ. Primary antibody against OSBP and PI4KIIIβ was used in conjunction with appropriate Alexa Fluor‐conjugated secondary antibodies. Antibody against PI4KIIα was FITC‐conjugated. Hoechst was used to label the nucleus. Confocal microscopy images are single optical sections. Scale bar: 20 μm. Co‐localization measurements (right panel) are means ± SEM (30–60 cells were analyzed from three independent experiments). Student's t‐test P‐values are shown.
Widefield time‐lapse imaging of RPE‐1 cells stably expressing GFP‐PHOSBP and sequentially treated with the PI4KIIIβ inhibitor PIK93 (500 nM) and OSW‐1 (20 nM). Top: snapshots of a cell taken at t = 0, t = 15 min (+PIK93) and t = 75 min (+OSW‐1). An inverted grayscale lookup table was used, and fluorescence is shown in black. Scale bar: 10 μm. Bottom: normalized fluorescence intensity of GFP‐PHOSBP at the TGN or in the cytosol (gray curve) over time upon drug addition into the medium. Data represent means ± SEM from 30 cells and two independent experiments.
Traveling waves of GFP‐PHOSBP at the TGN upon PIK93 addition. Left: widefield image from a time series of a cell expressing GFP‐PHOSBP upon PIK93 addition (Movie EV4). Scale bar: 20 μm. Top right: kymograph taken from the rectangular TGN region (ca. 20 × 3 μm; see cell image). Bottom right: normalized mean fluorescence intensity of GFP‐PHOSBP from a circular region of the TGN (50 μm2) over time.
OSW‐1 interrupts GFP‐PHOSBP traveling waves. Time series of RPE‐1 expressing GFP‐PHOSBP upon the sequential addition of PIK93 (500 nM) and OSW‐1 (20 nM). The top right panel shows individual frames featuring the TGN region (inverted grayscale). The bottom right panel shows a kymograph from the same TGN. Scale bar: 20 μm.
Traveling waves of GFP‐P4MSidM at the TGN upon PIK93 addition. Left: widefield image from a time series of a cell expressing GFP‐P4MSidM upon PIK93 addition. Scale bar: 20 μm. Top right: kymograph. Bottom right: normalized mean fluorescence intensity of GFP‐P4MSidM from a circular region of the TGN (white circle) or the cytosol (gray circle) over time.
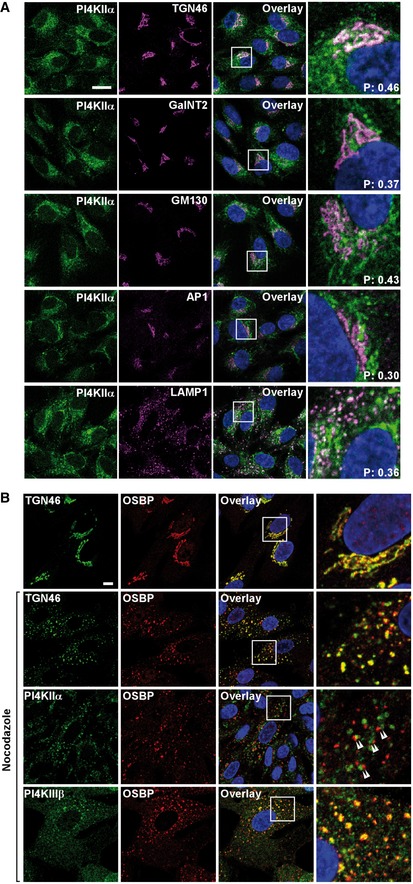
RPE‐1 cells were cultured on μ‐Dish35 mm coverslips for 24 h. Cells were fixed, permeabilized, and processed for immunofluorescence to assess the co‐localization of endogenous PI4KIIα with other markers of the Golgi apparatus: TGN46 (TGN); GalNT2 (medial/trans Golgi); GM130 (cis Golgi); AP1 (trans Golgi), or late endosomes (LAMP1). Pearson correlation coefficients (P) are quoted in the images. Scale bar: 20 μm.
RPE‐1 cells were cultured as in (A) and, when indicated, subsequently treated with nocodazole (2.5 μg/ml) for 90 min at 37°C. Thereafter, cells were fixed, permeabilized, and processed for immunofluorescence. OSBP fairly co‐localized with PI4KIIIβ in nocodazole‐induced Golgi mini‐stacks. In contrast, PI4KIIα‐ and OSBP‐positive spots were not co‐localized but, interestingly, were almost systematically juxtaposed (white arrows). Scale bar: 10 μm.
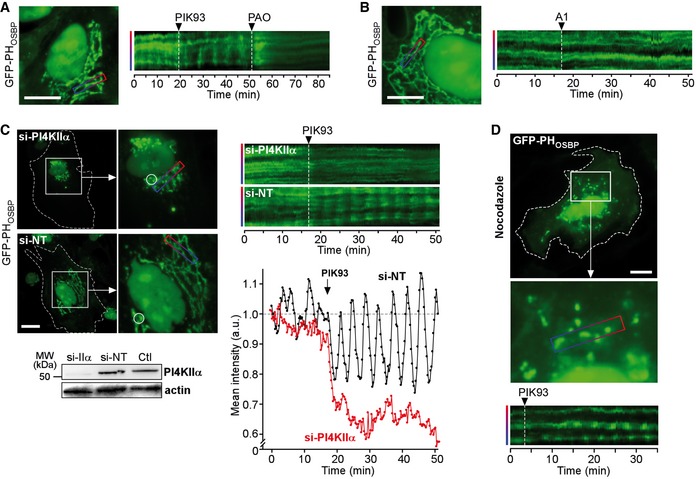
- A, B
RPE‐1 cells stably expressing GFP‐PHOSBP were imaged and analyzed as in Fig 5C. Scale bar: 20 μm. When indicated, PIK93 (500 nM), PAO (10 μM) or the PI4KIIIα inhibitor A1 (100 nM) was added into the cell medium.
- C
Cells were treated with siRNA against PI4KIIα (si‐IIα) or with control siRNA (si‐NT). After 24 h, the cells were imaged as in Fig 5C. PI4KIIα silencing abolishes PIK93‐induced GFP‐PHOSBP oscillations. Scale bar: 20 μm. Western blot shows the expression level of endogenous PI4KIIα under the various conditions.
- D
RPE‐1 cells stably expressing GFP‐PHOSBP were first treated with nocodazole (2.5 μg/ml) for 90 min at 37°C, and then imaged and analyzed as in Fig 5C. Scale bar: 20 μm. When indicated, PIK93 (500 nM) was added into the cell medium.
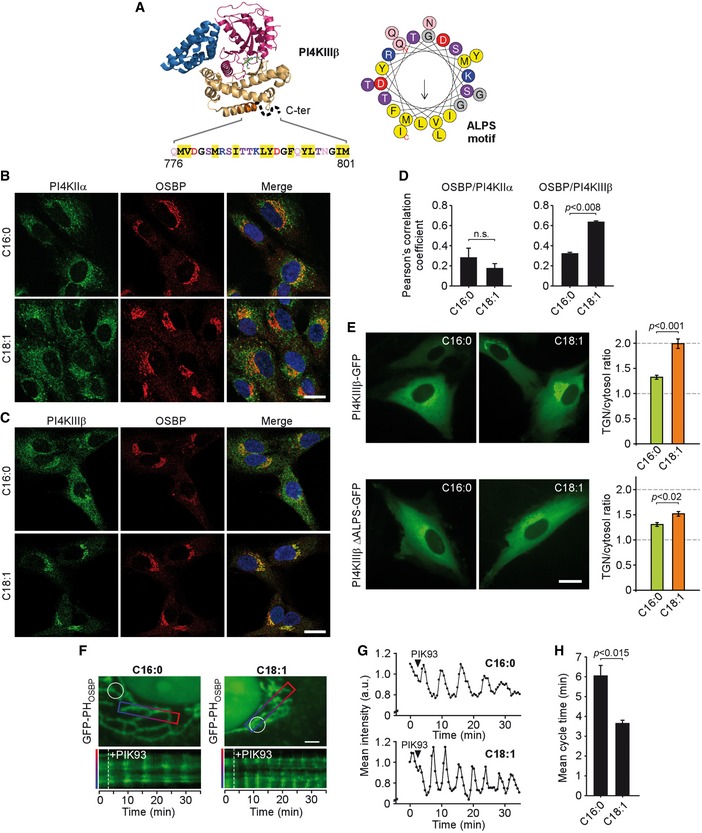
- A
Structure of human PI4KIIIβ in complex with PIK93 (PDB accession number: 4DOL) with the N‐terminal helical domain colored blue, the two C‐terminal lobes of the kinase domain colored purple and beige, and PIK93 colored green. The position of the amphipathic lipid‐packing sensor (ALPS) is shown as well as its sequence and helical wheel representation.
- B, C
RPE‐1 were plated on coverslips and cultured overnight in medium without serum. Thereafter, the starved cells were incubated for 3 h in the presence of the indicated BSA–fatty acid complex (25 μM BSA + 125 μM fatty acid) and then fixed. Cells were subsequently processed for immunofluorescence and observed as in Fig 5A. Scale bars: 20 μm. Note the partial dissociation of endogenous PI4KIIIβ from the Golgi upon C16:0 diet.
- D
Co‐localization analysis of OSBP with PI4KIIα and PI4KIIIβ. The mean values of the Pearson's correlation coefficient from 30 to 40 cells from two independent experiments and the SEM are shown.
- E
RPE‐1 cells transfected with PI4KIIIβ‐GFP or a PI4KIIIβ mutant lacking the ALPS motif were starved overnight and incubated with BSA–fatty acid complex for 3 h before imaging. Measurements of the TGN/cytosol ratio (right panels) are means ± SEM from 4 to 5 independent experiments. Scale bar: 10 μm.
- F
RPE‐1 cells stably expressing GFP‐PHOSBP were starved overnight. Thereafter, cells were subjected to a 3‐h diet with C16:0 or C18:1 fatty acids in complex with BSA, as indicated, and then imaged by time‐lapse fluorescence microscopy upon PIK93 (500 nM) addition (Movie EV6). Scale bar: 5 μm.
- G
The graphs show the normalized mean fluorescence intensity of GFP‐PHOSBP from regions of the TGN indicated by white circles in panel (F) over the time course.
- H
Quantification of the GFP‐PHOSBP oscillation period at the TGN as a function of fatty acid treatment. Data represent means ± SEM (18 cells were analyzed for each condition and from four independent experiments).
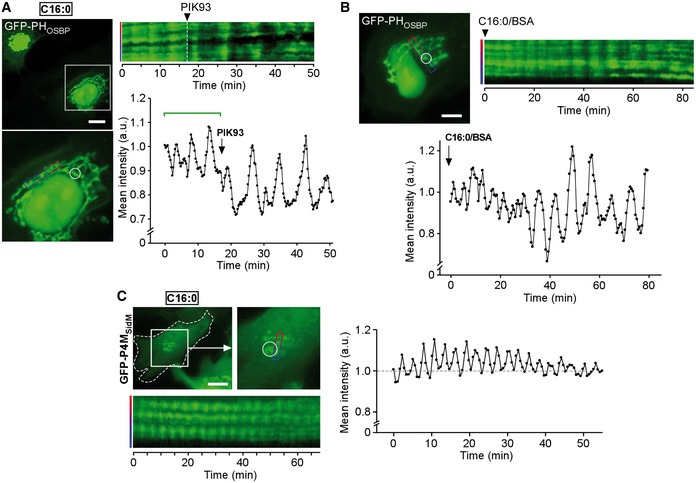
RPE‐1 cells stably expressing GFP‐PHOSBP were cultured overnight in medium without serum. Thereafter, the starved cells were incubated for 3 h in the presence of C16:0/BSA complex (25 μM BSA + 125 μM C16:0) and imaged by time‐lapse fluorescence microscopy at 17 s intervals. Kymographs and mean intensity measurements were carried out from regions of the TGN as indicated in the left panels. When indicated, PIK93 (500 nM) was added into the cell medium. Note that oscillations were present before PIK93 treatment (square green bracket).
RPE‐1 cells stably expressing GFP‐PHOSBP were placed in phenol red‐free DMEM/F12 + HEPES supplemented with 125 μM C16:0 in complex with 25 μM BSA and immediately imaged by time‐lapse acquisitions. Traveling waves appeared after ˜30 min of treatment with C16:0/BSA complex.
RPE‐1 cells stably expressing GFP‐P4MSidM were treated and imaged as in (A). Oscillations of low amplitude could be detected from the TGN region.
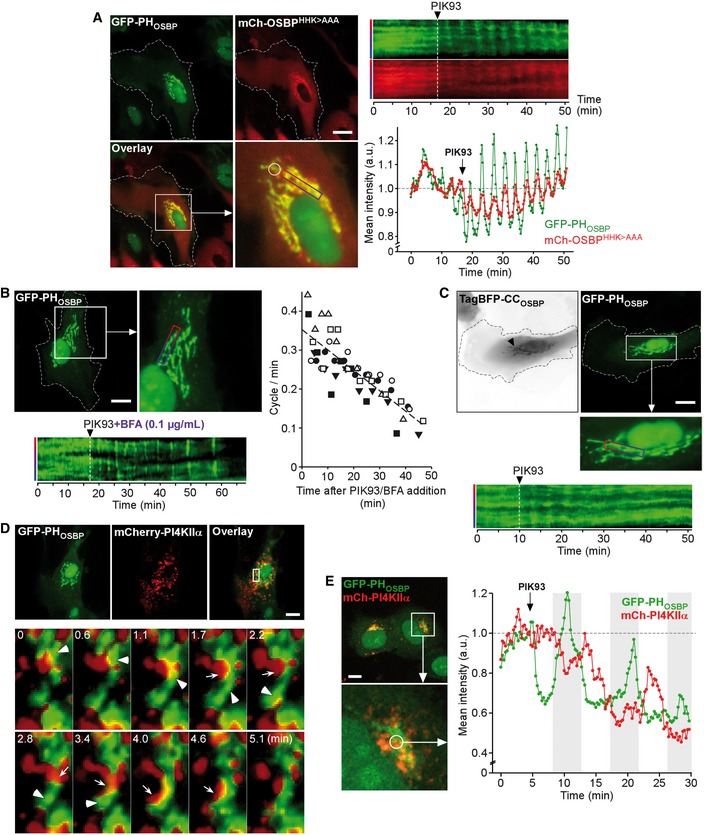
RPE‐1 cells stably expressing GFP‐PHOSBP were transfected with mCherry‐OSBPHHK>AAA for 24 h before imaging. The signal from both fluorescent proteins was monitored by time‐lapse microscopy. Left: images of a representative cell at time zero of the time series. Scale bar: 20 μm. Right: when indicated, PIK93 (500 nM) was added into the cell medium and the fluorescence of GFP‐PHOSBP and mCherry‐OSBPHHK>AAA was followed over time. Kymographs were constructed from a rectangular TGN region; graphs were constructed from a circular TGN region (see overlay image).
RPE‐1 cells stably expressing GFP‐PHOSBP were subjected to PIK93 (500 nM) and BFA (0.1 μg/ml) combined treatment in a time series, as indicated in the kymograph in the bottom panel. Scale bar: 20 μm. Right panel: GFP‐PHOSBP oscillation rate at the TGN over time upon PIK93/BFA addition. Values were determined from 6 time series, each indicated by a different symbol.
RPE‐1 cells stably expressing GFP‐PHOSBP were transfected with TagBFP‐CCOSBP (inverted grayscale) and imaged by time‐lapse microscopy as before. Scale bar: 20 μm. An enrichment of TagBFP‐CCOSBP at GFP‐PHOSBP‐positive perinuclear regions is noticeable (arrowhead). PIK93 (500 nM) was added as indicated in the kymograph in the bottom panel. The presence of TagBFP‐CCOSBP made the GFP‐PHOSBP traveling waves less regular.
RPE‐1 cells stably expressing GFP‐PHOSBP were transfected with mCherry‐PI4KIIa for 18 h. Thereafter the signal from both proteins was monitored by time‐lapse microscopy. Scale bar: 20 μm. Bottom: Individual frames from a movie (Movie EV8) featuring the perinuclear region upon PIK93 addition (500 nM). The arrows and arrowheads mark regions labeled with the green and red constructs, respectively, that undergo co‐ordinated movements.
HeLa cells stably expressing GFP‐PHOSBP were transfected with mCherry‐PI4KIIα for 18 h before imaging. Left: Spinning disk confocal image from a time series upon PIK93 addition (500 nM). Scale bar: 20 μm. Right: normalized mean fluorescence intensity of GFP‐PHOSBP and mCherry‐PI4KIIα from a circular region of the TGN over time.
Similar articles
-
[A lipid exchange market : vectorial cholesterol transport by the protein OSBP].Med Sci (Paris). 2020 Feb;36(2):130-136. doi: 10.1051/medsci/2020009. Epub 2020 Mar 4. Med Sci (Paris). 2020. PMID: 32129748 Review. French.
-
Oxysterol-binding Protein Activation at Endoplasmic Reticulum-Golgi Contact Sites Reorganizes Phosphatidylinositol 4-Phosphate Pools.J Biol Chem. 2016 Jan 15;291(3):1336-47. doi: 10.1074/jbc.M115.682997. Epub 2015 Nov 23. J Biol Chem. 2016. PMID: 26601944 Free PMC article.
-
OSBP-mediated PI(4)P-cholesterol exchange at endoplasmic reticulum-secretory granule contact sites controls insulin secretion.Cell Rep. 2024 Apr 23;43(4):113992. doi: 10.1016/j.celrep.2024.113992. Epub 2024 Mar 26. Cell Rep. 2024. PMID: 38536815
-
Phosphoinositides in the hepatitis C virus life cycle.Viruses. 2012 Oct 19;4(10):2340-58. doi: 10.3390/v4102340. Viruses. 2012. PMID: 23202467 Free PMC article. Review.
-
Model of OSBP-Mediated Cholesterol Supply to Aichi Virus RNA Replication Sites Involving Protein-Protein Interactions among Viral Proteins, ACBD3, OSBP, VAP-A/B, and SAC1.J Virol. 2018 Mar 28;92(8):e01952-17. doi: 10.1128/JVI.01952-17. Print 2018 Apr 15. J Virol. 2018. PMID: 29367253 Free PMC article.
Cited by
-
Arabidopsis ORP2A mediates ER-autophagosomal membrane contact sites and regulates PI3P in plant autophagy.Proc Natl Acad Sci U S A. 2022 Oct 25;119(43):e2205314119. doi: 10.1073/pnas.2205314119. Epub 2022 Oct 17. Proc Natl Acad Sci U S A. 2022. PMID: 36252028 Free PMC article.
-
The PI(4)P phosphatase Sac2 controls insulin granule docking and release.J Cell Biol. 2019 Nov 4;218(11):3714-3729. doi: 10.1083/jcb.201903121. Epub 2019 Sep 18. J Cell Biol. 2019. PMID: 31533953 Free PMC article.
-
The ORP9-ORP11 dimer promotes sphingomyelin synthesis.Elife. 2024 Aug 6;12:RP91345. doi: 10.7554/eLife.91345. Elife. 2024. PMID: 39106189 Free PMC article.
-
Salmonella-induced cholesterol accumulation in infected macrophages suppresses autophagy via mTORC1 activation.Mol Biol Cell. 2025 Jan 1;36(1):ar3. doi: 10.1091/mbc.E24-06-0283. Epub 2024 Nov 27. Mol Biol Cell. 2025. PMID: 39602284 Free PMC article.
-
ERLIN1/2 scaffolds bridge TMUB1 and RNF170 and restrict cholesterol esterification to regulate the secretory pathway.Life Sci Alliance. 2024 May 23;7(8):e202402620. doi: 10.26508/lsa.202402620. Print 2024 Aug. Life Sci Alliance. 2024. PMID: 38782601 Free PMC article.
References
-
- Balla A, Balla T (2006) Phosphatidylinositol 4‐kinases: old enzymes with emerging functions. Trends Cell Biol 16: 351–361 - PubMed
-
- Bao X, Zheng W, Hata Sugi N, Agarwala KL, Xu Q, Wang Z, Tendyke K, Lee W, Parent L, Li W, Cheng H, Shen Y, Taylor N, Dezso Z, Du H, Kotake Y, Zhao N, Wang J, Postema M, Woodall‐Jappe M et al (2015) Small molecule schweinfurthins selectively inhibit cancer cell proliferation and mTOR/AKT signaling by interfering with trans‐Golgi‐network trafficking. Cancer Biol Ther 16: 589–601 - PMC - PubMed
-
- Bigay J, Antonny B (2012) Curvature, lipid packing, and electrostatics of membrane organelles: defining cellular territories in determining specificity. Dev Cell 23: 886–895 - PubMed
Publication types
MeSH terms
Substances
Grants and funding
LinkOut - more resources
Full Text Sources
Other Literature Sources
Medical
Miscellaneous
