Comparative Study
. 2017 Nov 15;199(10):3559-3570.
doi: 10.4049/jimmunol.1700904. Epub 2017 Oct 4.

Rab27-Dependent Exosome Production Inhibits Chronic Inflammation and Enables Acute Responses to Inflammatory Stimuli

Affiliations
Comparative Study

Rab27-Dependent Exosome Production Inhibits Chronic Inflammation and Enables Acute Responses to Inflammatory Stimuli

Margaret Alexander et al. J Immunol. .

Abstract

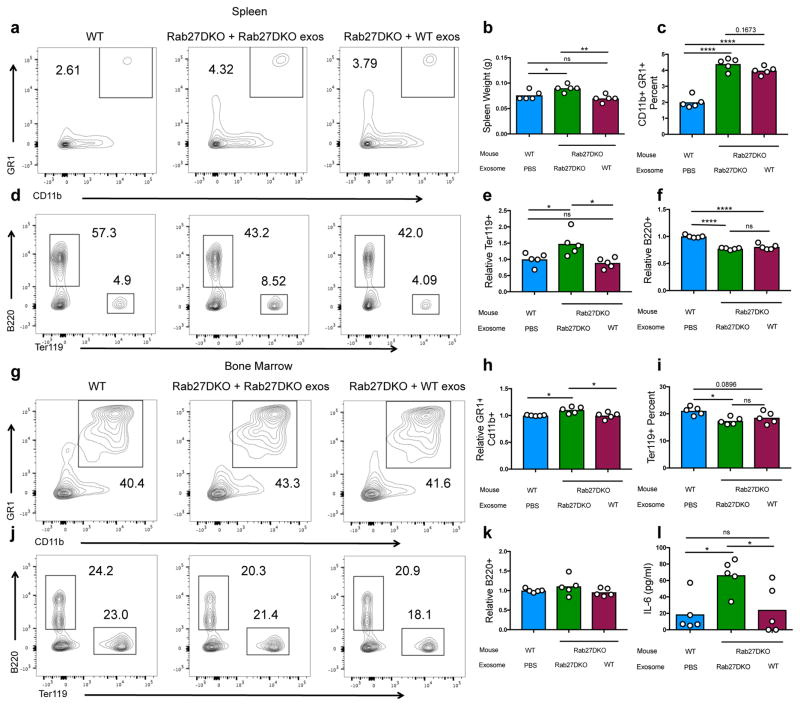
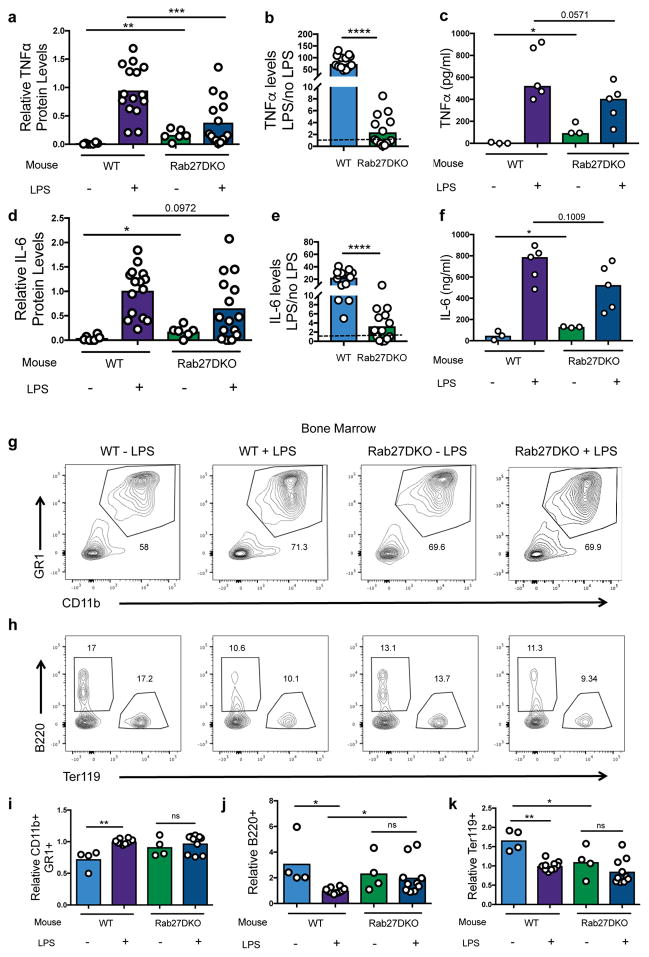
Extracellular vesicles, including exosomes, have recently been implicated as novel mediators of immune cell communication in mammals. However, roles for endogenously produced exosomes in regulating immune cell functions in vivo are just beginning to be identified. In this article, we demonstrate that Rab27a and Rab27b double-knockout (Rab27DKO) mice that are deficient in exosome secretion have a chronic, low-grade inflammatory phenotype characterized by elevated inflammatory cytokines and myeloproliferation. Upon further investigation, we found that some of these phenotypes could be complemented by wild-type (WT) hematopoietic cells or administration of exosomes produced by GM-CSF-expanded bone marrow cells. In addition, chronically inflamed Rab27DKO mice had a blunted response to bacterial LPS, resembling endotoxin tolerance. This defect was rescued by bone marrow exosomes from WT, but not miR-155-/-, cells, suggesting that uptake of miR-155-containing exosomes is important for a proper LPS response. Further, we found that SHIP1 and IRAK-M, direct targets of miR-155 that are known negative regulators of the LPS response, were elevated in Rab27DKO mice and decreased after treatment with WT, but not miR-155-/-, exosomes. Together, our study finds that Rab27-dependent exosome production contributes to homeostasis within the hematopoietic system and appropriate responsiveness to inflammatory stimuli.


Figures

Figure 1
Figure 1. Rab27DKO mice display chronic, low-grade inflammation
6–8 week old WT or Rab27DKO mouse hematopoietic populations were analyzed in the bone marrow and the spleen. (A) Granulocyte-monocyte myeloid (GR1+ CD11b+), erythroid precursor (Ter119+), and B cell (B220+) populations were analyzed in the spleen via flow cytometry. Representative flow plots are displayed. (B–D) Relative levels of GR1+ CD11b+, B220+, and Ter119+ populations in the spleen were quantified and set relative to WT controls. (E) Representative flow plots of myeloid (GR1+ CD11b+), erythroid precursor (Ter119+), and B cell (B220+) populations in the bone marrow. (F–H) Relative levels of GR1+ CD11b+, B220+, and Ter119+ populations were quantified in the bone marrow. (I) Spleen weights of WT and Rab27DKO mice. (J–K) TNFα and IL-6 protein levels were quantified via ELISA from the serum of WT and Rab27DKO mice. Dots represent individual mice and the bar represents the mean. Relative levels are relative to the WT condition where the average of the WT condition is set to 1. Data are representative of at least 3 individual experiments. P values are either stated or *, p < 0.05; **, p < 0.01; ***, p <.001; Welsh’s corrected t-Test.
Figure 2
Figure 2. A subset of Rab27DKO phenotypes are cell extrinsic
WT CD45.1 mice were lethally irradiated and reconstituted with either a 1:1 mix of WT (CD45.1+) and Rab27DKO (CD45.2+), Rab27DKO (CD45.2+) alone, or 1:1 mix of CD45.1+ and CD45.2+ WT bone marrow for 2 months. (A) Representative flow plots of reconstitution efficiency in the spleen using CD45.1/.2 as a marker. (B) Reconstitution efficacy was quantified by CD45 markers in the spleen, genotype of CD45 marker is indicated below the graph. (C–D) GR1 CD11b+ representative flow plots and percentages with quantification of relative levels to the right. (E) CD45 markers within the GR1+ CD11b+ population. (F–G) Ter119+ and B220+ representative flow plots are shown for the spleen and relative levels are quantified to the right. (H) CD45 markers within the B220+ population in the spleen. (I) Relative Ter119+ cells. (J) Spleen weight in grams. Dots represent individual mice and the bar represents the mean. Relative levels are relative to the WT condition where the average of the WT condition is set to 1. Data are representative of 4 individual experiments. Adjusted p values are either stated or *, p < 0.05; **, p < 0.01; ***, p <.001; ****, p <.0001; one-way ANOVA Tukey multiple comparison.
Figure 3
Figure 3. WT exosome treatment can complement certain Rab27DKO phenotypes
Rab27DKO mice were injected 2 times per week for 4 weeks with the exosomal pellet from WT or Rab27DKO GM-BMs. (A) GR1+ CD11b+ representative flow plots in the spleen. (B) Spleen weights in grams of the treatment groups. Mouse genotype and exosome treatment are indicated below the graphs. (C) Quantification of GR1+ CD11b+ relative levels. (D–F) Representative flow plot of Ter119+ and B220+ cells in the spleen with quantification of relative levels to the right. (G–H) GR1+ CD11b+ representative flow plots in the bone marrow and quantification of these percentages. (I–K) Representative flow plot of Ter119+ and B220+ cells in the bone marrow and relative levels are quantified to the right. (L) IL-6 levels were quantified via ELISA from the serum. Relative levels are relative to the WT condition where the average of the WT condition is set to 1. Data are representative of 3 individual experiments. Dots represent individual mice and the bar represents the mean. Adjusted p values are either stated or *, p < 0.05; **, p < 0.01; ***, p <.001; ****, p <.0001; one-way ANOVA Tukey multiple comparison.
Figure 4
Figure 4. Rab27DKO mice have a refractory response to LPS
WT or Rab27DKO mice were challenged with or without LPS. Serum was taken 2 and 6 hours post LPS challenge while immune populations were examined 72 hours post LPS. (A) Relative levels of TNFα in the serum at 2 hours post LPS administration with WT LPS treatment group set to 1. (B) Fold change in TNFα levels in response to LPS where LPS levels of the cytokines are set relative to the no LPS treatment from same experiments shown in A. Dotted line represents no response to LPS. P value from Welsh’s corrected t-test ****, p <.0001. (C) Representative TNFα concentrations from WT and Rab27DKO mice treated with or without LPS (D–F) Same analysis as A–C but for IL-6. (G–H) Representative flow plots of myeloid (GR1+ CD11b+), B cell (B220+) and erythroid precursor (Ter119+) populations for each experimental condition in the bone marrow compartment. (I–K) Relative levels of CD11b+ GR1+, B220+, and Ter119+ population are shown with the WT +LPS average set to 1. Data are representative of 3 separate experiments. Dots represent individual mice and the bar represents the mean. Adjusted p values are either stated or *, p < 0.05; **, p < 0.01; ****, p <.0001; one-way ANOVA Tukey multiple comparison unless otherwise noted.
Figure 5
Figure 5. Injection of WT exosomes restores responsiveness to LPS by Rab27DKO mice
(A) Rab27DKO mice were either i.p injected with a PBS mock control or WT exosomal pellets 24 hours before an LPS challenge. Serum was taken 2 or 6 hours post LPS injection for ELISAs. 48 hours after LPS administration exosomes were injected again and 72 hours post LPS immune populations were analyzed. (B) Representative TNFα concentration at 2 hours post LPS treatment. Mouse genotype and exosome treatment are indicated below the graphs. (C) Relative levels of TNFα at 2 hours post LPS with WT treated with LPS was set to 1. (D) Representative IL-6 concentration at 6 hours post LPS treatment. (E) Relative levels of IL-6 at 6 hours post LPS with WT treated with LPS was set to 1. (F–G) Representative flow plots of myeloid (GR1+ CD11b+), B cell (B220+), and erythroid precursor (Ter119+) populations in the bone marrow compartment in each experimental condition. (H–J) Quantification of changes to the CD11b+ GR1+, B220+, and Ter119+ populations where the LPS treated group was set relative to the no LPS group to show the responsiveness of the population. Dotted line marks no change between LPS and no LPS groups. Data are representative of 2 independent experiments. Dots represent individual mice and the bar represents the mean. Adjusted p values are either stated or *, p < 0.05; **, p < 0.01; ****, p <.0001; one-way ANOVA Tukey multiple comparison.
Figure 6
Figure 6. Restoration of Rab27DKO BMDC LPS responsiveness by miR-155 containing exosomes or miR-155 mimic
(A) Rab27DKO BMDCs were treated with Rab27DKO, WT, or miR-155−/− exosomal pellets from GM-BMs 24 hour before LPS administration. Relative media TNFα levels 2 hours post LPS administration are shown with the WT group treated with LPS was set as 1. n = 7. (B) Representative TNFα concentrations shown. n = 4. (C) Representative western blot of SHIP1 in Rab27DKO BMDCs that have been given WT, Rab27DKO, or miR-155−/− exosome pellets from GM-BMs and then treated with LPS. (D–E) Rab27DKO BMDCs were treated with the Rab27DKO, WT, or miR-155−/− exosomal pellet from GM-BMs 24 hours before LPS administration. 6 hours after LPS treatment RNA was harvested and SHIP1 and IRAK-M levels were assayed with qRT-PCR with L32 as a loading control. Data is set relative to the Rab27DKO BMDC treated with WT exosomal pellets which is set to 1. n = 5 (F–I) Rab27DKO BMDCs were treated with either miR-155 mimic (155) or a miR-155 mimic where the seed region was mutated (Seed) 24 hour before LPS administration. (F) Relative TNFα levels. n = 7 (G) TNFα concentration. n = 4. (H) Relative IL-6 levels. n = 7 (G) IL-6 concentration. n = 4. The error bars represent +/− S.E.M. Adjusted p values are either stated or *, p < 0.05; **, p < 0.01; ***, p <.001; ****, p <.0001; one-way ANOVA Tukey multiple comparison.
Figure 7
Figure 7. miR-155 containing exosome rescue LPS responsiveness in Rab27DKO mice
(A) Rab27DKO mice were either i.p injected with a Rab27DKO, WT, or miR-155−/− exosome pellets 24 hours before an LPS challenge. Serum was taken 2 hours post LPS injection for ELISAs. Values are set relative to Rab27DKO +Rab27DKO exosomal pellets +LPS set to 1. (B) Representative TNFα concentrations. (C–D) Levels of SHIP1 mRNA in resting WT and Rab27DKO mice in the spleen and bone marrow relative to L32 loading control. P values are from Welsh’s corrected t-tests. (E) Westerns of SHIP1 in resting spleen and bone marrow with GAPDH as a loading control. (F) IRAK–M mRNA levels in resting bone marrow relative to L32. P values are from Welsh’s corrected t-tests. (G–H) Levels of SHIP1 and IRAK-M mRNA in Rab27DKO mice BM that received Rab27DKO, WT, or miR-155−/− exosomal pellets then were treated with LPS for 72 hours. (I) Representative flow plots of the myeloid (GR1+ CD11b+) population for each condition in the bone marrow compartment from the same experiment conditions of H. (J) Ratio of the CD11b+ GR1+ population is shown of the LPS treatment group compared to the no LPS treatment group. Dotted line marks no change between LPS and no LPS treatments. Adjusted p values are either stated or *, p < 0.05; ***, p <.001; ****, p <.0001; one-way ANOVA Tukey multiple comparison unless otherwise noted.
Figure 8
Figure 8. Model of the contribution of exosomal miR-155 to the LPS response
In a WT scenario, miR-155 can be transferred to a recipient cell leading to the knockdown of targets like SHIP1. Then the cell receives an LPS signal and can respond properly. However, in the Rab27DKO model, cells are defective in producing the appropriate amounts of exosomes, therefore the recipient cells do not receive miR-155 and cannot down-regulate targets such as SHIP1 and thus respond improperly to LPS. In the last scenario, the cells are producing exosomes but they do not contain miR-155 resulting in the lack of transferred miR-155, increasing levels of miR-155 targets, and an improper response to LPS.

Similar articles

Cited by

References

    1. Xu H, Barnes GT, Yang Q, Tan G, Yang D, Chou CJ, Sole J, Nichols A, Ross JS, Tartaglia La, et al. Chronic inflammation in fat plays a crucial role in the development of obesity-related insulin resistance. J Clin Invest. 2003;112:1821–1830. - PMC - PubMed
    1. Alexander M, O’Connell RM. Noncoding RNAs and chronic inflammation: Micro-managing the fire within. BioEssays. 2015;37:1005–1015. - PMC - PubMed
    1. Hu R, Kagele DA, Huffaker TB, Runtsch MC, Alexander M, Liu J, Bake E, Su W, Williams MA, Rao DS, Möller T, Garden GA, Round JL, O’Connell RM. miR-155 Promotes T Follicular Helper Cell Accumulation during Chronic, Low-Grade Inflammation. Immunity. 2014;41:605–619. - PMC - PubMed
    1. Mittelbrunn M, Sánchez-Madrid F. Intercellular communication: diverse structures for exchange of genetic information. Nat Rev Mol Cell Biol. 2012:328–35. - PMC - PubMed
    1. Ramachandran S, Palanisamy V. Horizontal transfer of RNAs: exosomes as mediators of intercellular communication. Wiley Interdiscip Rev RNA. 2012;3:286–93. - PMC - PubMed

Publication types

MeSH terms

LinkOut - more resources