. 2017 Nov 1;199(9):3360-3368.
doi: 10.4049/jimmunol.1700893. Epub 2017 Oct 4.

NetMHCpan-4.0: Improved Peptide-MHC Class I Interaction Predictions Integrating Eluted Ligand and Peptide Binding Affinity Data

Affiliations

NetMHCpan-4.0: Improved Peptide-MHC Class I Interaction Predictions Integrating Eluted Ligand and Peptide Binding Affinity Data

Vanessa Jurtz et al. J Immunol. .

Abstract

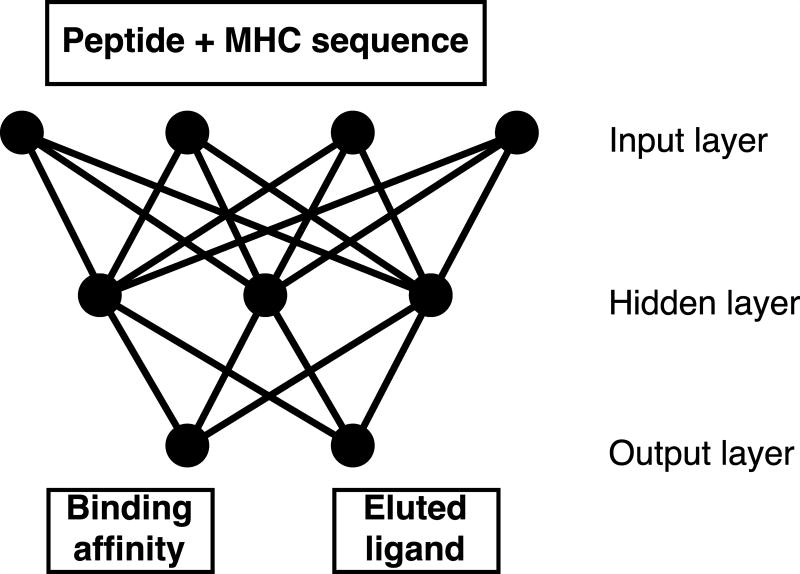
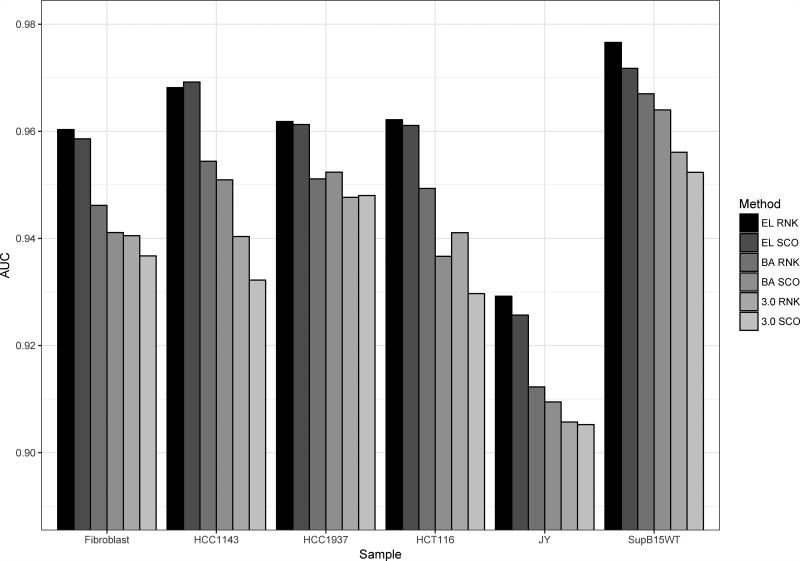
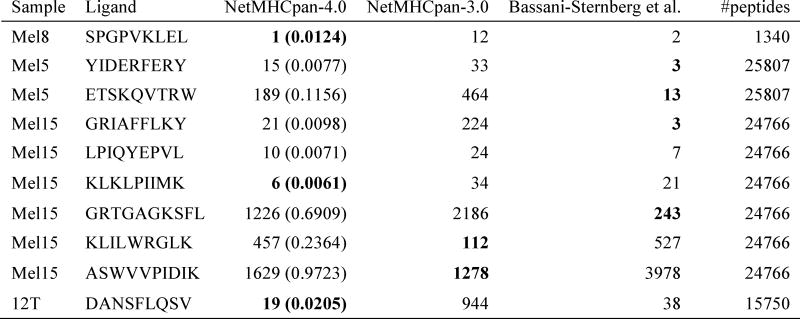
Cytotoxic T cells are of central importance in the immune system's response to disease. They recognize defective cells by binding to peptides presented on the cell surface by MHC class I molecules. Peptide binding to MHC molecules is the single most selective step in the Ag-presentation pathway. Therefore, in the quest for T cell epitopes, the prediction of peptide binding to MHC molecules has attracted widespread attention. In the past, predictors of peptide-MHC interactions have primarily been trained on binding affinity data. Recently, an increasing number of MHC-presented peptides identified by mass spectrometry have been reported containing information about peptide-processing steps in the presentation pathway and the length distribution of naturally presented peptides. In this article, we present NetMHCpan-4.0, a method trained on binding affinity and eluted ligand data leveraging the information from both data types. Large-scale benchmarking of the method demonstrates an increase in predictive performance compared with state-of-the-art methods when it comes to identification of naturally processed ligands, cancer neoantigens, and T cell epitopes.


Figures

Figure 1
Figure 1
Visualization of the neural networks with two output neurons used for combined training on binding affinity and eluted ligand data.
Figure 2
Figure 2
Mean performance per MHC molecule measured in terms of AUC for the four methods; BA (trained on binding affinity data only), EL (trained on eluted ligand data only), BA+EL BA (the binding affinity prediction value of the model trained on the combined binding affinity and eluted ligand data), and BA+EL EL (the eluted ligand likelihood prediction value of the model trained on the combined binding affinity and eluted ligand data) The methods were evaluated on all binding affinity (all_BA) data and all eluted ligand (all_EL) data including negative peptides derived from source proteins, and on data sets restricted to alleles occurring in both binding affinity and eluted ligand data sets (shared_BA, and shared_EL).
Figure 3
Figure 3
a-c) Predicted length preference of selected MHC molecules according to different models. Binding to selected HLA molecules was predicted for 80,000 8–15-mer peptides and the frequency of peptide lengths in the top 2% predicted peptides calculated. d) Correlation of predicted and observed ligand length for different models. Binding to all HLA alleles present in both binding affinity and eluted ligand data sets was predicted using the four different prediction methods for 80,000 8–15-mer peptides. Subsequently, the occurrence of different peptide lengths in the top 2% predicted peptides for each molecule was calculated, and the correlation coefficient between these frequencies and the length frequencies in the eluted ligand data set calculated.
Figure 4
Figure 4
Eluted ligand leave-one-out experiments. a) Performance per MHC allele of a model trained on all data and a model where the eluted ligand data of a given allele was left out of the training process. b) Correlation of predicted and observed ligand length for a model trained on all data and the leave-one-out models.
Figure 5
Figure 5
Sensitivity of different models as a function of the Frank threshold on a) eluted ligands published by Pearson et al. (17) and b) T-cell epitope data downloaded from IEDB.
Figure 6
Figure 6
Binding motifs for HLA molecules derived from (upper panel) in-vitro binding affinity data using a binding threshold of 500 nM, (lower panel) eluted ligand data. Logos were made using Seq2Logo with default parameters (30).
Figure 7
Figure 7
Motivation for using percentile rank score predictions. Box-plot representation of prediction values for the ligands in the Pearson data set. Left panel: Eluted ligand likelihood prediction scores. Right panel: Percentile rank values.
Figure 8
Figure 8
Sensitivity and specificity performance curves for the NetMHCpan-4.0 eluted ligand likelihood predictions. Curves are estimated from a balanced set of eluted ligands from the (17) data set. The insert shows the complete sensitivity and specificity curves as a function of the percentile rank score. The main plot shows the curves in the high-scoring range for 0–5 percentile scores. Dotted vertical and horizontal lines are guides to the eye indicating sensitivity and specificity and the 2% rank score threshold.
Figure 9
Figure 9
Predictive performance measured in terms of AUC on the Bassani-Sternberg unfiltered eluted ligand data sets. Prediction values are assigned to each peptide in a given data set as the lowest percentile rank score / highest prediction score to each of the HLA molecule expressed by the given cell line. The six methods included are: EL RNK (NetMHCpan-4.0 eluted ligand percentile rank), EL SCO (NetMHCpan-4.0 eluted ligand likelihood score), BA RNK (NetMHCpan-4.0 binding affinity percentile rank), BA SCO (NetMHCpan-4.0 binding affinity score), 3.0 RNK (NetMHCpan-3.0 percentile rank, and 3.0 SCO (NetMHCpan-3.0 binding affinity score).
Figure 10
Figure 10
Predictive performance evaluated in terms of rank of neo-antigens identified in four melanoma samples. A rank value of 1 corresponds to the ligand obtaining the highest score (lowest percentile rank) of all peptides from the given sample. Data and performance values for MixMHCFpred are from (31). NetMHCpan-4.0 and NetMHCpan-3.0 are performance values obtained by assigning to each peptide in the given data set the lowest percentile rank score to each of the HLA-A and B molecules expressed by the given cell line. The values in parentheses for NetMHCpan-4.0 are the predicted percentile rank values. Lowest rank value for each ligand is highlighted in bold.

References

    1. Nielsen M, Andreatta M. NetMHCpan-3.0; improved prediction of binding to MHC class I molecules integrating information from multiple receptor and peptide length datasets. Genome Med. 2016;8:1–9. - PMC - PubMed
    1. Vita R, Overton JA, Greenbaum JA, Ponomarenko J, Clark JD, Cantrell JR, Wheeler DK, Gabbard JL, Hix D, Sette A, Peters B. The immune epitope database (IEDB) 3.0. Nucleic Acids Res. 2015;43:D405–12. - PMC - PubMed
    1. Nielsen M, Andreatta M. NNAlign: a platform to construct and evaluate artificial neural network models of receptor-ligand interactions. Nucleic Acids Res 2017 - PMC - PubMed
    1. Andreatta M, Nielsen M. Gapped sequence alignment using artificial neural networks: application to the MHC class I system. Bioinformatics 2015 - PMC - PubMed
    1. Deres K, Schumacher TN, Wiesmuller KH, Stevanovic S, Greiner G, Jung G, Ploegh HL. Preferred size of peptides that bind to H-2 Kb is sequence dependent. Eur J Immunol. 1992;22:1603–8. - PubMed

Publication types