. 2017 Nov 1;199(9):3326-3335.
doi: 10.4049/jimmunol.1700534. Epub 2017 Oct 4.

Identification of IL-40, a Novel B Cell-Associated Cytokine

Affiliations

Identification of IL-40, a Novel B Cell-Associated Cytokine

Jovani Catalan-Dibene et al. J Immunol. .

Abstract

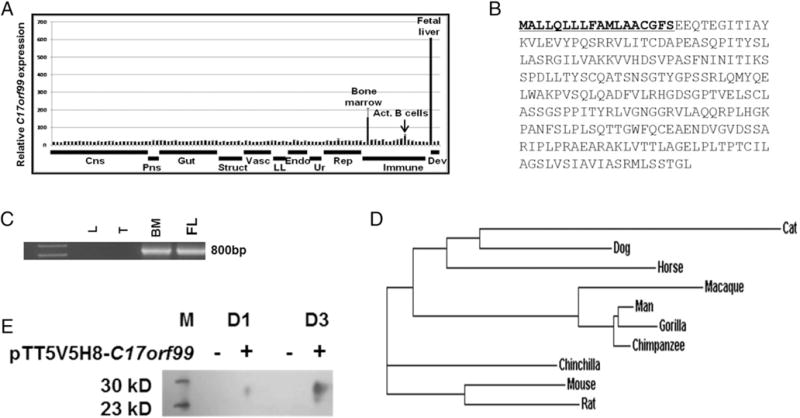
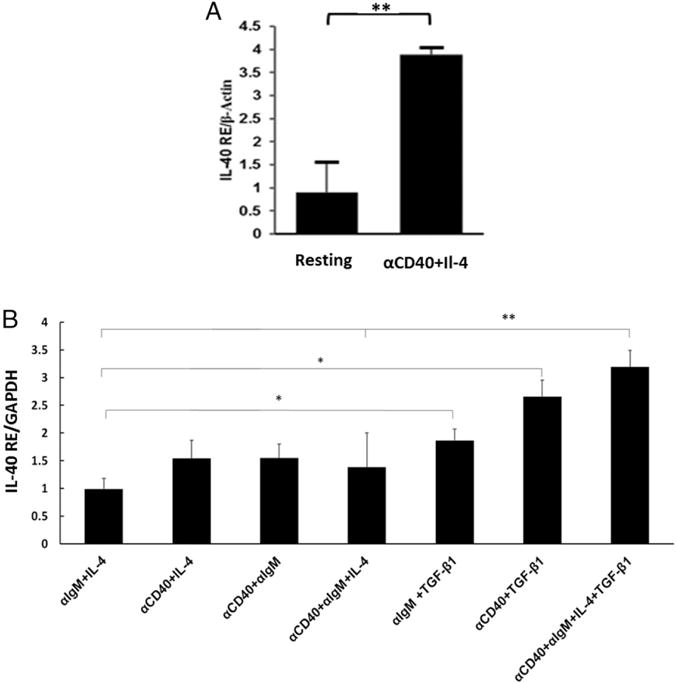
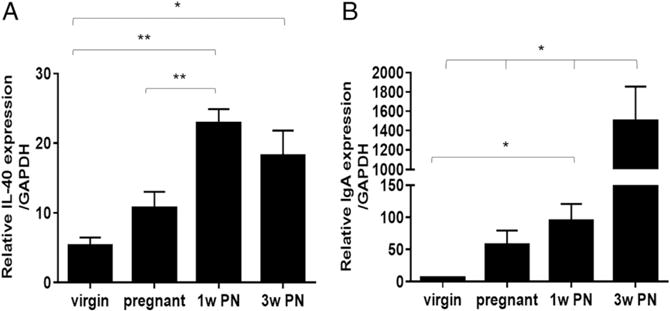
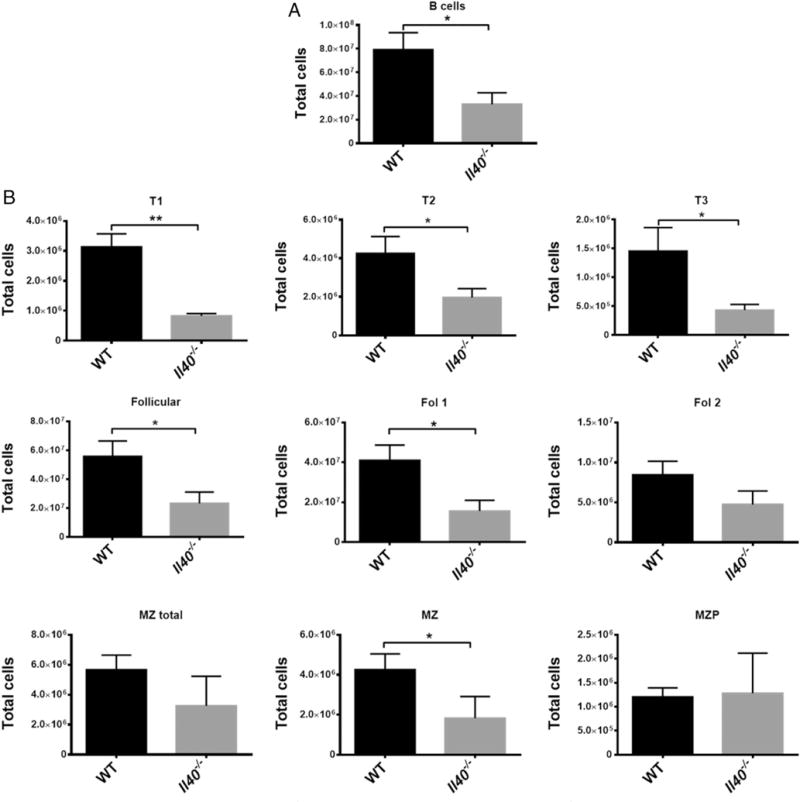
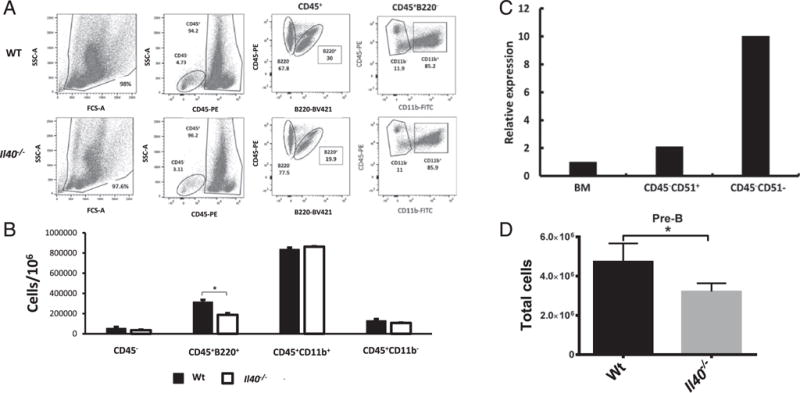
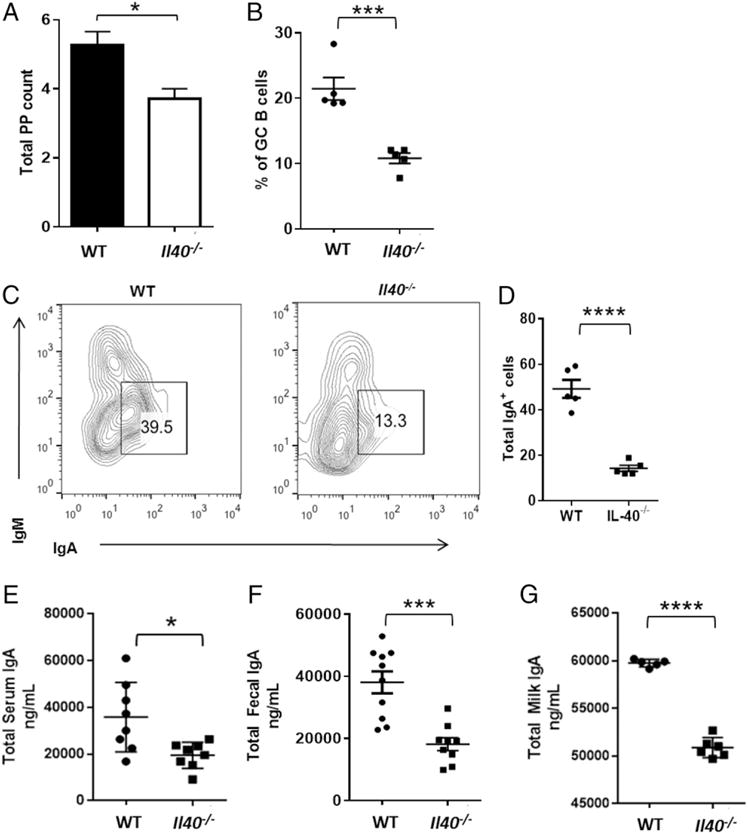
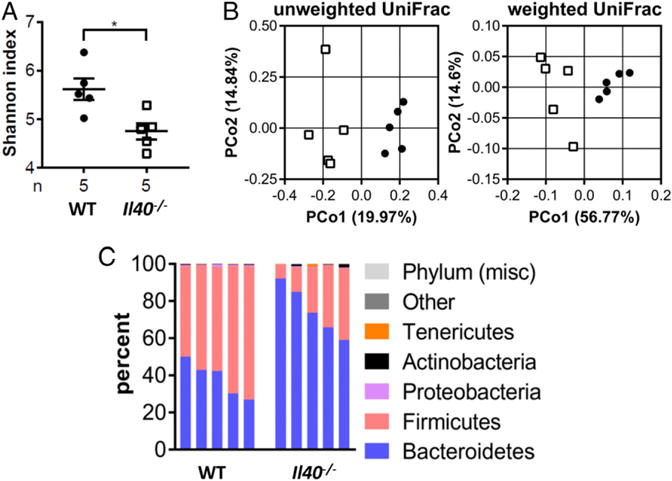
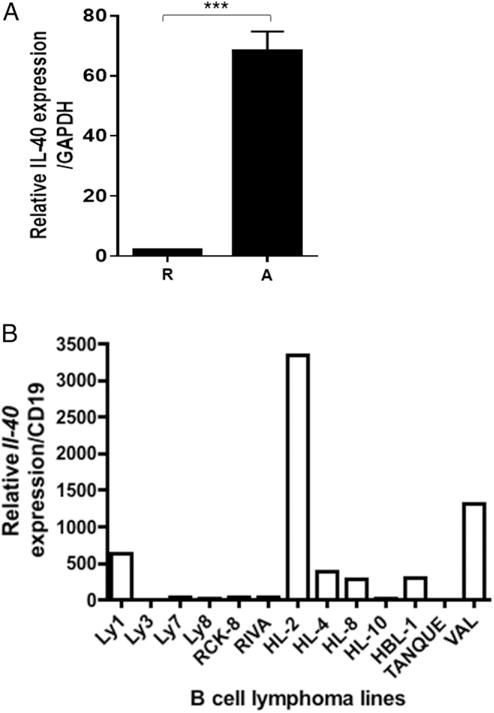
We describe a novel B cell-associated cytokine, encoded by an uncharacterized gene (C17orf99; chromosome 17 open reading frame 99), that is expressed in bone marrow and fetal liver and whose expression is also induced in peripheral B cells upon activation. C17orf99 is only present in mammalian genomes, and it encodes a small (∼27-kDa) secreted protein unrelated to other cytokine families, suggesting a function in mammalian immune responses. Accordingly, C17orf99 expression is induced in the mammary gland upon the onset of lactation, and a C17orf99-/- mouse exhibits reduced levels of IgA in the serum, gut, feces, and lactating mammary gland. C17orf99-/- mice have smaller and fewer Peyer's patches and lower numbers of IgA-secreting cells. The microbiome of C17orf99-/- mice exhibits altered composition, likely a consequence of the reduced levels of IgA in the gut. Although naive B cells can express C17orf99 upon activation, their production increases following culture with various cytokines, including IL-4 and TGF-β1, suggesting that differentiation can result in the expansion of C17orf99-producing B cells during some immune responses. Taken together, these observations indicate that C17orf99 encodes a novel B cell-associated cytokine, which we have called IL-40, that plays an important role in humoral immune responses and may also play a role in B cell development. Importantly, IL-40 is also expressed by human activated B cells and by several human B cell lymphomas. The latter observations suggest that it may play a role in the pathogenesis of certain human diseases.


Conflict of interest statement

Disclosures

V.P.L., P.A.H., A.M.B., I.U., and A.Z. are inventors named in a patent application (U.S. Provisional Patent Application number 61/906,855) describing uses of IL40 filed by the Regents of the University of California. The other authors have no financial conflicts of interest.

Figures

FIGURE 1
FIGURE 1
C17orf99 encodes a novel cytokine (IL-40). (A) C17orf99 expression in normal human tissues and immune cells from the BIGE (4, 5) database. IL-40 is expressed in fetal liver, BM, and peripheral blood B cells activated with anti-CD40 and IL-4. (B) C17orf99 amino acid sequence showing the predicted signal peptide (underlined). (C) qPCR of C17orf99 showing a positive band in human fetal liver (FL) and BM but not in thymus (T) or lung (L) (which were used as controls); one experiment out of three independent experiments shown. (D) Clustal Omega analyses of the C17orf99 amino acid sequence in 10 selected mammalian species. C17orf99 homologs exhibit a minimum sequence homology with human C17orf99 (at the amino acid level) of 55% and a maximum E value of 3 × e−70. (E) Western blot of supernatant from day 1 (D1) or day 3 (D3) of cultures of HEK293 cells transfected with IL-40pTT5V5H8-C17orf99-His vector. Supernatants were concentrated in an anti-His column before being run in Western blots with anti-His Ab. Representative of two independent experiments. M, m.w. ladder.
FIGURE 2
FIGURE 2
IL-40 production is induced upon B cell activation. (A) IL-40 production by the mouse A20-2J cell line stimulated with anti-CD40 mAb and IL-4 for 24 h; data are representative of two independent experiments (mean ± SEM) (qRT-PCR). (B) qRT-PCR analysis of Il-40 expression in mouse spleen B cells stimulated with anti-CD40 Ab and anti-IgM (5 μg/ml) alone or in presence of IL-4 or TGF-β1 (all at 10 ng/ml) for 2 d. Data are fold expression compared with resting cells and are representative of three independent experiments (mean ± SEM). *p < 0.05, **p < 0.01.
FIGURE 3
FIGURE 3
IL-40 expression is induced in the mammary gland upon the onset of lactation, and the Il40−/− mouse exhibits decreased IgA levels in milk. (A) qRT-PCR analysis of IL-40 expression in WT virgin, pregnant, 1 wk PN lactating, and 3 wk PN lactating mouse mammary glands (mean ± SEM). *p < 0.02, **p < 0.001. (B) qRT-PCR analysis of IgA expression in WT virgin, pregnant, 1 wk PN, and 3 wk PN lactating mouse mammary glands (mean ± SEM). *p < 0.029.
FIGURE 4
FIGURE 4
B cell populations are altered in the Il40−/− mouse. (A) Total B cells (CD19+) in WT or Il40−/− mice. (B) B cell subpopulation analysis in the spleen. Transitional B cell subpopulations 1, 2, and 3 (T1: CD23CD93+IgMhighIgD−/lowCD21/35−/low; T2: CD23+CD93+IgMhighIgDhighCD21/35low; T3: CD23+CD93+IgMlowIgDhighCD21/35low respectively), total follicular B cells (Follicular: CD23+CD93CD21/35int), follicular 1 cells (Fol 1: CD23+ CD93IgMlowIgDhighCD21/35int), follicular 2 cells (Fol 2: CD23+CD93−/lowsIgMhighsIgDhighCD21/35int), total marginal zone B cells (MZ total: CD93−/low IgMhighCD21/35high), marginal zone cells (MZ: CD23CD93IgMhighIgDlowCD21/35high), and marginal zone precursors (MZP: CD23+CD93−/lowIgMhigh IgDhighCD21/35high). All of the cells were CD19+. Bars represent mean ± SEM; n = 4 per group. Data are representative of two independent experiments. *p # 0.05, **p # 0.002.
FIGURE 5
FIGURE 5
IL-40 is highly expressed in BM stroma and is required for normal B cell homeostasis. (A) BM staining of different cell compartments: stromal cells (CD45), leukocytes (CD45+), the B cell compartment (CD45+B220+), the myeloid compartment (CD45+CD11b+), and T cell progenitors (CD45+CD11b). Shown is a representative plot of n = 5 per group, which is representative of two independent experiments. (B) Total cell count for each compartment in (C). Results shown are representative of two independent experiments. (C) qPCR of sorted stromal populations in the BM. Whole BM expression, stromal precursors (LinCD45CD51+), and mature stroma (LinCD45CD51). Relative expression compared with whole BM. Data are representative of two independent experiments. (D) Number of pre-B cells (CD19+, B220+, IgM, IgD, CD43) in BM of WT and Il40−/− mice. *p < 0.05.
FIGURE 6
FIGURE 6
Il40−/− mice exhibit defects in GALT B cell populations. (A) Total counts of PPs from WT or Il40−/− mice (mean ± SEM; n = 7). *p < 0.0102. (B) Percentage of cells representing germinal center B cells in PPs of (A). (C) Flow cytometry analysis of germinal center B cells from PPs showing lower numbers of IgA+ B cells. (D) Total number of IgA+ cells from (B) (× 10−5). ****p < 0.01. (E) Serum IgA levels in Il40−/− mice compared with WT controls, as measured by sandwich ELISA (mean ± SEM; n = 8). *p < 0.0114. (F) Measurements of total IgA in fecal pellets by sandwich ELISA of WT versus Il40−/− mice (mean ± SEM; n = 10). ***p < 0.006. (G) Measurement of total IgA in breast milk by sandwich ELISA of WT (n = 5) versus Il40−/− mice (n = 6) (mean ± SEM). ****p < 0.0001. Results shown are representative of three independent experiments, each performed with five mice per group.
FIGURE 7
FIGURE 7
The microbiome of Il40−/− mice is altered. (A) The α diversity of fecal samples from WT or IL40−/− mice. (B) The β diversity of WT or IL40−/− mice. (C) Relative abundances (%) of different microbial phyla represented in WT or IL40−/− mice. *p < 0.05. n = 5 per group.
FIGURE 8
FIGURE 8
Human B cells produce IL-40. (A) qRT-PCR analysis of IL-40 expression in human resting (R) and activated (A) B cells. Cells were activated for 24 h with anti-CD40 Ab + IL-4. Data are representative of three independent experiments (mean ± SEM). (B) IL-40 expression pattern in several human diffuse large B cell lymphoma cell lines (qPCR). A representative experiment out of three is shown. ***p < 0.0005.

References

    1. Lunney JK. Cytokines orchestrating the immune response. Rev - Off Int Epizoot. 1998;17:84–94. - PubMed
    1. Zlotnik A, Yoshie O. The chemokine superfamily revisited. Immunity. 2012;36:705–716. - PMC - PubMed
    1. Clavel G, Thiolat A, Boissier MC. Interleukin newcomers creating new numbers in rheumatology: IL-34 to IL-38. Joint Bone Spine. 2013;80:449–453. - PubMed
    1. Lee J, Hever A, Willhite D, Zlotnik A, Hevezi P. Effects of RNA degradation on gene expression analysis of human postmortem tissues. FASEB J. 2005;19:1356–1358. - PubMed
    1. Roth RB, Hevezi P, Lee J, Willhite D, Lechner SM, Foster AC, Zlotnik A. Gene expression analyses reveal molecular relationships among 20 regions of the human CNS. Neurogenetics. 2006;7:67–80. - PubMed

Publication types