

Computationally Optimized Broadly Reactive Hemagglutinin Elicits Hemagglutination Inhibition Antibodies against a Panel of H3N2 Influenza Virus Cocirculating Variants
- PMID: 28978710
- PMCID: PMC5709590
- DOI: 10.1128/JVI.01581-17
Computationally Optimized Broadly Reactive Hemagglutinin Elicits Hemagglutination Inhibition Antibodies against a Panel of H3N2 Influenza Virus Cocirculating Variants
Abstract
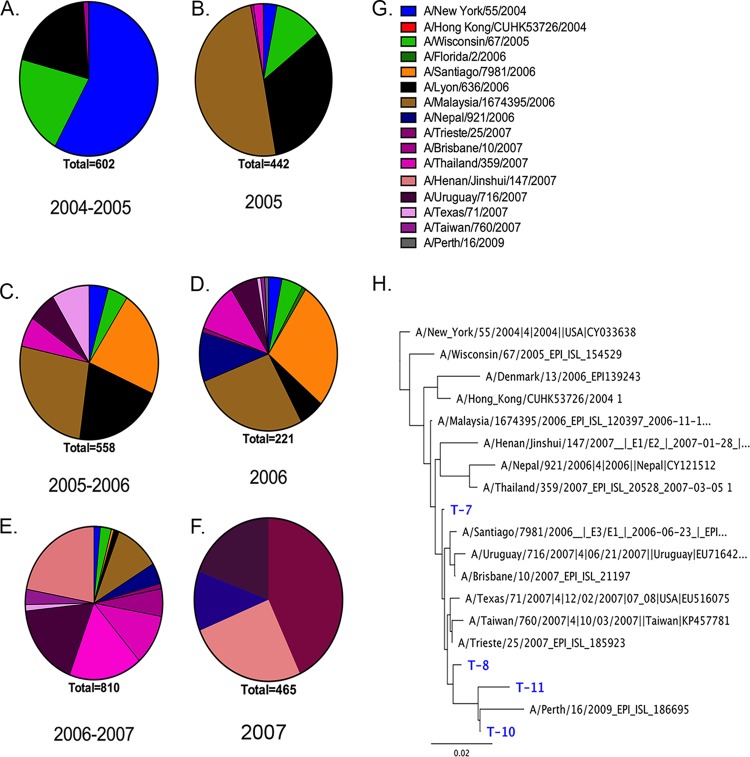
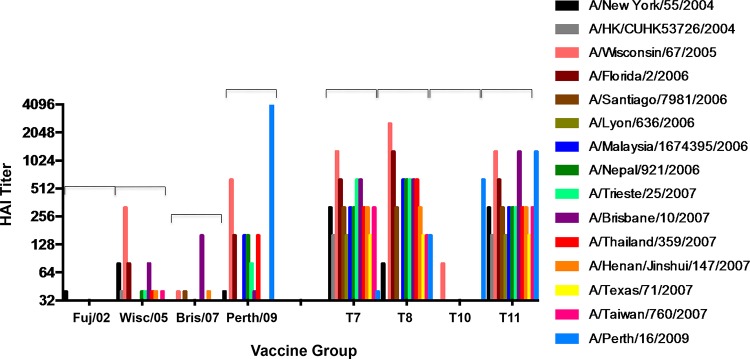
Each influenza season, a set of wild-type viruses, representing one H1N1, one H3N2, and one to two influenza B isolates, are selected for inclusion in the annual seasonal influenza vaccine. In order to develop broadly reactive subtype-specific influenza vaccines, a methodology called computationally optimized broadly reactive antigens (COBRA) was used to design novel hemagglutinin (HA) vaccine immunogens. COBRA technology was effectively used to design HA immunogens that elicited antibodies that neutralized H5N1 and H1N1 isolates. In this report, the development and characterization of 17 prototype H3N2 COBRA HA proteins were screened in mice and ferrets for the elicitation of antibodies with HA inhibition (HAI) activity against human seasonal H3N2 viruses that were isolated over the last 48 years. The most effective COBRA HA vaccine regimens elicited antibodies with broader HAI activity against a panel of H3N2 viruses than wild-type H3 HA vaccines. The top leading COBRA HA candidates were tested against cocirculating variants. These variants were not efficiently detected by antibodies elicited by the wild-type HA from viruses selected as the vaccine candidates. The T-11 COBRA HA vaccine elicited antibodies with HAI and neutralization activity against all cocirculating variants from 2004 to 2007. This is the first report demonstrating broader breadth of vaccine-induced antibodies against cocirculating H3N2 strains compared to the wild-type HA antigens that were represented in commercial influenza vaccines.IMPORTANCE There is a need for an improved influenza vaccine that elicits immune responses that recognize a broader number of influenza virus strains to prevent infection and transmission. Using the COBRA approach, a set of vaccines against influenza viruses in the H3N2 subtype was tested for the ability to elicit antibodies that neutralize virus infection against not only historical vaccine strains of H3N2 but also a set of cocirculating variants that circulated between 2004 and 2007. Three of the H3N2 COBRA vaccines recognized all of the cocirculating strains during this era, but the chosen wild-type vaccine strains were not able to elicit antibodies with HAI activity against these cocirculating strains. Therefore, the COBRA vaccines have the ability to elicit protective antibodies against not only the dominant vaccine strains but also minor circulating strains that can evolve into the dominant vaccine strains in the future.
Keywords: COBRA; H3N2; hemagglutination-inhibition; influenza; mice.
Copyright © 2017 American Society for Microbiology.
Figures

Similar articles
-
Elicitation of Protective Antibodies against 20 Years of Future H3N2 Cocirculating Influenza Virus Variants in Ferrets Preimmune to Historical H3N2 Influenza Viruses.J Virol. 2019 Jan 17;93(3):e00946-18. doi: 10.1128/JVI.00946-18. Print 2019 Feb 1. J Virol. 2019. PMID: 30429350 Free PMC article.
-
Elicitation of Protective Antibodies against a Broad Panel of H1N1 Viruses in Ferrets Preimmune to Historical H1N1 Influenza Viruses.J Virol. 2017 Nov 30;91(24):e01283-17. doi: 10.1128/JVI.01283-17. Print 2017 Dec 15. J Virol. 2017. Retraction in: J Virol. 2024 Jul 23;98(7):e0183223. doi: 10.1128/jvi.01832-23. PMID: 28978709 Free PMC article. Retracted.
-
Design and Characterization of a Computationally Optimized Broadly Reactive Hemagglutinin Vaccine for H1N1 Influenza Viruses.J Virol. 2016 Apr 14;90(9):4720-4734. doi: 10.1128/JVI.03152-15. Print 2016 May. J Virol. 2016. PMID: 26912624 Free PMC article.
-
H3N2 influenza viruses in humans: Viral mechanisms, evolution, and evaluation.Hum Vaccin Immunother. 2018;14(8):1840-1847. doi: 10.1080/21645515.2018.1462639. Epub 2018 May 14. Hum Vaccin Immunother. 2018. PMID: 29641358 Free PMC article. Review.
-
Next-Generation Influenza HA Immunogens and Adjuvants in Pursuit of a Broadly Protective Vaccine.Viruses. 2021 Mar 24;13(4):546. doi: 10.3390/v13040546. Viruses. 2021. PMID: 33805245 Free PMC article. Review.
Cited by
-
Broadly Reactive H2 Hemagglutinin Vaccines Elicit Cross-Reactive Antibodies in Ferrets Preimmune to Seasonal Influenza A Viruses.mSphere. 2021 Mar 10;6(2):e00052-21. doi: 10.1128/mSphere.00052-21. mSphere. 2021. PMID: 33692193 Free PMC article.
-
Extra-Neutralizing FcR-Mediated Antibody Functions for a Universal Influenza Vaccine.Front Immunol. 2019 Mar 18;10:440. doi: 10.3389/fimmu.2019.00440. eCollection 2019. Front Immunol. 2019. PMID: 30949165 Free PMC article. Review.
-
Computational Approaches and Challenges to Developing Universal Influenza Vaccines.Vaccines (Basel). 2019 May 28;7(2):45. doi: 10.3390/vaccines7020045. Vaccines (Basel). 2019. PMID: 31141933 Free PMC article. Review.
-
Broadly Protective Strategies Against Influenza Viruses: Universal Vaccines and Therapeutics.Front Microbiol. 2020 Feb 7;11:135. doi: 10.3389/fmicb.2020.00135. eCollection 2020. Front Microbiol. 2020. PMID: 32117155 Free PMC article. Review.
-
Recombinant Influenza Vaccines: Saviors to Overcome Immunodominance.Front Immunol. 2020 Jan 10;10:2997. doi: 10.3389/fimmu.2019.02997. eCollection 2019. Front Immunol. 2020. PMID: 31998299 Free PMC article. Review.
References
-
- Epperson S, Jhung M, Richards S, Quinlisk P, Ball L, Moll M, Boulton R, Haddy L, Biggerstaff M, Brammer L, Trock S, Burns E, Gomez T, Wong KK, Katz J, Lindstrom S, Klimov A, Bresee JS, Jernigan DB, Cox N, Finelli L. 2013. Human infections with influenza A(H3N2) variant virus in the United States, 2011-2012. Clin Infect Dis 57(Suppl 1):S4–S11. doi:10.1093/cid/cit272. - DOI - PubMed
Publication types
MeSH terms
Substances
LinkOut - more resources
Full Text Sources
Other Literature Sources
Medical
