. 2017 Nov 30;91(24):e01237-17.
doi: 10.1128/JVI.01237-17. Print 2017 Dec 15.

T Cell-Macrophage Fusion Triggers Multinucleated Giant Cell Formation for HIV-1 Spreading

Affiliations

T Cell-Macrophage Fusion Triggers Multinucleated Giant Cell Formation for HIV-1 Spreading

Lucie Bracq et al. J Virol. .

Abstract

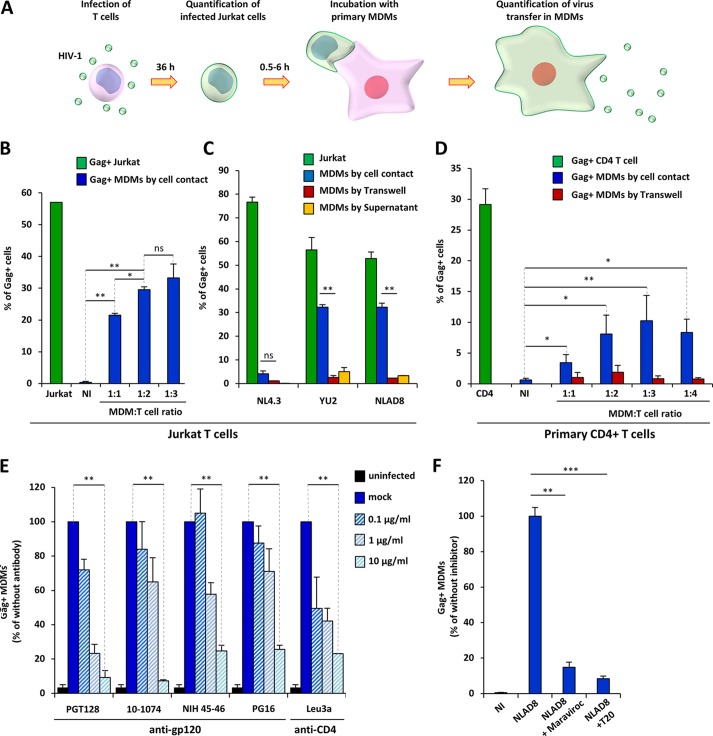
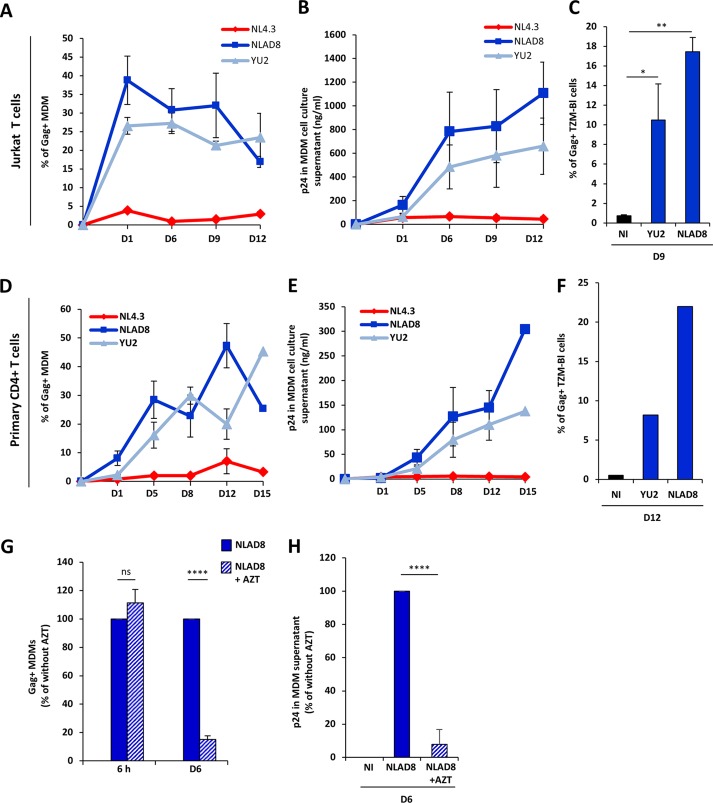
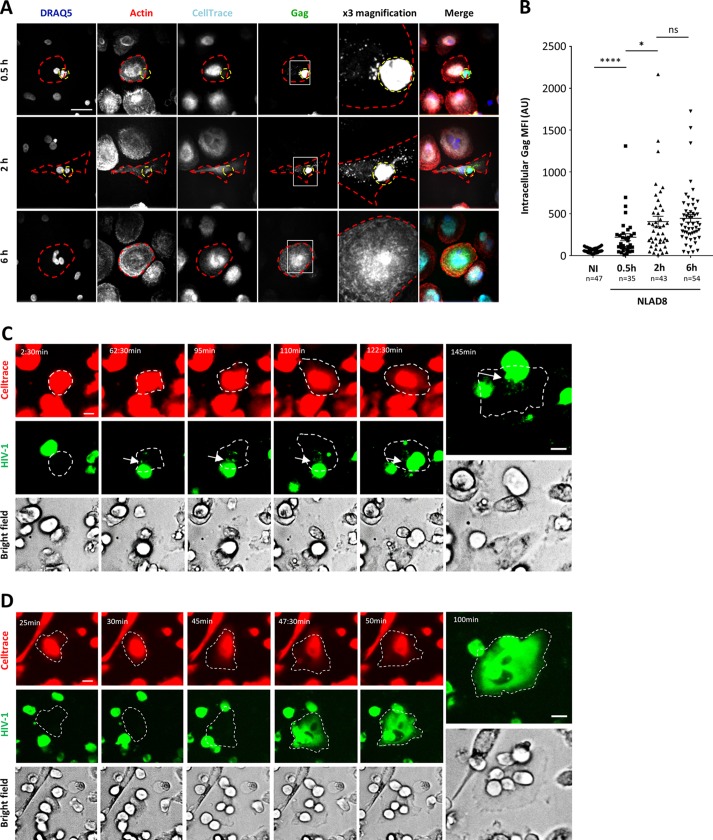
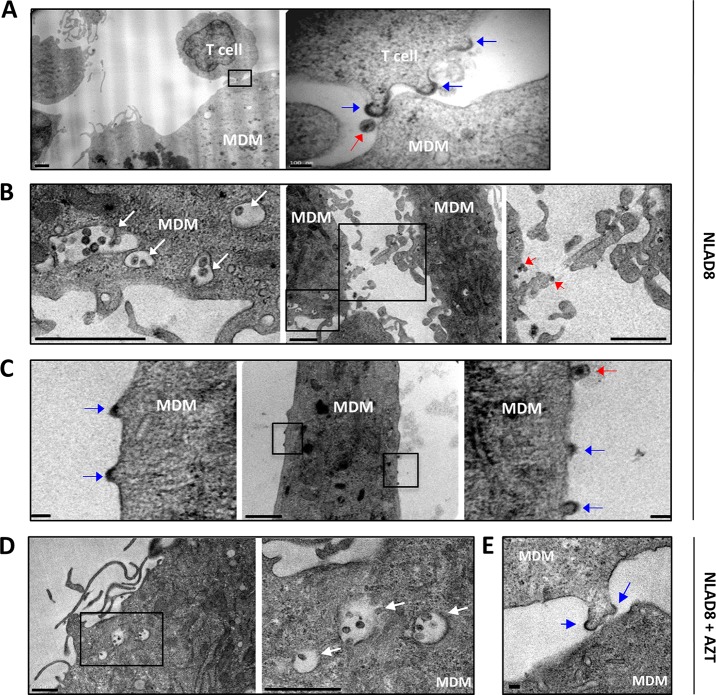
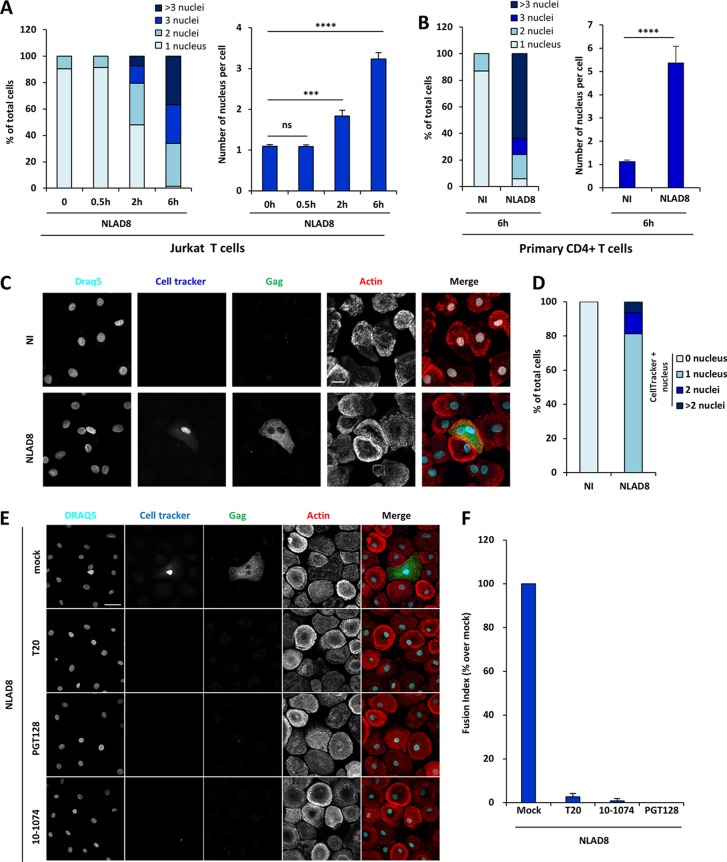
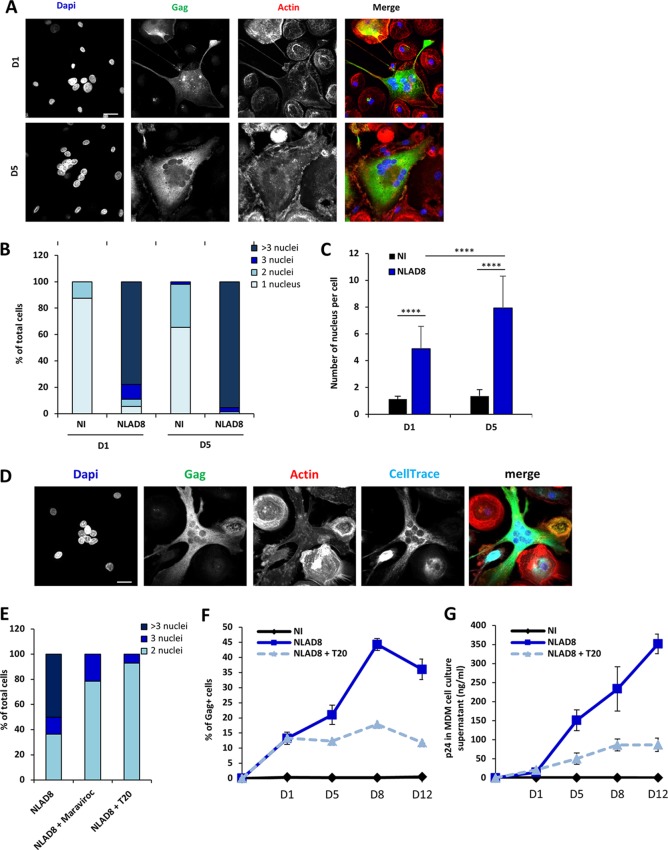
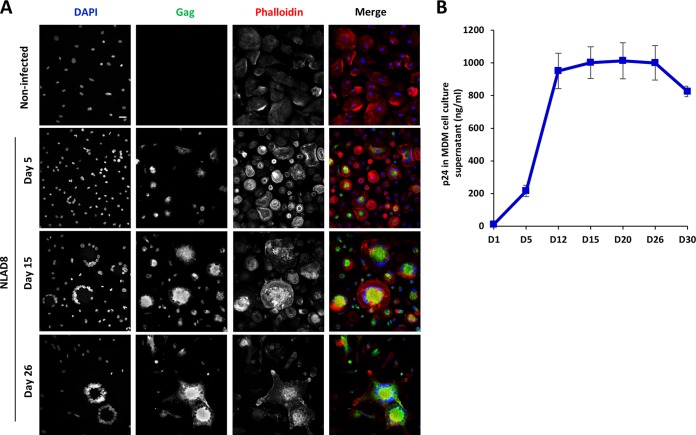
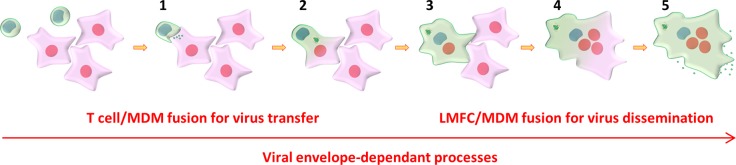
HIV-1-infected macrophages participate in virus dissemination and establishment of virus reservoirs in host tissues, but the mechanisms for virus cell-to-cell transfer to macrophages remain unknown. Here, we reveal the mechanisms for cell-to-cell transfer from infected T cells to macrophages and virus spreading between macrophages. We show that contacts between infected T lymphocytes and macrophages lead to cell fusion for the fast and massive transfer of CCR5-tropic viruses to macrophages. Through the merge of viral material between T cells and macrophages, these newly formed lymphocyte-macrophage fused cells acquire the ability to fuse with neighboring noninfected macrophages. Together, these two-step envelope-dependent cell fusion processes lead to the formation of highly virus-productive multinucleated giant cells reminiscent of the infected multinucleated giant macrophages detected in HIV-1-infected patients and simian immunodeficiency virus-infected macaques. These mechanisms represent an original mode of virus transmission for viral spreading and a new model for the formation of macrophage virus reservoirs during infection.IMPORTANCE We reveal a very efficient mechanism involved in cell-to-cell transfer from infected T cells to macrophages and subsequent virus spreading between macrophages by a two-step cell fusion process. Infected T cells first establish contacts and fuse with macrophage targets. The newly formed lymphocyte-macrophage fused cells then acquire the ability to fuse with surrounding uninfected macrophages, leading to the formation of infected multinucleated giant cells that can survive for a long time, as evidenced in vivo in lymphoid organs and the central nervous system. This route of infection may be a major determinant for virus dissemination and the formation of macrophage virus reservoirs in host tissues during HIV-1 infection.

Keywords: HIV-1; T lymphocytes; cell fusion; cell-to-cell transfer; macrophages.


Figures

FIG 1
FIG 1
HIV-1 transfer from infected T cells to macrophages. (A) Experimental protocol. (B) Jurkat cells were infected with the NLAD8 strain, and the percentage of infected cells was evaluated 36 h later by flow cytometry after Gag staining (green bars). Infected Jurkat cells were cocultured for 6 h with MDMs at the indicated cell ratio (1:1, 1:2, or 1:3 MDM/Jurkat cell ratio). After elimination of the Jurkat cells, the percentage of CD11b+/Gag+ MDMs was quantified by flow cytometry (blue bars). As a negative control, noninfected (NI) Jurkat cells were cocultured with MDMs. (C) Jurkat cells were infected with the NL4.3, YU2, or NLAD8 strain, and the percentage of infected cells was evaluated 36 h later by flow cytometry (green bars). The infected Jurkat cells were then cocultured with MDMs directly (blue bars) or through a Transwell membrane (red bars) for 6 h. In parallel, culture supernatants from Jurkat cells collected during the 6-h coculture with MDMs were used to infect autologous MDMs (yellow bars). The percentage of CD11b+/Gag+ MDMs was evaluated by flow cytometry. (D) Purified primary CD4+ T cells were infected with the YU2 strain, and the percentage of infected cells was evaluated 36 h later by flow cytometry (green bar). Infected T cells were then cocultured either directly (blue bars) or through a Transwell membrane (red bars) with autologous MDMs using different cell ratios (1:1, 1:2, 1:3, or 1:4 MDM/T cell ratios) for 6 h. After elimination of T cells, the percentage of CD11b+/Gag+ MDMs was quantified by flow cytometry. As a negative control, noninfected CD4+ T cells were cocultured with MDMs. (E and F) NLAD8-infected Jurkat cells were pretreated with anti-gp120 antibodies or T20, while MDMs were pretreated with anti-CD4 or maraviroc. Infected T cells were cocultured with MDMs for 6 h, and virus transfer to MDMs was quantified as described above. The results are expressed as the percentage of Gag+ MDMs relative to the number of Gag+ MDMs determined without antibodies or inhibitors. The results are the means from 5 independent experiments performed with MDMs from 5 donors. Error bars represent 1 SEM. Statistical significance was determined using a paired Student's t test (ns, not significant [P > 0.05]; *, P < 0.05; **, P < 0.01; ***, P < 0.001).
FIG 2
FIG 2
Productive infection of macrophages by virus cell-to-cell transfer from infected T cells. (A to F) NLAD8-infected Jurkat cells (A to C) or primary CD4+ T cells (D to F) were cocultured with MDMs for 6 h and eliminated, and the percentage of CD11b+/Gag+ MDMs was then evaluated 1, 6, 9, 12, or 15 days later by flow cytometry (A and D). In parallel, cell culture supernatants from MDMs were collected and p24 was quantified (B and E). Culture supernatants (100 ng of p24) of MDMs collected 9 days (C) or 12 days (F) after the coculture with YU2- or NLAD8-infected Jurkat (C) or CD4+ T (F) cells were used to infect TZM-bl cells, and the percentage of Gag+ TZM-bl cells was evaluated 48 h later by flow cytometry. (G and H) NLAD8-infected Jurkat cells were cocultured for 6 h with MDMs pretreated or not pretreated with AZT. (G) The percentage of CD11b+/Gag+ MDMs was then evaluated just after coculture (6 h) and 6 days later. (H) In parallel, culture supernatants of MDMs were collected 6 days after coculture and p24 was quantified. The results shown in panels A, B, D, E, G, and H are the means from 5 independent experiments performed with MDMs from 5 donors, while the results shown in panels C and F are representative of those from 3 independent experiments. Error bars represent 1 SEM. Statistical significance was determined using one-way analysis of variance (ns, not significant [P > 0.05]; *, P < 0.05; **, P < 0.01; ****, P < 0.0001). D, day.
FIG 3
FIG 3
Fluorescence microscopy analysis of intercellular contacts and virus transfer between infected T cells and macrophages. (A and B) NLAD8-infected Jurkat cells were cocultured for 0.5, 2, or 6 h with MDMs prestained with CellTrace. Cells were then fixed, stained with anti-Gag, phalloidin, and DRAQ5, and analyzed by confocal microscopy. (A) Images of a 5-μm-thick medial stack are shown. Infected donor T cells and MDM targets are indicated by dashed yellow and red lines, respectively. The areas in the white squares in the Gag column were magnified three times, and the images are shown in the ×3 magnification column. Bar, 25 μm. (B) The intracellular Gag mean fluorescence intensity (MFI) was quantified as indicated in the Materials and Methods section. Each dot corresponds to 1 cell, and the number of cells analyzed (n) is indicated. Horizontal bars represent the mean ± 1 SEM. Statistical significance was determined by an unpaired t test (ns, not significant [P > 0.05]; *, P < 0.05; ****, P < 0.0001). AU, absorbance units. (C) Jurkat cells infected with HIV-1R5-GFP (green) were cocultured with MDMs that had previously been plated onto an Ibidi dish and labeled with CellTrace (red). Fluorescence images were acquired using a 20× air objective on a spinning-disk microscope every 2.5 min for 145 min. A 5-μm-thick medial stack of representative images is shown, and the time lapse is indicated. Bars, 25 μm. The discharge of viral material (arrows) into MDMs (dashed lines) from infected T cells is shown. (D) Jurkat cells infected with HIV-1R5-GFP (green) were cocultured with MDMs that had previously been labeled with CellTrace (red). Fluorescence images were then acquired using a 20× air objective on a spinning-disk microscope every 2.5 min for 100 min. A 5-μm-thick medial stack of representative images is shown, and the time lapse is indicated. Bars, 25 μm. The labeled MDM target is indicated with a dashed line.
FIG 4
FIG 4
Transmission electron microscopy analysis of virus transfer to macrophages. NLAD8-infected Jurkat cells were cocultured for 6 h with MDMs with (D and E) or without (A to C) AZT (5 μM). Cells were then fixed and dehydrated. Ultrathin sections were cut, stained, and observed with a transmission electron microscope. Blue arrows, assembling and budding viruses; red arrows, mature virions; white arrows, MDM cytoplasmic membrane compartments containing mature viruses (B and D). In panel A, the right image (bar, 100 nm) corresponds to a higher magnification of the boxed area in the left image (bar, 1 μm). In panel B, the left and right images (bars, 1 μm) correspond to higher magnifications of the small and larger boxed areas in the middle image (bar, 1 μm), respectively. In panel C, the left and right images (bars, 100 nm) correspond to higher magnifications of the left and right boxed areas in the middle image (bar, 1 μm), respectively. In panel D, the right image (bar, 1 μm) corresponds to a higher magnification of the boxed area in the left image (bar, 1 μm). The bar in panel E is 100 nm. The images shown are representative of those obtained from analysis of MDMs from 3 independent donors.
FIG 5
FIG 5
Virus transfer to macrophages by cell fusion with infected T cells. (A and B) NLAD8-infected Jurkat (A) or primary CD4+ T (B) cells were cocultured with MDMs for 0.5, 2, or 6 h. After elimination of T cells, MDMs were stained with anti-Gag, phalloidin, and DAPI. Cells were analyzed by confocal microscopy, and the number of nuclei per cell was analyzed from images of at least 50 cells. The results are expressed as the percentage of cells with 1, 2, 3, or more than 3 nuclei (left) and as the mean nucleus number per cell (right). Error bars represent 1 SEM. Statistical significance was determined by the Mann-Whitney U test (ns, not significant [P > 0.05]; ***, P < 0.001; ****, P < 0.0001). (C and D) NLAD8-infected Jurkat cells that had been prelabeled with CellTracker were cocultured for 6 h with MDMs. (C) After elimination of T cells, MDMs were fixed, stained with anti-Gag, phalloidin, and DRAQ5, and analyzed by confocal microscopy. Bar, 25 μm. (D) The number of CellTracker-positive (CellTracker+) nuclei per cell was analyzed from images of at least 50 cells. The results are expressed as the percentage of cells with 1, 2, or more than 2 CellTracker-positive nuclei. (E and F) NLAD8-infected Jurkat cells that had been prelabeled with CellTracker were pretreated with anti-gp120 antibodies (PGT128 or 10-1074) or T20 for 1 h and cocultured with MDMs for 6 h in the presence of the inhibitors. Cells were then fixed, permeabilized, stained with anti-Gag, phalloidin, and DRAQ5, and analyzed by confocal microscopy. (E) Images were acquired and processed as described in the text. Bar, 25 μm. (F) The number of CellTracker-positive nuclei per DRAQ5-positive MDM was analyzed from images of at least 1,200 cells for each condition. The results are expressed as the fusion index, corresponding to the percentage of cells containing at least 1 CellTracker-positive nucleus relative to the number of NLAD8-infected Jurkat cells cocultured with MDMs without drugs with at least 1 CellTracker-positive nucleus. The results shown are representative of those from 4 independent experiments performed with MDMs from 4 donors. NI, noninfected Jurkat or primary CD4+ T cells cocultured with MDMs.
FIG 6
FIG 6
Macrophages express T cell-specific markers after fusion with infected T cells. NLAD8-infected Jurkat cells (A to F) or primary CD4+ T cells (G, H) were cocultured for 6 h with MDMs. After elimination of T cells, MDMs were stained with anti-CD2 (A and B) and anti-CD3 (G and H) before permeabilization. The cells were then permeabilized and stained with anti-Gag, anti-CD3 (C and D), anti-Lck (E and F), and DAPI. Representative images of cell surface CD2 (A), CD3 (C and G), and Lck (E) staining are shown. Bars, 25 μm. Cell surface CD2 (B) or CD3 (H) and intracellular CD3 (D) or Lck (F) mean fluorescence intensities were quantified as indicated in the Materials and Methods section. Each dot corresponds to 1 cell, and the number of cells analyzed (n) is indicated. Horizontal bars represent the mean ± 1 SEM. Statistical significance was determined by the Mann-Whitney U-test (****, P < 0.0001).
FIG 7
FIG 7
Viral dissemination between macrophages by homotypic cell fusion. (A to C) NLAD8-infected Jurkat cells were cocultured with MDMs for 6 h. After elimination of T cells, MDMs were cultured for 1 or 5 more days and then stained with anti-Gag, phalloidin, and DAPI. (A) Cells were analyzed by confocal microscopy. Bar, 25 μm. (B and C) The number of nuclei per MDM was quantified from images of at least 50 cells. The results are expressed as the percentage of cells with 1, 2, 3, or more than 3 nuclei (B) and as the mean nucleus number per cell (C). Error bars represent 1 SEM. Statistical significance was determined by the Mann-Whitney U-test (****, P < 0.0001). (D) Infected Jurkat cells were cocultured with MDMs for 6 h. After elimination of T cells, autologous MDMs prelabeled with CellTrace were added and cultured for 1 day. MDMs were then stained with anti-Gag, phalloidin, and DAPI. Cells were analyzed by confocal microscopy. Bar, 25 μm. (E) Infected Jurkat cells were cocultured with MDMs for 6 h. After elimination of T cells, MDMs were cultured for 1 day with or without T20 (10 μg/ml) or maraviroc (10 μM) before staining with anti-Gag, phalloidin, and DAPI. Cells were analyzed by confocal microscopy. The number of nuclei was analyzed from images of at least 50 cells. The results are expressed as the percentages of cells with 2, 3, or more than 3 nuclei. (F and G) Infected Jurkat cells were cocultured with MDMs for 6 h. After elimination of T cells, MDMs were cultured for 1, 5, 8, or 12 days with or without T20 (10 μg/ml). (F) The percentage of Gag+ MDMs was then evaluated by flow cytometry. (G) In parallel, culture supernatants from MDMs were collected and p24 was quantified. The results shown in panels A to E are representative of those from 4 independent experiments performed with MDMs from 4 donors, while the results shown in panels F and G correspond to the means from 3 independent experiments performed with MDMs from 3 donors. NI, noninfected Jurkat cells cocultured with MDMs.
FIG 8
FIG 8
Formation and survival of infected multinucleated giant cells. NLAD8-infected Jurkat cells were cocultured with MDMs for 6 h and eliminated, and MDMs were then cultured for the indicated periods of time. (A) Cells were fixed, permeabilized, and stained with anti-Gag, phalloidin, and DAPI. Cells were analyzed by confocal microscopy, and images were acquired and processed as described in the text. Bar, 25 μm. (B) Culture supernatants of MDMs were collected at the indicated days after coculture, and p24 was quantified. The results correspond to the means from 3 independent experiments. Error bars represent 1 SEM. Noninfected, noninfected Jurkat cells cocultured with MDMs.
FIG 9
FIG 9
Model for virus cell-to-cell transfer from infected T cells to MDMs and virus spreading between MDMs. Initial virus transfer and subsequent virus spreading are mediated by a two-step cell fusion process. In the first step, infected T cells establish contacts, initially discharge viral material to MDMs (step 1), and then fuse with MDM targets (step 2), with accumulation of viruses in intracytoplasmic compartments and virus assembly and budding at the cell surface. Gag+ newly formed LMFCs (step 3) then acquire the ability to fuse with surrounding uninfected MDMs, leading to the formation of Gag+ multinucleated giant cells (step 4) that could survive for a long time to produce infectious viruses (step 5).

Similar articles

Cited by

References

    1. Burdo TH, Lackner A, Williams KC. 2013. Monocyte/macrophages and their role in HIV neuropathogenesis. Immunol Rev 254:102–113. doi:10.1111/imr.12068. - DOI - PMC - PubMed
    1. Carter CA, Ehrlich LS. 2008. Cell biology of HIV-1 infection of macrophages. Annu Rev Microbiol 62:425–443. doi:10.1146/annurev.micro.62.081307.162758. - DOI - PubMed
    1. Harbison C, Zhuang K, Gettie A, Blanchard J, Knight H, Didier P, Cheng-Mayer C, Westmoreland S. 2014. Giant cell encephalitis and microglial infection with mucosally transmitted simian-human immunodeficiency virus SHIVSF162P3N in rhesus macaques. J Neurovirol 20:62–72. doi:10.1007/s13365-013-0229-z. - DOI - PMC - PubMed
    1. Tan J, Sattentau QJ. 2013. The HIV-1-containing macrophage compartment: a perfect cellular niche? Trends Microbiol 21:405–412. doi:10.1016/j.tim.2013.05.001. - DOI - PubMed
    1. Watters SA, Mlcochova P, Gupta RK. 2013. Macrophages: the neglected barrier to eradication. Curr Opin Infect Dis 26:561–566. doi:10.1097/QCO.0000000000000014. - DOI - PubMed

Publication types