. 2017 Nov 7;28(23):3271-3285.
doi: 10.1091/mbc.E17-06-0380. Epub 2017 Oct 4.

Polarity sorting of axonal microtubules: a computational study

Affiliations

Polarity sorting of axonal microtubules: a computational study

Erin M Craig et al. Mol Biol Cell. .

Abstract

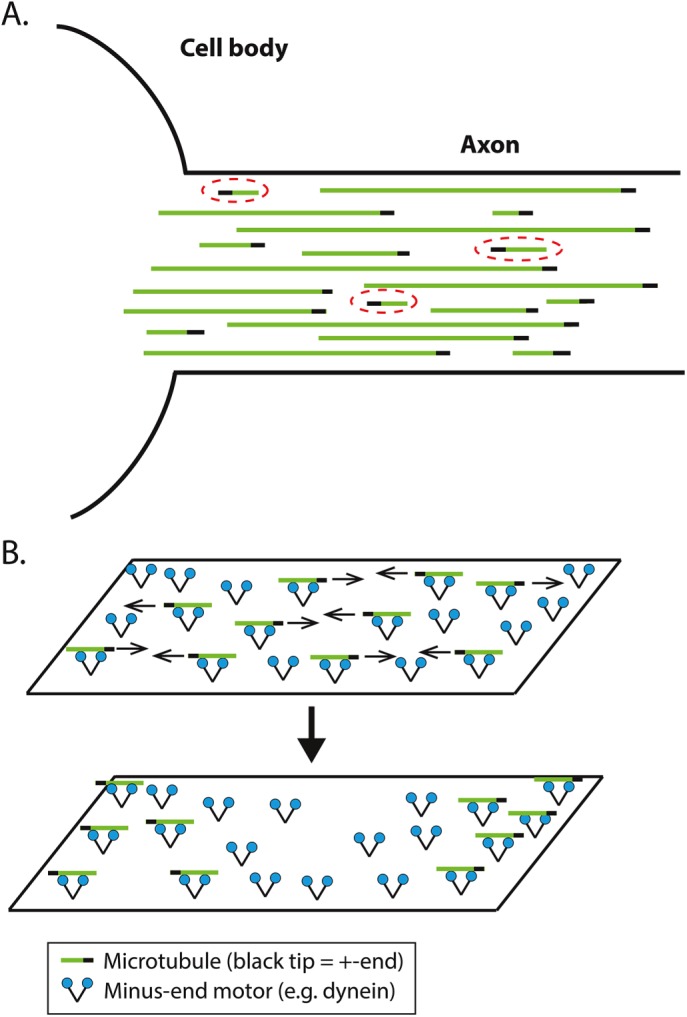
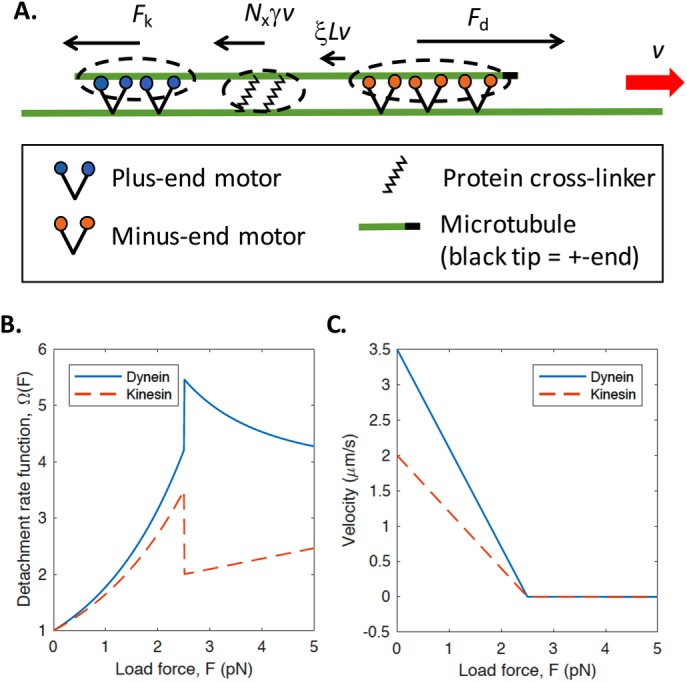
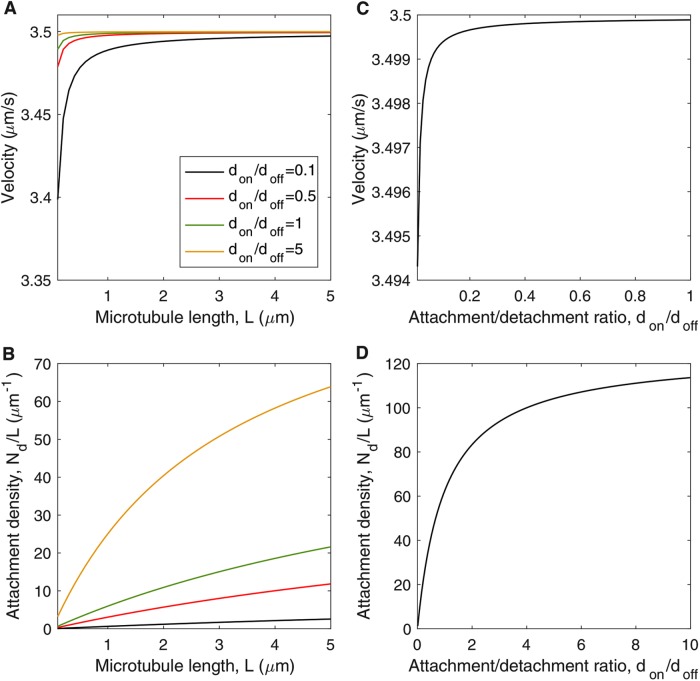
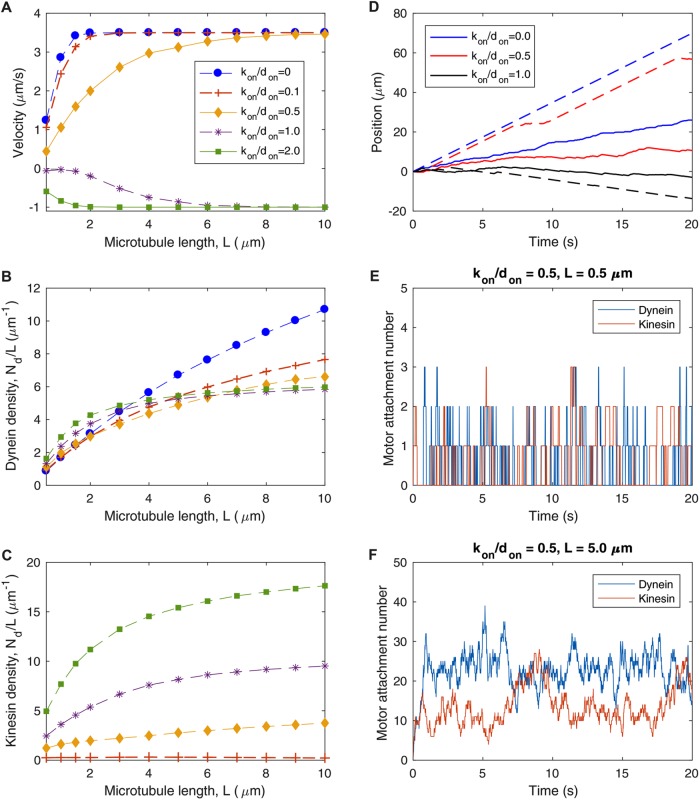
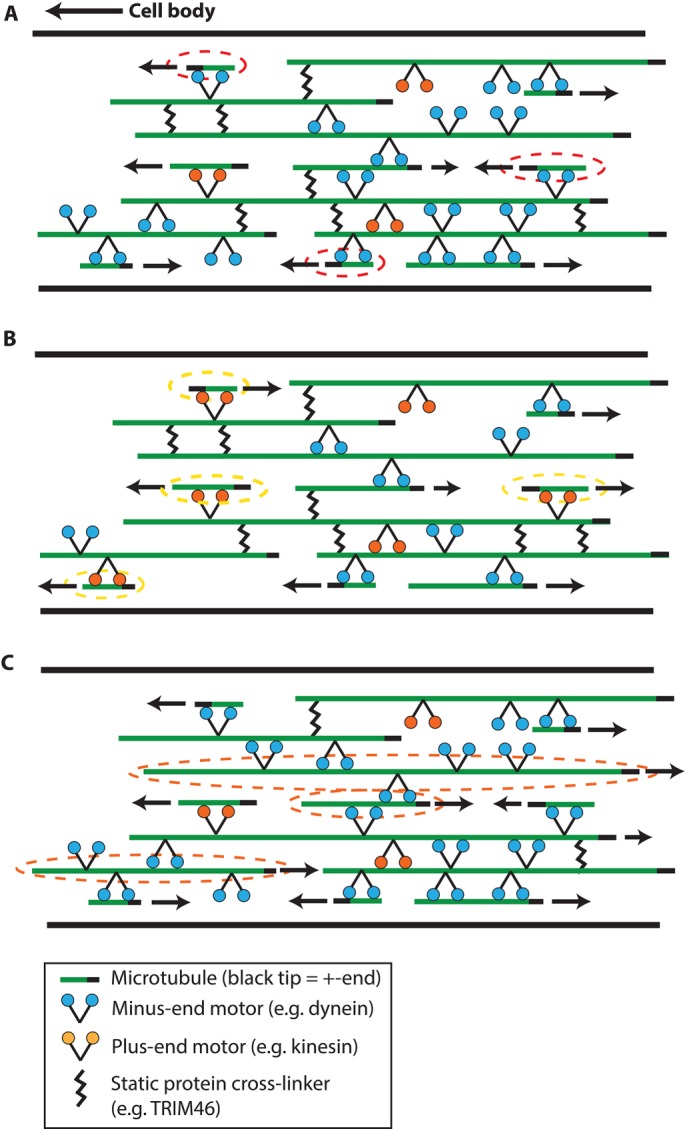
We present a computational model to test a "polarity sorting" mechanism for microtubule (MT) organization in developing axons. We simulate the motor-based axonal transport of short MTs to test the hypothesis that immobilized cytoplasmic dynein motors transport short MTs with their plus ends leading, so "mal-oriented" MTs with minus-end-out are transported toward the cell body while "correctly" oriented MTs are transported in the anterograde direction away from the soma. We find that dynein-based transport of short MTs can explain the predominately plus-end-out polarity pattern of axonal MTs but that transient attachments of plus-end-directed motor proteins and nonmotile cross-linker proteins are needed to explain the frequent pauses and occasional reversals observed in live-cell imaging of MT transport. Static cross-linkers increase the likelihood of a stalled "tug-of-war" between retrograde and anterograde forces on the MT, providing an explanation for the frequent pauses of short MTs and the immobility of longer MTs. We predict that inhibition of the proposed static cross-linker will produce disordered transport of short MTs and increased mobility of longer MTs. We also predict that acute inhibition of cytoplasmic dynein will disrupt the polarity sorting of MTs by increasing the likelihood of "incorrect" sorting of MTs by plus-end-directed motors.


Figures

FIGURE 1:
FIGURE 1:
(A) Schematic of MT polarity pattern in the axon. Green lines represent MTs and black tips represent the plus-end. Long MTs have a nearly uniform plus-end-out polarity pattern, while short MTs are occasionally oriented with minus-end-out (highlighted with red dashed line). (B) Schematic of motor-based polarity sorting of MTs in vitro. A minus-directed motor such as dynein transports MTs with their plus ends leading, giving rise to regions of uniform MT polarity.
FIGURE 2:
FIGURE 2:
Mechanical model of axonal MT motility. (A) Schematic of the molecular components of our computational model. Minus-end-directed motors such as cytoplasmic dynein (orange) are immobilized via their cargo domains to long axonal MTs (longer green line) and apply a force that slides a shorter MT in the direction with its plus end leading (plus-end indicated by black tip). Plus-end-directed motors such as kinesin-1 (blue) apply a force to the short MT in the opposite direction. Static cross-linkers (black, zigzag lines) stochastically cross-link MTs, increasing the effective viscous drag force opposing the motion of the short MT. When NdFsd > NkFsk, dynein motors are the primary drivers of motion, siding the MT with its plus end leading as illustrated here (red arrow). Black arrows indicate the direction and relative magnitude of forces acting on the MT, corresponding to the terms in Eq. 12. (B) Characteristic detachment rate functions described in Eqs. 4 and 8. (C) Linear load-velocity function as described in Eq. 11.
FIGURE 3:
FIGURE 3:
Dynein-based sliding of MTs: analytical solutions with input parameters from Table 1. (A) MT sliding velocity v as a function of MT length L, based on the positive root of Eq. 18 for several values of the dynein attachment ratio don/doff. (B) Steady-state dynein attachment density, Nd/L, as a function of MT length L corresponding to the velocity plots in A. (C) MT sliding velocity as a function of dynein attachment ratio don/doff, in the limit that sliding-based dissocation is negligible (L ≪ 2vfd / doff ≈ 19 μm; Eq. 20). (D) Steady-state dynein attachment density, Nd/L, as a function of attachment ratio don/doff in the limit that sliding-based dissociation is negligible (Eq. 19).
FIGURE 4:
FIGURE 4:
Competition between cytoplasmic dynein and kinesin-1 does not explain immobility of long axonal MTs. Parameters in Table 1, don = 0.1 s−1, and xon = 0 are used for all simulations. (A) Time-averaged velocity of MT transport as a function of MT length for various values of the ratio of kinesin attachment rate to dynein attachment rate, kon/don. (B) Average dynein attachment density, Nd/L, as a function of MT length L, for the same values of kon/don as in A. (C) Average kinesin attachment density, Nk/L, as a function of MT length L, for the same values of kon/don as in A. (D) Sample trajectories for several values of kon/don, with solid lines corresponding to short MTs of length L = 0.5 μm and dashed lines corresponding to longer MTs of length L = 5.0 μm. Solid lines and dashed lines of the same color correspond to the same kon/don, as specified in the legend. (E) Dynein and kinesin motor attachment numbers as a function of time for kon/don = 0.5 and L = 0.5 μm, corresponding to the solid red line in D. (F) Dynein and kinesin motor attachment numbers as a function of time for kon/don = 0.5 and L = 5.0 μm, corresponding to the dashed red line in D.
FIGURE 5:
FIGURE 5:
Static cross-linkers limit transport of longer MTs in the axon. Parameters in Table 1, don = 0.1 s−1, and kon = 0.01 s−1 are used for all simulations. Legend in B applies to all panels. (A) Time-averaged velocity of MT transport as a function of MT length for several values of the ratio of cross-linker attachment rate to dynein attachment rate xon/don. (B) Average number of cytoplasmic dynein motors attached to the MT as a function of MT length. (C) Average number of kinesin-1 motors attached to the MT as a function of MT length. (D) Average number of static cross-linkers attached to the MT as a function of MT length. (E) Average load force experienced by each of the attached cytoplasmic dynein motors as a function of MT length. Note that the dynein stall force in the simulations is 2.5 pN (Table 1). (F) Fraction of the time the MT spends paused as a function of MT length. A MT is considered “paused” if it moves less than 0.65 μm/s. This criterion for pauses is chosen to facilitate comparison between the model and fluorescence imaging of axonal MTs in photobleach experiments, where typical experimental resolution limits do not allow detection of movement below this threshold.
FIGURE 6:
FIGURE 6:
Static cross-linkers increase likelihood of stalled “tug-of-war” between opposing motors. (A) Sample MT trajectories in the absence of static cross-linkers (xon = 0), showing position as a function of time. Parameters: don = 0.1 s−1, kon = 0.01 s−1, Table 1. Legend applies to A and B. (B) Sample MT trajectories in the presence of static cross-linkers (xon = 0.003 s−1). (C) Bivariate histogram of the attachment numbers of cytoplasmic dynein and kinesin-1 for a 1 μm MT in the absence of cross-linkers (corresponding to the dashed blue line in A). (D) Bivariate histogram of the attachment numbers of cytoplasmic dynein and kinesin-1 for a 10-μm MT in the absence of cross-linkers (corresponding to the solid red line in A). (E) Top: Histogram of dynein and kinesin attachment numbers for a 1-μm MT in the presence of cross-linkers (corresponding to the dashed blue line in B). Bottom: Histogram of dynein and cross-linker attachment numbers for the same trajectory. (F) Histogram of dynein and kinesin attachment (top) and corresponding histogram of dynein and cross-linker attachment (bottom) for a 10-μm MT in the presence of cross-linkers (corresponding to the solid red line in B)
FIGURE 7:
FIGURE 7:
Inhibition of dynein allows kinesin to play more prominent role in MT transport. Parameters from Table 1, L = 2 μm, xon = 0.003 s−1, and kon = 0.01 s−1 except where indicated otherwise. (A) Time-averaged velocity as a function of the ratio of kinesin attachment rate to dynein attachment rate (kon/don) for several values of the kinesin attachment rate: kon = 0.1 s−2 (green “+” symbols), kon = 0.01 s−1 (red “*” symbols), and kon = 0.001 s−1 (blue circles). For each data set, the kon/don ratio is increased by reducing the dynein attachment rate, don, while keeping kon constant, mimicking experimental inhibition of cytoplasmic dynein activity. Inset: Sample trajectories corresponding to kon = 0.01 s−1 are shown for kon/don = 0.1 (blue), kon/don = 0.3 (red), and kon/don = 0.5 (green). (B) Average attachment numbers of cytoplasmic dynein, kinesin-1, and static cross-linkers as a function of kon/don. (C) Histogram of instantaneous attachment numbers of dynein and kinesin. (D) Fraction of time MT spends paused, moving in the anterograde direction, and moving in the retrograde direction as a function of kon/don, with a fixed kinesin attachment rate, kon = 0.01 s−1. (E) Fraction of time MT spends paused, moving in the anterograde direction, and moving in the retrograde direction as a function of kon, with a fixed ratio kon/don = 0.1.
FIGURE 8:
FIGURE 8:
Dynein inhibition disrupts the establishment of plus-end-out MT polarity pattern. Parameters from Table 1, L = 2 μm, xon = 0.003 s−1, kon = 0.01 s−1. Distributions of plus-end-out MTs (blue) and minus-end-out MTs (red) for several values of kon/don evolve over time. Each simulation has an initial distribution of 90 plus-end-out MTs and 10 minus-end-out MTs evenly distributed between x = 0 and x = 10 μm at time t = 0. (A) MT distribution for high dynein activity level (kon/don = 0.1) at times t = 2 s (left), t = 5 s (middle), and t = 10 s (right). (B) MT distribution for kon/don = 0.3 at times t = 2 s (left), t = 5 s (middle), and t = 10 s (right). (C) MT distribution for kon/don = 0.5 at times t = 2 s (left), t = 5 s (middle), and t = 10 s (right).
FIGURE 9:
FIGURE 9:
Schematic summarizing current model of polarity sorting mechanism in axons. (A) Control conditions. We predict that when dynein is the primary driver of MT movement, MTs are sorted according to their polarity orientation with plus-end-out MTs usually moving distal (to the right in the figure) and minus-end-out MTs (indicated with red dashed circles) being transported toward the cell body and cleared from the axon. We posit that static cross-linkers prevent movement of longer MTs, and that MTs are occasionally mis-sorted by plus-directed motors. (B) Dynein inhibition. Inhibition of dynein disrupts the polarity sorting mechanism by increasing the likelihood that a plus-directed motor such as kinesin-1 transports an MT in the “incorrect” direction, with its minus end leading (indicated with yellow dashed circles). (C) Cross-linker inhibition. When the density of static cross-linkers is depleted, this leads to increased mobility of longer MTs (indicated with orange dashed circles).

Similar articles

Cited by

References

    1. Ahmad FJ, He Y, Myers KA, Hasaka TP, Francis F, Black MM, Baas PW. Effects of dynactin disruption and dynein depletion on axonal microtubules. Traffic. 2006;7:524–537. - PubMed
    1. Alper JD, Tovar M, Howard J. Displacement-weighted velocity analysis of gliding assays reveals that Chlamydomonas axonemal dynein preferentially moves conspecific microtubules. Biophys J. 2013;104:1989–1998. - PMC - PubMed
    1. Baas PW. Microtubule stability in the axon: new answers to an old mystery. Neuron. 2013;78:3–5. - PubMed
    1. Baas PW, Lin S. Hooks and Comets: The story of microtubule polarity orientation in the neuron. Devel Neurobiol. 2011;71:403–418. - PMC - PubMed
    1. Baas PW, Mozgova OI. A novel role for retrograde transport of microtubules in the axon. Cytoskeleton. 2012;69:416–425. - PubMed

LinkOut - more resources