

Rapid pathogen-specific phenotypic antibiotic susceptibility testing using digital LAMP quantification in clinical samples
- PMID: 28978750
- PMCID: PMC6765391
- DOI: 10.1126/scitranslmed.aal3693
Rapid pathogen-specific phenotypic antibiotic susceptibility testing using digital LAMP quantification in clinical samples
Abstract
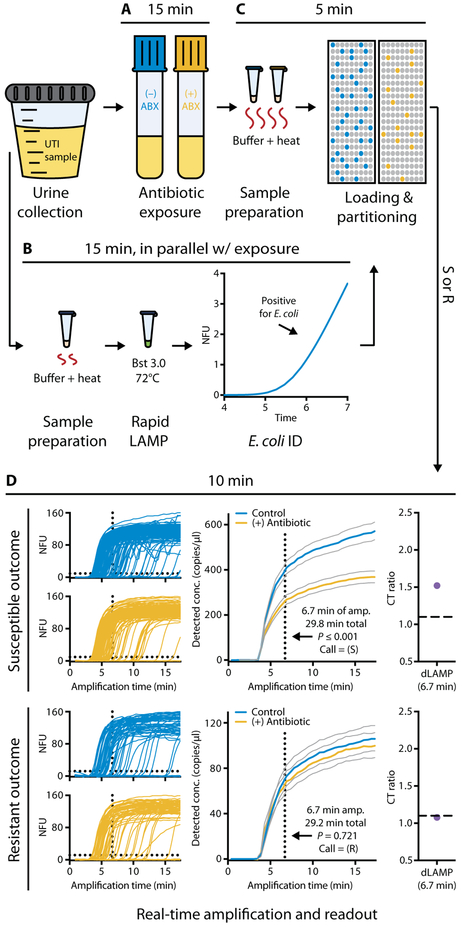
Rapid antimicrobial susceptibility testing (AST) is urgently needed for informing treatment decisions and preventing the spread of antimicrobial resistance resulting from the misuse and overuse of antibiotics. To date, no phenotypic AST exists that can be performed within a single patient visit (30 min) directly from clinical samples. We show that AST results can be obtained by using digital nucleic acid quantification to measure the phenotypic response of Escherichia coli present within clinical urine samples exposed to an antibiotic for 15 min. We performed this rapid AST using our ultrafast (~7 min) digital real-time loop-mediated isothermal amplification (dLAMP) assay [area under the curve (AUC), 0.96] and compared the results to a commercial (~2 hours) digital polymerase chain reaction assay (AUC, 0.98). The rapid dLAMP assay can be used with SlipChip microfluidic devices to determine the phenotypic antibiotic susceptibility of E. coli directly from clinical urine samples in less than 30 min. With further development for additional pathogens, antibiotics, and sample types, rapid digital AST (dAST) could enable rapid clinical decision-making, improve management of infectious diseases, and facilitate antimicrobial stewardship.
Copyright © 2017 The Authors, some rights reserved; exclusive licensee American Association for the Advancement of Science. No claim to original U.S. Government Works.
Conflict of interest statement
Competing interests:
R.F.I., T.S.S., M.S.C., and N.G.S. are inventors on a patent (PCT/US2015/059344) filed by Caltech and SlipChip Corp. and on provisional patent applications 62/399,196 and 62/460,625 filed by Caltech that cover devices and methods for rapid digital antibiotic susceptibility testing. R.F.I. has a financial interest in SlipChip Corp. and is a consultant for SlipChip Corp.
Figures


Similar articles
-
A rapid and simple detection method for phenotypic antimicrobial resistance in Escherichia coli by loop-mediated isothermal amplification.J Med Microbiol. 2019 Feb;68(2):169-177. doi: 10.1099/jmm.0.000903. Epub 2019 Jan 9. J Med Microbiol. 2019. PMID: 30624176
-
Integrated Biosensor Assay for Rapid Uropathogen Identification and Phenotypic Antimicrobial Susceptibility Testing.Eur Urol Focus. 2017 Apr;3(2-3):293-299. doi: 10.1016/j.euf.2015.12.010. Epub 2016 Jan 15. Eur Urol Focus. 2017. PMID: 28753748 Free PMC article.
-
A Self-Calibrating Chemiluminescence Sensor for Rapid and Precise Antibiotic Prescribing Guidelines on Urinary Tract Infections.ACS Sens. 2025 Mar 28;10(3):2203-2211. doi: 10.1021/acssensors.4c03503. Epub 2025 Mar 7. ACS Sens. 2025. PMID: 40052751
-
Phenotypic antibiotic susceptibility testing of pathogenic bacteria using photonic readout methods: recent achievements and impact.Appl Microbiol Biotechnol. 2019 Jan;103(2):549-566. doi: 10.1007/s00253-018-9505-4. Epub 2018 Nov 15. Appl Microbiol Biotechnol. 2019. PMID: 30443798 Review.
-
Rapid Susceptibility Testing Methods.Clin Lab Med. 2019 Sep;39(3):333-344. doi: 10.1016/j.cll.2019.04.001. Epub 2019 Jun 12. Clin Lab Med. 2019. PMID: 31383260 Free PMC article. Review.
Cited by
-
Rapid Determination of Antimicrobial Susceptibility by Stimulated Raman Scattering Imaging of D2O Metabolic Incorporation in a Single Bacterium.Adv Sci (Weinh). 2020 Aug 16;7(19):2001452. doi: 10.1002/advs.202001452. eCollection 2020 Oct. Adv Sci (Weinh). 2020. PMID: 33042757 Free PMC article.
-
Beating the reaction limits of biosensor sensitivity with dynamic tracking of single binding events.Proc Natl Acad Sci U S A. 2019 Mar 5;116(10):4129-4134. doi: 10.1073/pnas.1815329116. Epub 2019 Feb 19. Proc Natl Acad Sci U S A. 2019. PMID: 30782809 Free PMC article.
-
Surfactant-enhanced DNA accessibility to nuclease accelerates phenotypic β-lactam antibiotic susceptibility testing of Neisseria gonorrhoeae.PLoS Biol. 2020 Mar 19;18(3):e3000651. doi: 10.1371/journal.pbio.3000651. eCollection 2020 Mar. PLoS Biol. 2020. PMID: 32191696 Free PMC article.
-
Single-cell pathogen diagnostics for combating antibiotic resistance.Nat Rev Methods Primers. 2023;3:6. doi: 10.1038/s43586-022-00190-y. Epub 2023 Feb 2. Nat Rev Methods Primers. 2023. PMID: 39917628 Free PMC article.
-
A WS2-gold nanoparticle heterostructure-based novel SERS platform for the rapid identification of antibiotic-resistant pathogens.Nanoscale Adv. 2020 Mar 31;2(5):2025-2033. doi: 10.1039/d0na00141d. eCollection 2020 May 19. Nanoscale Adv. 2020. PMID: 36132493 Free PMC article.
References
-
- Laxminarayan R, Duse A, Wattal C, Zaidi AKM, Wertheim HFL, Sumpradit N, Vlieghe E, Hara GL, Gould IM, Goossens H, Greko C, So AD, Bigdeli M, Tomson G, Woodhouse W, Ombaka E, Peralta AQ, Qamar FN, Mir F, Kariuki S, Bhutta ZA, Coates A, Bergstrom R, Wright GD, Brown ED, Cars O, Antibiotic resistance—The need for global solutions. Lancet Infect. Dis 13, 1057–1098 (2013). - PubMed
-
- O’Neill J, Tackling drug-resistant infections globally: Final report and recommendations (2016); https://amr-review.org/Publications.html.
-
- O’Neill J, Rapid diagnostics: Stopping unnecessary use of antibiotics (2015); https://amr-review.org/Publications.html.
-
- Cosgrove SE, The relationship between antimicrobial resistance and patient outcomes: Mortality, length of hospital stay, and health care costs. Clin. Infect. Dis 42 (suppl. 2), S82–S89 (2006). - PubMed
-
- Perez KK, Olsen RJ, Musick WL, Cernoch PL, Davis JR, Land GA, Peterson LE, Musser JM, Integrating rapid pathogen identification and antimicrobial stewardship significantly decreases hospital costs. Arch. Pathol. Lab. Med 137, 1247–1254 (2013). - PubMed
MeSH terms
Substances
Grants and funding
LinkOut - more resources
Full Text Sources
Other Literature Sources
Medical
