. 2018 Jan 1;119(1):73-83.
doi: 10.1152/jn.00382.2017. Epub 2017 Oct 4.

Convergence of linear acceleration and yaw rotation signals on non-eye movement neurons in the vestibular nucleus of macaques

Affiliations

Convergence of linear acceleration and yaw rotation signals on non-eye movement neurons in the vestibular nucleus of macaques

Shawn D Newlands et al. J Neurophysiol. .

Abstract

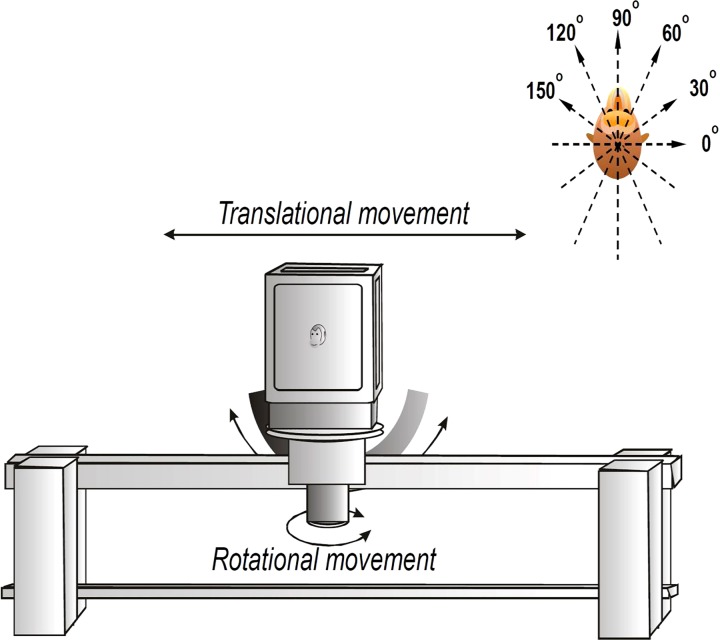
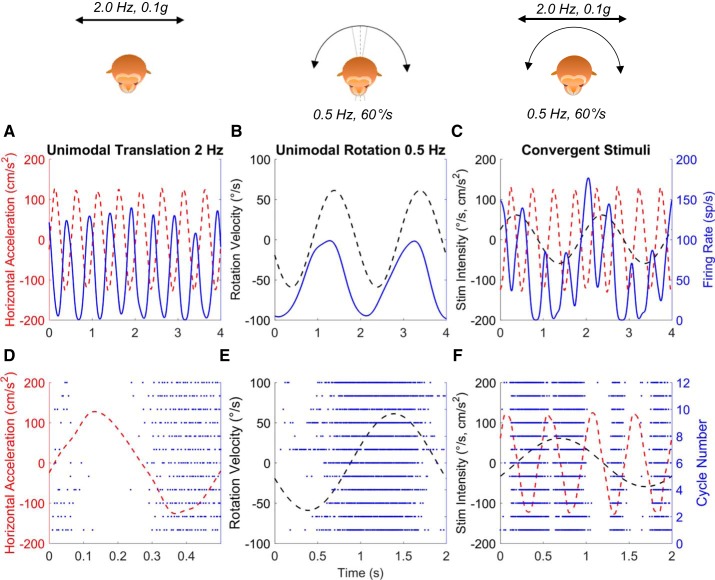
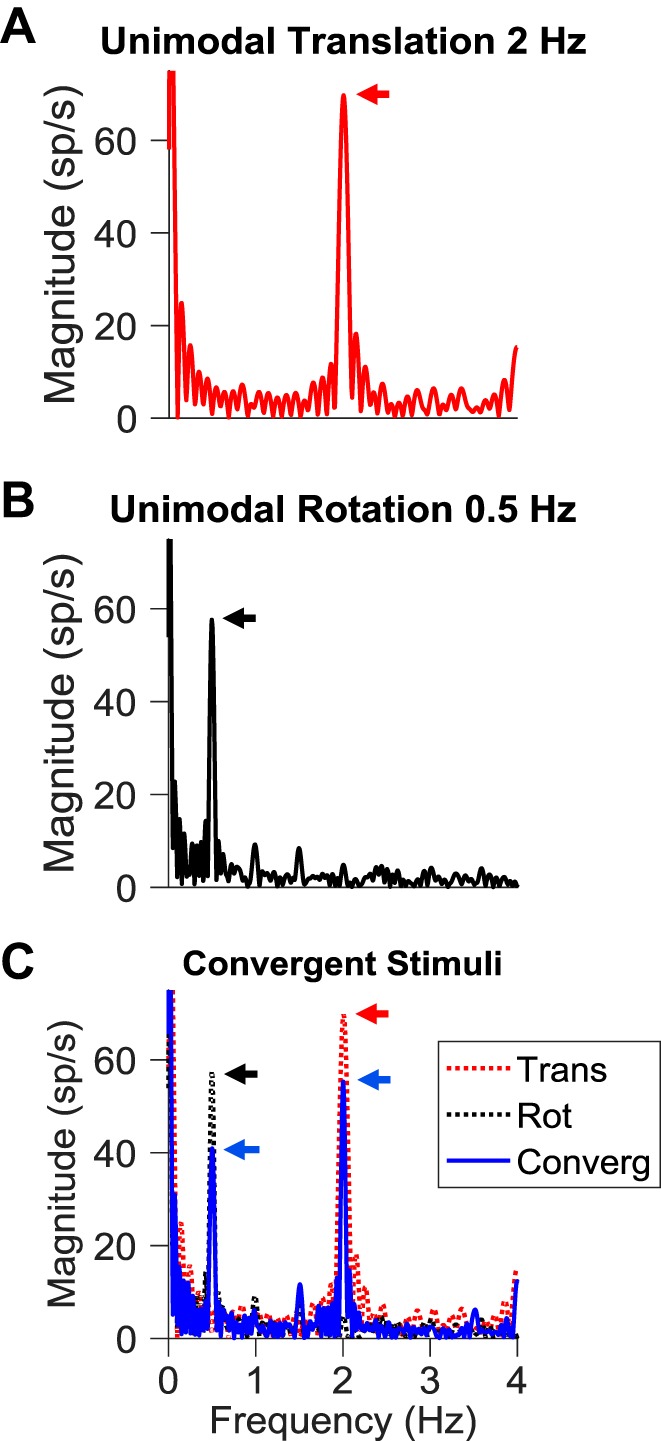
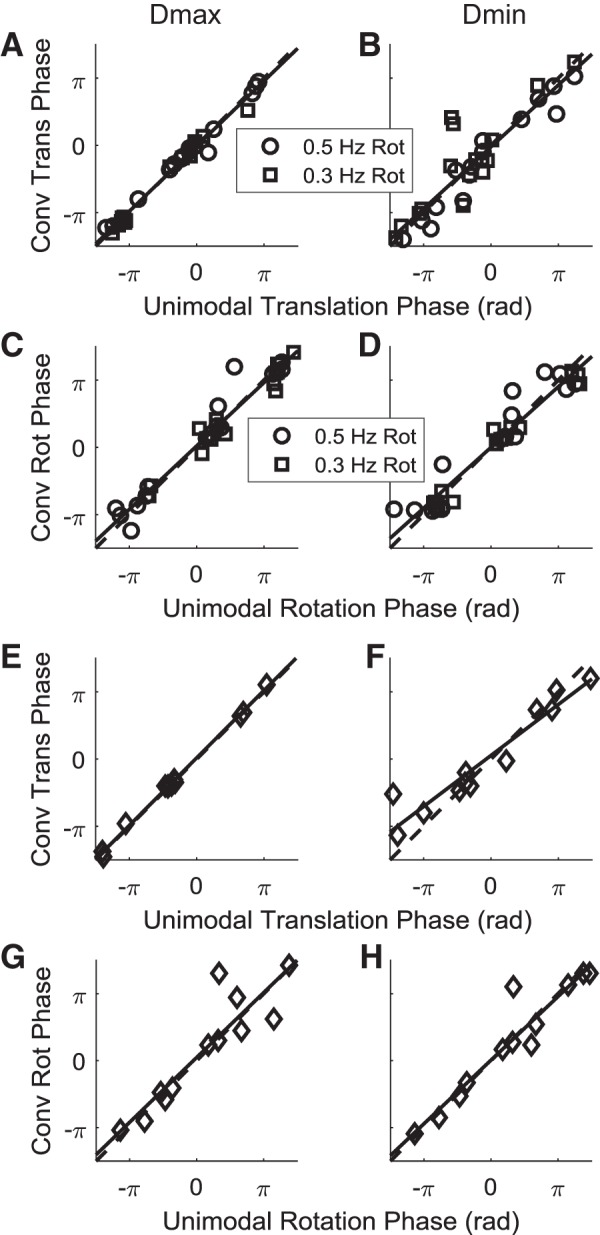
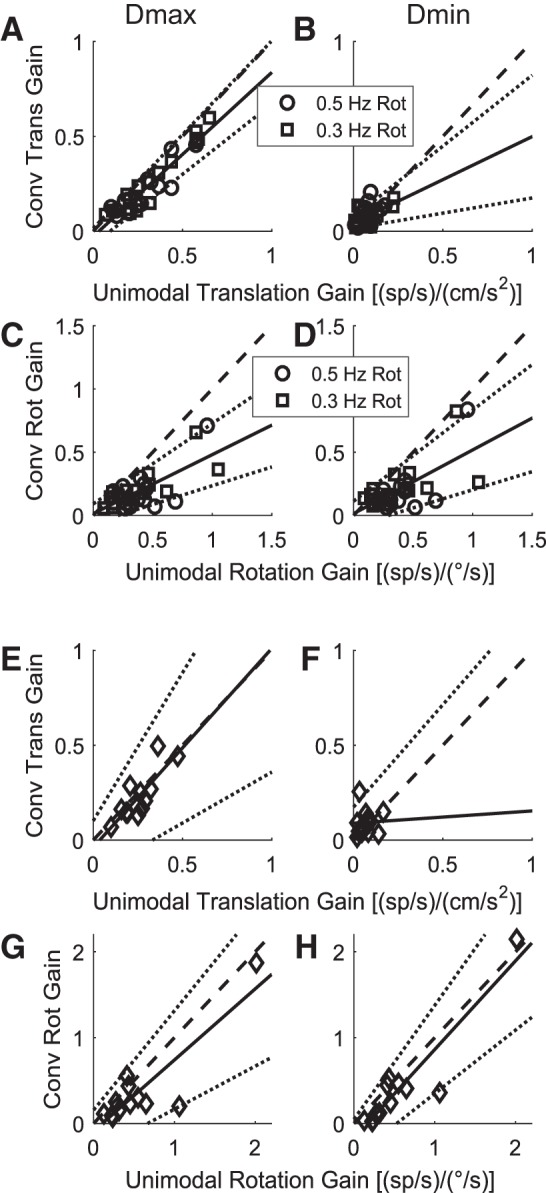
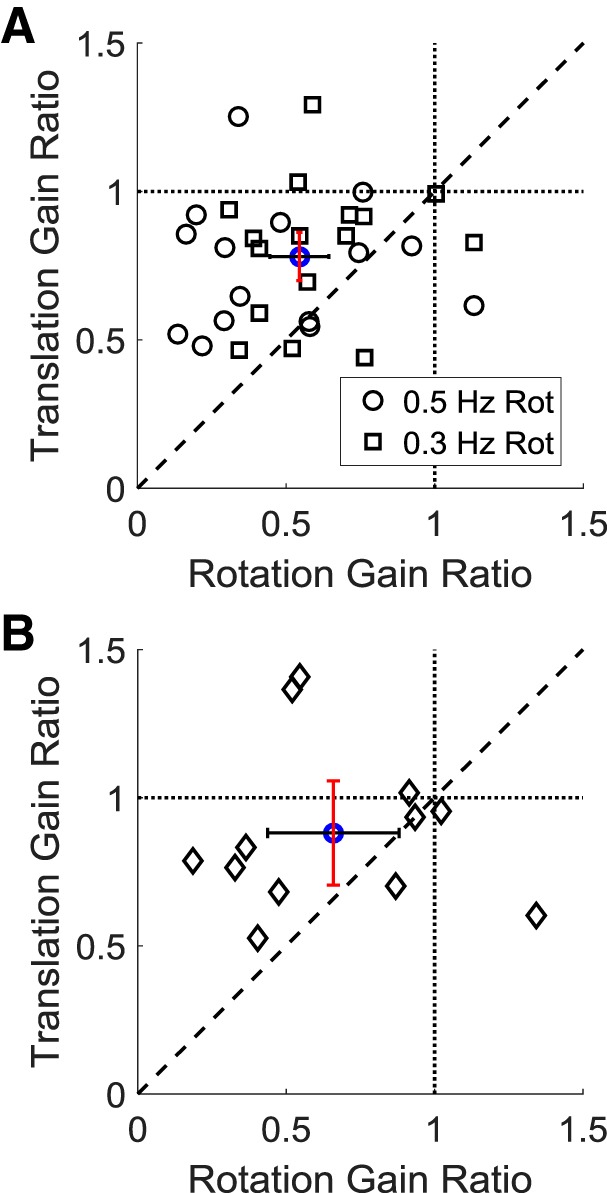
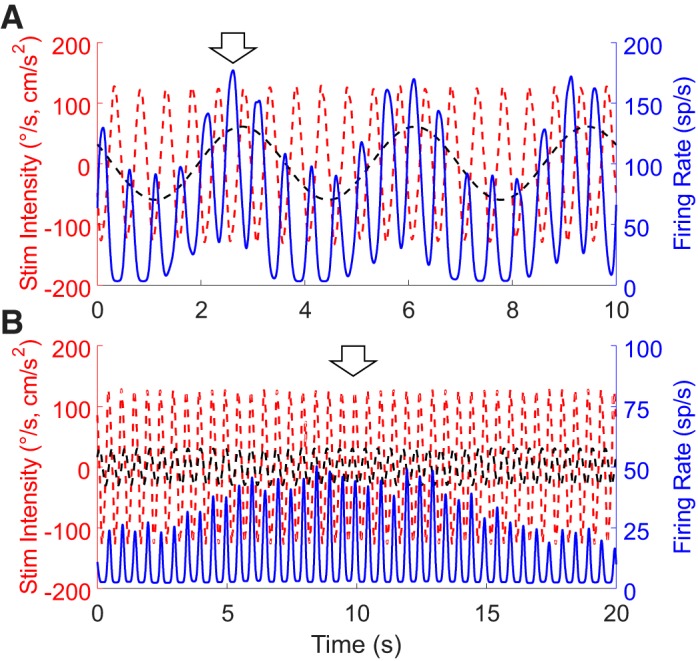
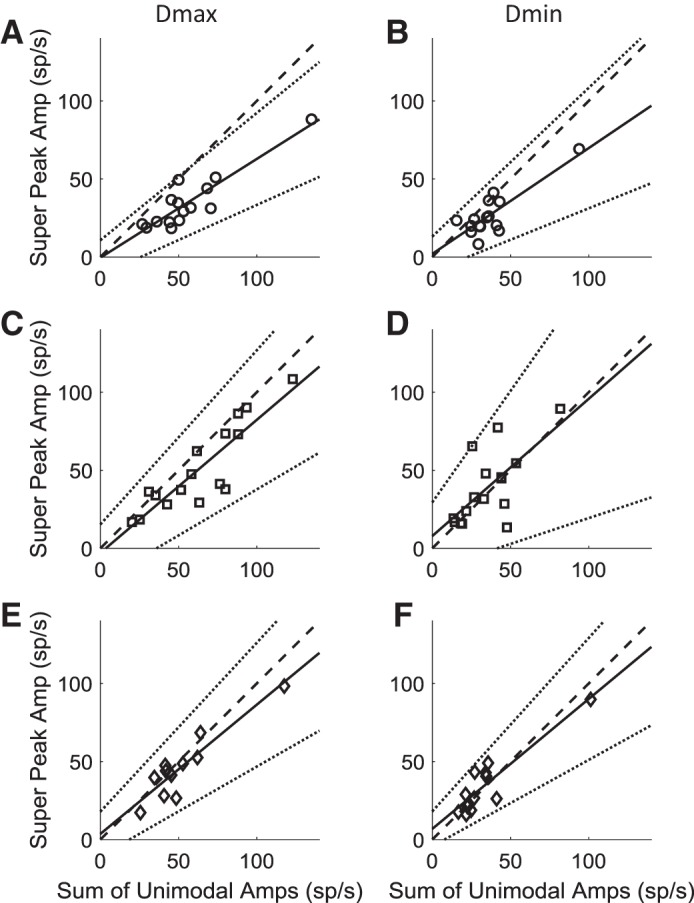
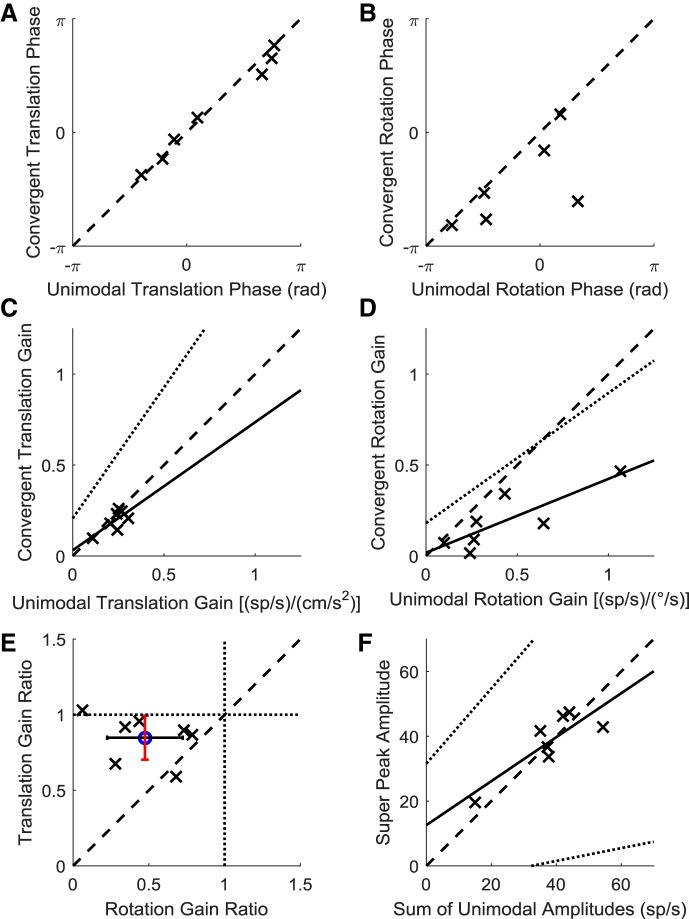
Roughly half of all vestibular nucleus neurons without eye movement sensitivity respond to both angular rotation and linear acceleration. Linear acceleration signals arise from otolith organs, and rotation signals arise from semicircular canals. In the vestibular nerve, these signals are carried by different afferents. Vestibular nucleus neurons represent the first point of convergence for these distinct sensory signals. This study systematically evaluated how rotational and translational signals interact in single neurons in the vestibular nuclei: multisensory integration at the first opportunity for convergence between these two independent vestibular sensory signals. Single-unit recordings were made from the vestibular nuclei of awake macaques during yaw rotation, translation in the horizontal plane, and combinations of rotation and translation at different frequencies. The overall response magnitude of the combined translation and rotation was generally less than the sum of the magnitudes in responses to the stimuli applied independently. However, we found that under conditions in which the peaks of the rotational and translational responses were coincident these signals were approximately additive. With presentation of rotation and translation at different frequencies, rotation was attenuated more than translation, regardless of which was at a higher frequency. These data suggest a nonlinear interaction between these two sensory modalities in the vestibular nuclei, in which coincident peak responses are proportionally stronger than other, off-peak interactions. These results are similar to those reported for other forms of multisensory integration, such as audio-visual integration in the superior colliculus. NEW & NOTEWORTHY This is the first study to systematically explore the interaction of rotational and translational signals in the vestibular nuclei through independent manipulation. The results of this study demonstrate nonlinear integration leading to maximum response amplitude when the timing and direction of peak rotational and translational responses are coincident.

Keywords: brain stem; multisensory integration; otolith; semicircular canal; single-unit recording.


Figures

Fig. 1.
Fig. 1.
Schematic representation of the test apparatus in these experiments. For the data reported here, the tilt axis was not used. Inset: directions of translation relative to the head. The direction of translation was changed by rotating the chair to realign the linear axis relative to the head. Because we used sine waves, the stimuli serve for 2 directions (0° and 180° are the same stimulus, just referenced to the peak in the opposite direction).
Fig. 2.
Fig. 2.
Response of an example neuron recorded during translation at 2.0 Hz with peak acceleration of 0.1 g (A and D), rotation at 0.5 Hz with peak velocity of 60°/s (B and E), and combined rotation and translation at the same frequencies and amplitudes (C and F). In this example, the orientation during translation was 0°. The orientation of maximum translational sensitivity (Dmax) for this neuron was 180° (acceleration to the left ear), thus the response is out of phase with the stimulus (up is right for both translation and rotation). In A–C, the stimulus and response, Gaussian filtered with a cutoff frequency of 4 Hz, are shown for 4 s of representative data for each of the 3 stimuli. In D–F, spike times for 12 cycles of representative data are represented by blue dots overlying 1 cycle of translation (D) or rotation (E) or 4 cycles of translation with 1 cycle of rotation (F). All x-axes have units of seconds.
Fig. 3.
Fig. 3.
Magnitude spectra of the instantaneous firing rates of the neuron in Fig. 2. The spectral magnitudes in the convergent stimulus (C) can be directly compared with magnitudes for each unimodal response (translation and rotation; these are the same tracings as the solid lines in A and B). In this example, the rotation and translation components of the convergent response were attenuated.
Fig. 4.
Fig. 4.
Phases of the unimodal trials and the convergent trials were derived by fitting sinusoids to the stimuli and instantaneous firing rates. Both axes are in radians. A–D: 15 neurons are included for convergent trials at 0.5-Hz rotation and 2.0-Hz translation and 16 neurons for at 0.3-Hz rotation and 2.0-Hz translation. Translation phase (A and B) and rotation phase (C and D) were preserved during most convergent trials, at both Dmax (A and C) and Dmin (B and D) orientations. The scatter in the Dmin plot for translation reflects the low gains for translation in this orientation. E–H: the translation frequency was 0.3 Hz, and the rotation frequency was 2.0 Hz (n = 12). Translation phase (E and F) and rotation phase (G and H) were preserved during most convergent trials, at both Dmax (E and G) and Dmin (F and H) orientations.
Fig. 5.
Fig. 5.
Magnitudes of responses at each stimulus frequency for unimodal compared with bimodal trials with the DFT at stimulus frequencies. Dashed line, unity; solid line, regression to data; dotted lines, 95% confidence interval for regression fit. Same trials as in Fig. 4. A–D: in these trials, the rotation is at either 0.3 or 0.5 Hz and the translation is at 2.0 Hz. Regression slopes: A = 0.86; B = 0.45; C = 0.47; D = 0.50. E–H: in these trials, the rotation was at 2.0 Hz and the translation was at 0.3 Hz. Regression slopes: E = 1.0; F = 0.07; G = 0.83; H = 1.0.
Fig. 6.
Fig. 6.
Ratio of the magnitude of responses during bimodal stimulation to those during unimodal stimulation for translation (y-axis) and rotation (x-axis). Error bars show 95th percentile confidence interval for the mean. Same trials as Figs. 4 and 5. A: for trials with translation at 2.0 Hz and rotation at 0.3 or 0.5 Hz. B: for trials with rotation at 2.0 Hz and translation at 0.3 Hz.
Fig. 7.
Fig. 7.
A: convergent trial with translation at 2.0 Hz, rotation at 0.3 Hz, and peak velocity at 60°/s. Red dashed line, linear acceleration; black dashed line, yaw angular velocity; blue solid line, Gaussian-filtered average firing rate over 50 s of data. Arrow indicates time when the relationship between translation and rotation is such that the peaks of the rotational and translational responses should best align. In this neuron, the unimodal rotation response leads angular velocity by 0.59 rad (34°) and the unimodal translation response leads linear acceleration by 2.76 rad (158°). B: convergent trial with translation at 2.0 Hz and rotation at 2.05 Hz. Same conventions as in A, except that in these trials 80 s of data was averaged. In this neuron, unimodal rotation response lags angular velocity by 1.59 rad (91°) and lags linear acceleration by 0.37 rad (21°).
Fig. 8.
Fig. 8.
Comparison of the superpeak magnitude (peak firing rate for epochs of data − mean firing rate for the same epochs) for the convergent responses (y-axis) to the sum of the peak magnitudes for the same neuron at the same frequencies and amplitudes of stimulation for the unimodal stimuli independently. The raw instantaneous firing rate was averaged for epochs of data covering all of the potential phase relationships for the data (see text: 2 s for 2.0 and 0.5 Hz combination and 10 s for 2.0 and 0.3 Hz combinations) and smoothed with a Gaussian filter with a cutoff at 4 Hz before determination of superpeak magnitude. Dashed line, unity; solid line, regression to data; dotted lines, 95% confidence interval for regression fit. A, C, and E: responses when the translation was delivered in the orientation closest to Dmax. B, D, and F: translation delivered closest to Dmin. Same trials as Figs. 4–6. A and B: translation at 2.0 Hz and rotation at 0.5 Hz. Slope: 0.63 (A), 0.68 (B). C and D: translation at 2.0 Hz and rotation at 0.3 Hz. Slope: 0.85 (C), 0.88 (D). E and F: translation at 0.3 Hz and rotation at 2.0 Hz. Slope: 0.83 (E), 0.83 (F).
Fig. 9.
Fig. 9.
A and B: phase relationship between the rotation (A) and translation (B) stimuli and responses for unimodal trials (at 2.0 Hz, x-axis) and bimodal trials (2.05-Hz rotation, 2.0-Hz translation, y-axis). In both axes units are radians. Conventions as in Fig. 4. n = 7. C and D: magnitudes of responses at each stimulus frequency for unimodal compared with bimodal trials with the DFT at stimulus frequencies (2.05-Hz translation, 2.0-Hz rotation). Units are the same in both axes [(sp/s)/(cm/s2) in C, (sp/s)/(°/s) in D]. Conventions as in Fig. 5. Regression slope 0.7 in C and 0.41 in D. E: ratio of the magnitude of responses during bimodal stimulation to those during unimodal stimulation for translation (y-axis) and rotation (x-axis). Confidence intervals and lines as in Fig. 6. F: comparison of the superpeak magnitude (maximum firing rate – baseline firing rate over 20-s epochs of data) for the convergent responses (y-axis) to the sum of the unimodal magnitudes at 2.0 Hz for the same neurons. Conventions as in Fig. 7. Regression slope = 0.68.

Similar articles

Cited by

References

    1. Angelaki DE. Spatio-temporal convergence (STC) in otolith neurons. Biol Cybern 67: 83–96, 1992. doi:10.1007/BF00201805. - DOI - PubMed
    1. Angelaki DE. Generation of two-dimensional spatial and temporal properties through spatiotemporal convergence between one-dimensional neurons. IEEE Trans Biomed Eng 40: 686–692, 1993. doi:10.1109/10.237698. - DOI - PubMed
    1. Angelaki DE, Bush GA, Perachio AA. Two-dimensional spatiotemporal coding of linear acceleration in vestibular nuclei neurons. J Neurosci 13: 1403–1417, 1993. - PMC - PubMed
    1. Angelaki DE, Dickman JD. Spatiotemporal processing of linear acceleration: primary afferent and central vestibular neuron responses. J Neurophysiol 84: 2113–2132, 2000. - PubMed
    1. Angelaki DE, Klier EM, Snyder LH. A vestibular sensation: probabilistic approaches to spatial perception. Neuron 64: 448–461, 2009. doi:10.1016/j.neuron.2009.11.010. - DOI - PMC - PubMed

Publication types

LinkOut - more resources