. 2018 Jan 1;119(1):96-117.
doi: 10.1152/jn.00550.2017. Epub 2017 Oct 4.

State-dependent rhythmogenesis and frequency control in a half-center locomotor CPG

Affiliations

State-dependent rhythmogenesis and frequency control in a half-center locomotor CPG

Jessica Ausborn et al. J Neurophysiol. .

Erratum in

  • Corrigendum.
    [No authors listed] [No authors listed] J Neurophysiol. 2018 Mar 1;119(3):1248-1250. doi: 10.1152/jn.z9k-4583-corr.2018. J Neurophysiol. 2018. PMID: 29537355 Free PMC article. No abstract available.

Abstract

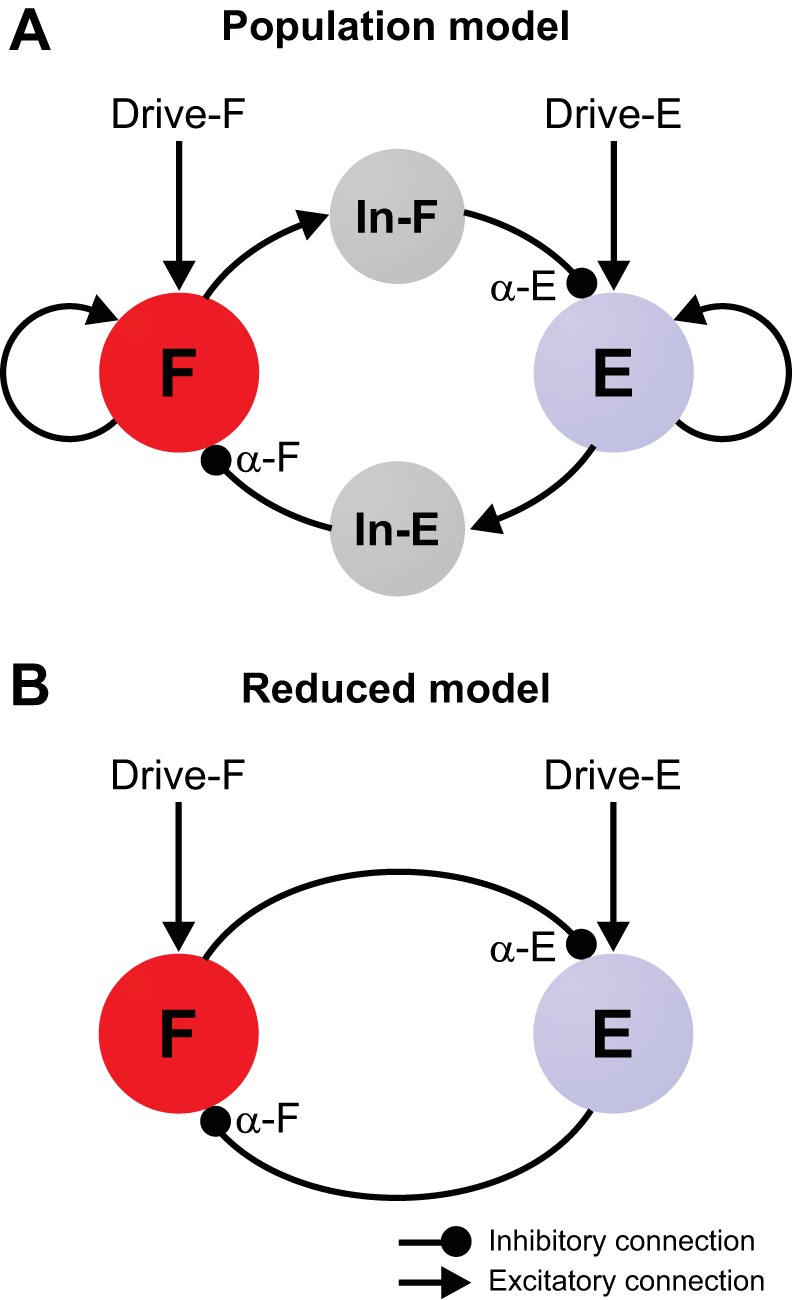
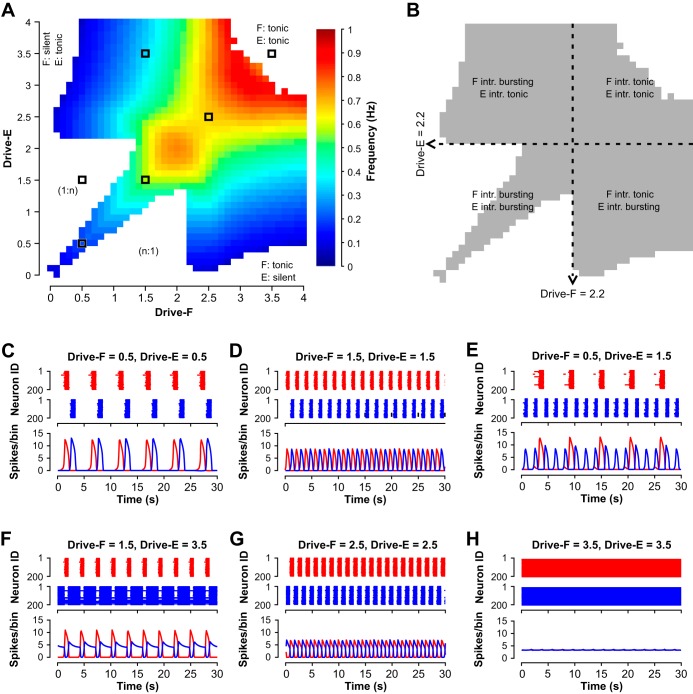
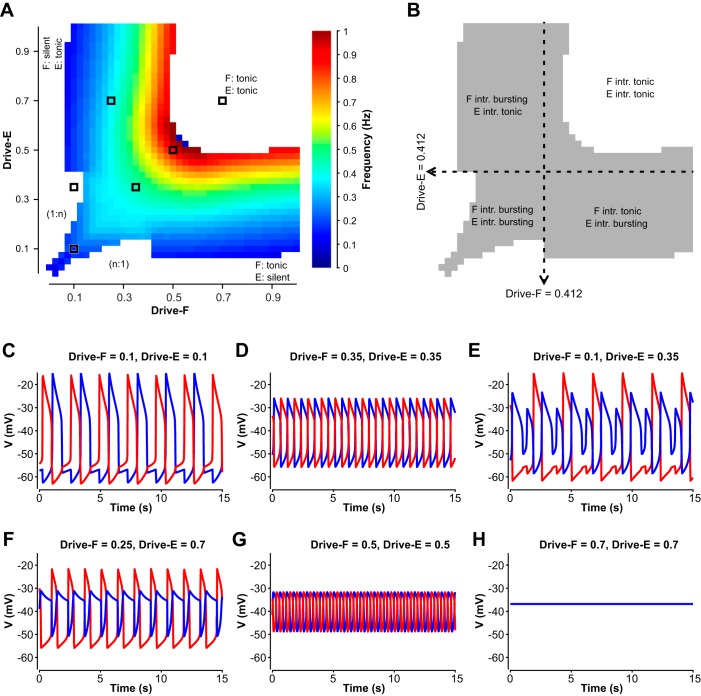
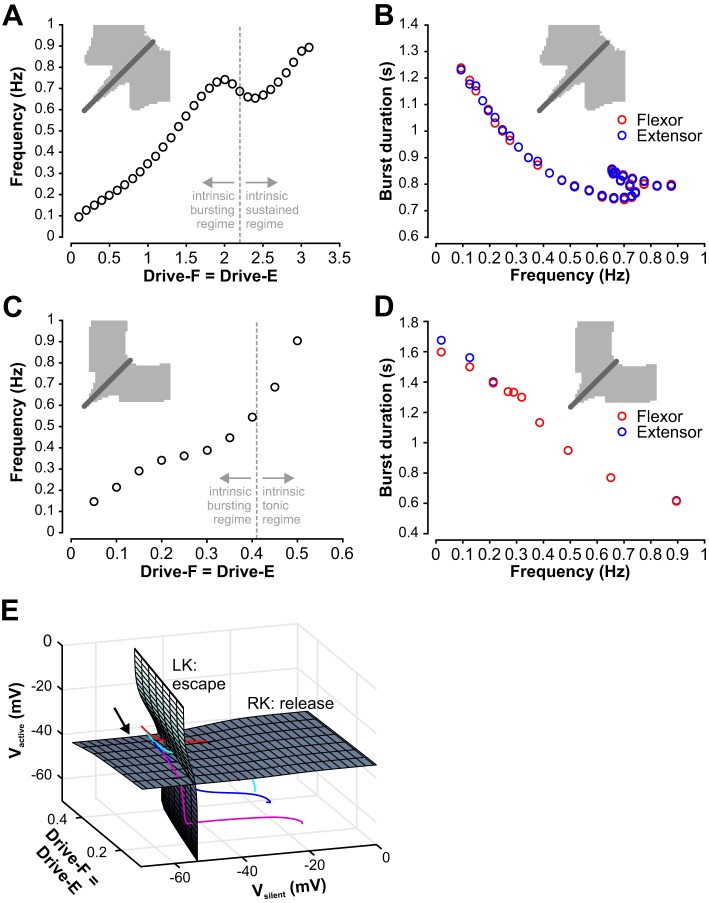
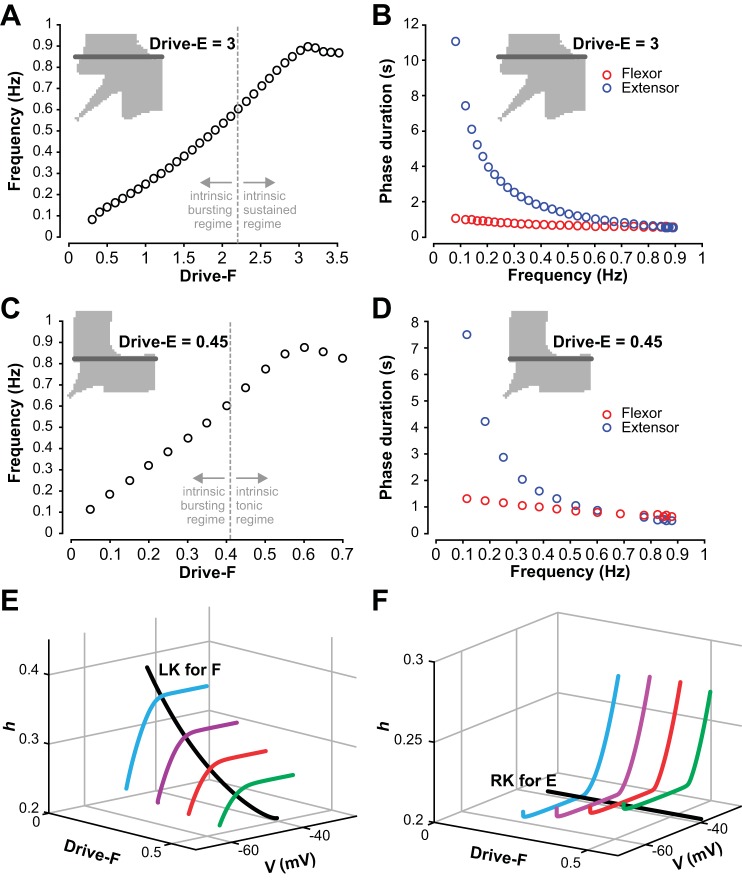
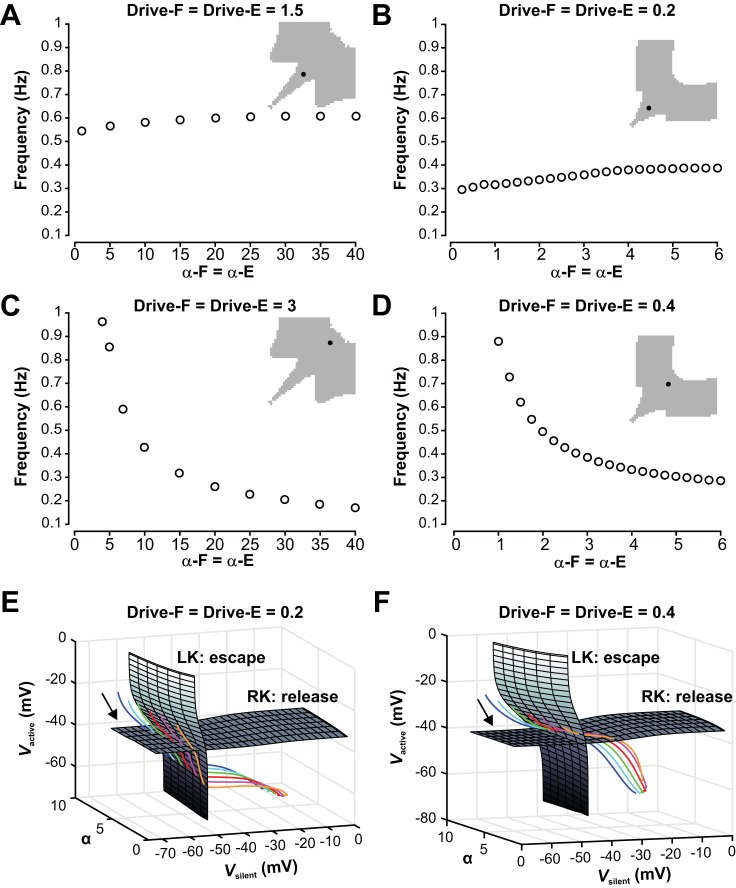
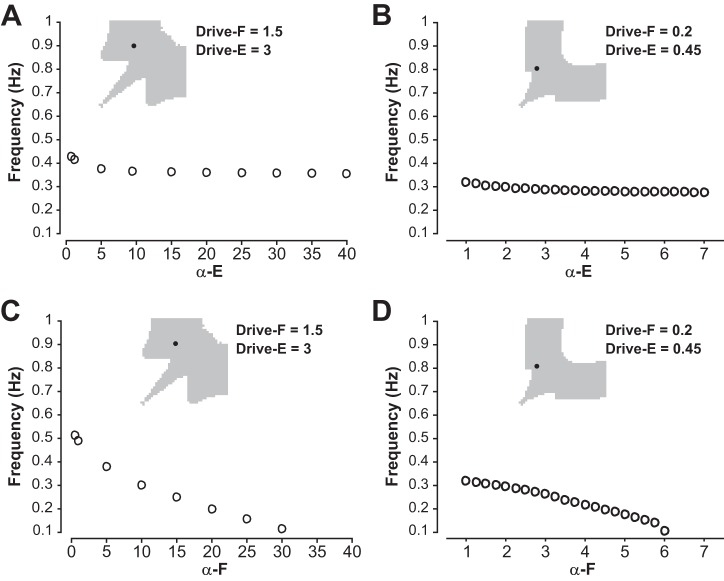
The spinal locomotor central pattern generator (CPG) generates rhythmic activity with alternating flexion and extension phases. This rhythmic pattern is likely to result from inhibitory interactions between neural populations representing flexor and extensor half-centers. However, it is unclear whether the flexor-extensor CPG has a quasi-symmetric organization with both half-centers critically involved in rhythm generation, features an asymmetric organization with flexor-driven rhythmogenesis, or comprises a pair of intrinsically rhythmic half-centers. There are experimental data that support each of the above concepts but appear to be inconsistent with the others. In this theoretical/modeling study, we present and analyze a CPG model architecture that can operate in different regimes consistent with the above three concepts depending on conditions, which are defined by external excitatory drives to CPG half-centers. We show that control of frequency and phase durations within each regime depends on network dynamics, defined by the regime-dependent expression of the half-centers' intrinsic rhythmic capabilities and the operating phase transition mechanisms (escape vs. release). Our study suggests state dependency in locomotor CPG operation and proposes explanations for seemingly contradictory experimental data. NEW & NOTEWORTHY Our theoretical/modeling study focuses on the analysis of locomotor central pattern generators (CPGs) composed of conditionally bursting half-centers coupled with reciprocal inhibition and receiving independent external drives. We show that this CPG framework can operate in several regimes consistent with seemingly contradictory experimental data. In each regime, we study how intrinsic dynamics and phase-switching mechanisms control oscillation frequency and phase durations. Our results provide insights into the organization of spinal circuits controlling locomotion.

Keywords: central pattern generator; computational modeling; flexor-extensor half-center; phase transition mechanisms.


Figures

Fig. 1.
Fig. 1.
Model schematics. A: in the population model, the flexor (F) and extensor (E) half-centers represent populations of 200 neurons with INaP-dependent bursting properties and sparse mutually excitatory interconnections. These half-centers inhibit each other via corresponding populations of inhibitory neurons (In-E and In-F) each consisting of 100 neurons. α-F and α-E denote the overall strength of the mutual inhibition to each flexor and extensor neuron, respectively. Each half-center receives tonic external drive (Drive-F/E). All neurons are modeled in the Hodgkin-Huxley style (see methods). B: in the reduced model, the flexor and extensor half-centers are represented by two activity-based (nonspiking) units that mutually inhibit each other.
Fig. 2.
Fig. 2.
Schematic illustration of operating regimes for an uncoupled reduced model unit. A, C, and E: voltage time courses. B, D, and F: corresponding phase plane representations, each including V-nullcline (dV/dt = 0, gray), h-nullcline (dh/dt = 0, green), and trajectory (black). Each trajectory evolves clockwise. A and B: when the h-nullcline intersects the left branch of the V-nullcline, trajectories converge to a stable steady state at hyperpolarized voltage. C and D: when the h-nullcline intersects the middle branch of the V-nullcline, relaxation oscillations result. E and F: when the h-nullcline intersects the right branch of the V-nullcline, trajectories converge to a stable steady state at depolarized voltage.
Fig. 3.
Fig. 3.
Transitions by escape and release in a pair of reduced model units coupled by mutual inhibition. Phase planes with V-nullclines corresponding to no inhibition (dashed gray) and maximal inhibition (solid gray), an h-nullcline (green), and a trajectory (black); the direction of evolution along each trajectory is indicated with an arrow. Fixed points lie where nullclines intersect. A: an inhibited unit that follows its inhibited V-nullcline is released from inhibition and thus transitions to the active phase (from the square), where it follows its no-inhibition V-nullcline. B: an active unit reaches its right knee (square) and transitions to the silent phase, thus releasing the other unit from inhibition. The released unit activates and crosses the synaptic threshold, such that the formerly active unit follows its inhibited V-nullcline in the silent phase. C: an inhibited unit reaches the left knee (circle) of its inhibited V-nullcline and escapes to become active. Its escape causes the other unit’s voltage to fall below the synaptic threshold, such that once the first unit becomes active, it follows its no-inhibition V-nullcline. D: an active unit approaches a fixed point (circle) along its uninhibited V-nullcline. Once it is in the neighborhood of the fixed point, it becomes inhibited by the escape of its partner and transitions to the silent phase (from the circle), where it follows its inhibited V-nullcline.
Fig. 4.
Fig. 4.
Conditional burst dynamics in the population model. A: with progressive increase of external excitatory drive, the activity of an isolated (flexor or extensor) population changes from silent (Drive < 0.1) to bursting (Drive ≥ 0.1) and to sustained activity (Drive ≥ 2.2). Example raster plots and histograms for the data points labeled with B–D are shown in panels B–D. B–D: example action potential raster plots (upper traces) for the 200 neurons in an isolated half-center population and histograms of population firing activity (lower traces) for three different drives to the isolated population that elicit low-frequency bursting (B), high-frequency bursting (C), and sustained activity (D). Population activity in B–D and following figures is represented by histograms showing the average number of spikes in the populations per 100-ms bin.
Fig. 5.
Fig. 5.
Activity regimes depend on drive to half-center populations in the population model. A: frequency heat map obtained by independently varying flexor and extensor drives. Only frequencies where the flexor and extensor are bursting in strict alternation (1:1) are color coded. White areas are indicated where nonphysiological bursting occurs (1:n) (example with n = 3 shown in E) and where the flexor and/or extensor are tonic or silent (example for both tonic shown in H). B: alternating bursting (1:1) results from a wide range of drive combinations and underlying intrinsic (intr.) activity regimes of the flexor and extensor populations. Dashed lines indicate where the intrinsic activity state switches from bursting to sustained activity. C–H: examples of raster plots and histograms of flexor (red) and extensor (blue) population activities corresponding to different regimes of model activity. C: bursting activity of both half-centers with a gap between two bursts occurring at low, symmetric drives (Drive < 1.4). D: alternating bursting at intermediate, symmetric drives, when both half-centers operate in their intrinsic bursting mode. E: nonphysiological (1:n) bursting. F: oscillations based on intrinsic bursting of the flexor half-center with the extensor half-center exhibiting sustained activity if isolated. G: classical half-center oscillations, where both half-centers if isolated are in a sustained activity-mode. H: tonic activity that emerges at high symmetric drive.
Fig. 6.
Fig. 6.
Activity regimes depend on drive in the reduced model. A: frequency heat map obtained by independently changing drives to the flexor and extensor half-centers. Only frequencies where the flexor and extensor are rhythmically active in strict alternation (1:1) are color coded. White areas correspond to nonphysiological regimes of burst alternation (1:n or n:1) (example shown in E) and to the states when the flexor and/or extensor are tonically active or silent (example for both tonic shown in H). B: the alternating (1:1) oscillations result from a wide range of drive combinations and underlying intrinsic activity regimes of the flexor and extensor units. Dashed lines indicate where the intrinsic activity state switches from bursting to tonic. C–H: example traces of flexor (red) and extensor (blue) units generated at drive levels indicated by black squares in A, showing network activity at low, symmetric drives demonstrating the gap between two active states (C); intermediate, symmetric drives (D); asymmetric drives yielding nonphysiological (1:n) bursting (E); asymmetric drives yielding network oscillations due to intrinsic bursting in the flexor half-center with the extensor half-center in a tonic mode (F); high, symmetric drives for which the network exhibits half-center oscillations, although both flexor and extensor are intrinsically tonic (G); high symmetric drive yielding tonic network activity (represented by sustained elevated voltage) (H).
Fig. 7.
Fig. 7.
Bifurcation diagrams for the reduced model. A: diagram with drive levels to both units (Drive-F = Drive-E) used as the bifurcation parameter. At high and low drives, there are stable steady states (red solid curves) in which both units are tonically active (high drive) or silent (low drive) with equal voltages. These steady states both destabilize via Andronov-Hopf (AH) bifurcations, between which they are unstable (black dashed curve). The AH bifurcation near drive levels of 0.544 gives rise to a very small family of unstable periodic orbits (small blue dashed segment), which meets a family of stable periodic orbits (green curve shows maximal and minimal voltages along this family) corresponding to anti-phase oscillations (near Drive-F = Drive-E = 0.546) and extending to much lower drives. These oscillations destabilize in a pitchfork bifurcation (at Drive-F = Drive-E ≈0.155) that also gives rise to two new stable families of periodic orbits (magenta curves; outer curves show maximal and minimal voltages along one family, inner curves along the other, although the lower inner and outer curves largely lie on top of each other), which in turn destabilize around Drive-F = Drive-E = 0.018. The AH bifurcation near Drive-F = Drive-E = 0.018 gives rise to an unstable family of periodic orbits (cyan dashed curves show maximal and minimal voltages along these orbits) that terminate in another AH bifurcation around Drive-F = Drive-E = 0.38. B: diagram with Drive-E fixed at 0.6 and Drive-F used as the bifurcation parameter. Color conventions are as in A. In this case, there are just two AH bifurcations and one family of periodic orbits. Along the dashed part of the periodic orbit curve, the orbit amplitudes grow extremely rapidly and orbit stability could not accurately be resolved.
Fig. 8.
Fig. 8.
Escape transitions can occur when units are intrinsically oscillatory or tonic. A and B: with symmetric drives to both reduced model units, their nullclines and trajectories look identical in the phase plane, so we use a single phase plane diagram for both units (e.g., Rubin and Terman 2002). As in Fig. 3, gray curves are V-nullclines (solid, maximal inhibition; dashed, no inhibition), green are h-nullclines, and black are trajectories, which evolve clockwise (arrows). A: diagram when both units are intrinsically oscillatory. When one unit reaches the left knee of the maximal-inhibition V-nullcline, it initiates a phase transition by escaping from the silent phase (blue circle). The other unit becomes inhibited and jumps down to the silent phase (red circle). Although there is no fixed point in the active phase (right branch of V-nullclines), the transition is by escape rather than by release. B: when there is a fixed point in the active phase (red circle), transitions must occur by escape, which happens when a silent unit reaches the left knee of the maximal-inhibition V-nullcline (blue circle).
Fig. 9.
Fig. 9.
Control of frequency and burst durations with symmetric (equal) drives to both half-centers. A: for the population model, frequency increases with increasing drive but exhibits a drop at Drive-F = Drive-E≈2 that is followed by a subsequent increase in frequency when drive increases even more. The dashed line indicates the transition from the intrinsic bursting to the intrinsic sustained regime, which does not correspond to changes in the slope of the curve. B: flexor and extensor burst durations are equal over the whole frequency range for the population model. C: for the reduced model, frequency also increased with drive, over a similar range as for the population model. In an intermediate drive range the increase slowed, but no decline in frequency was observed. The dashed line indicates the transition from the intrinsic bursting to the intrinsic tonic regime, which does not correspond to changes in the slope of the curve. D: flexor and extensor burst durations are at least approximately equal over the whole frequency range for the original reduced model. E: knee surfaces derived from voltage nullclines for the reduced model. If the drive level to both units and the voltage level of one unit are fixed, then the other unit has a voltage nullcline (see methods, Fig. 2) with turning points at left (low V, high h) and right (high V, low h) knees. When the drive level or the voltage level of the fixed unit is varied, the nullcline and its knees move accordingly; see methods, Eqs. 7, 9, and 10. Gray surfaces are surfaces of left (LK) and right (RK) knees parameterized by drive level and by voltage of the fixed unit. Since the left knee surface is relevant when a unit is silent and the other unit is active, it is represented as a function of drive and the voltage level of the active unit (Vactive). Since the right knee surface is relevant when a unit is active and the other unit is silent, it is represented as a function of drive and the voltage level of the silent unit (Vsilent). Colored curves are trajectories of the coupled models for Drive-F = Drive-E = 0.15 (magenta), 0.25 (blue), 0.3 (cyan), 0.35 (red), each shown near a transition when one unit activates and the other falls silent. These evolve from upper left to lower right (arrow). In a transition by escape, a trajectory intersects the LK surface before the RK surface (red, cyan curves). This order is reversed in a transition by release (blue, magenta curves).
Fig. 10.
Fig. 10.
Control of frequency and phase durations with asymmetric drives to the flexor and extensor half-centers. A: in the population model, with drive to the extensor half-center fixed at a level producing sustained activity, an increase in drive to the flexor half-center results in an increase in frequency until frequency reaches a plateau at high drives. The dashed line indicates the transition from the intrinsic bursting to the intrinsic sustained regime for the flexor. B: in the population model, the extensor phase duration decreases with increasing frequency, while flexor phase duration stays relatively constant. C: in the reduced model, with the strength of extensor drive maintained constant at a level for which the extensor half-center is in the tonic mode, an increase in strength of drive to the flexor half-center results in an increase in frequency until frequency slightly decreases at high drives. The dashed line indicates the transition from the intrinsic bursting to the intrinsic tonic regime for the flexor. D: in the reduced model, similar to the population model, the extensor phase duration decreases with increasing frequency, while flexor phase duration stays relatively constant. E: curve of flexor left knees (LK, black) and projection of trajectory segments (colored) for the reduced model for 4 values of Drive-F (0.1, 0.2, 0.3, 0.4). The direction of increasing time along each trajectory is from lower left to upper right. For each drive, the escape of the flexor from the silent phase occurs where the corresponding trajectory switches from sharply increasing in h to relatively flat in h. For larger drive, the escape occurs farther from the left knee, which corresponds to a shorter extensor active phase (see text). F: curve of extensor right knees (RK, black) and projection of trajectory segments (colored) for the reduced model for four values of Drive-F as in E. The direction of increasing time along each trajectory is from upper right to lower left. For each drive, the corresponding trajectory switches from sharply decreasing in h to relatively flat in h when the flexor escapes from the silent phase.
Fig. 11.
Fig. 11.
Dependence of oscillation frequency on the strength of mutual inhibition between the half-centers in the symmetric regime. A: in the symmetric regime with low drive to both half-centers, frequency is not sensitive to changes in the strength of the reciprocal inhibition for the population model. B: the reduced model also does not show strong frequency modulation with changing inhibition when drive is relatively low and transitions require release. C: the symmetric regime with high drive is highly sensitive to changes in inhibition for the population model. D: the reduced model shows a similarly strong frequency dependency on changes in inhibition when drive is relatively high and transitions occur by escape. E and F: surfaces of left (LK) and right (RK) knees, corresponding to transitions by escape and release, respectively, for the reduced model with low drive (0.2, E) and high drive (0.4, F). Colored curves are trajectories for various levels of inhibition strength α (orange, 1.5; pink, 2.5; red, 3.5; green, 4.5; cyan, 5.5; blue, 6.5). These evolve from upper left to lower right (arrows). E: with low drive, trajectories for all levels of α hit the RK surface before the LK surface, corresponding to transitions by release. F: with high drive, trajectories for all levels of α hit the LK surface before the RK surface, corresponding to transitions by escape.
Fig. 12.
Fig. 12.
Dependence of frequency on the strength of mutual inhibition between the half-centers in the asymmetric regime. A and B: for both the population (A) and reduced (B) models, changing inhibition strength to the extensor (α-E) produces almost no change in network frequency. C and D: for both the population (C) and reduced (D) models, varying the strength of inhibition to the flexor (α-F) does cause a frequency change but this effect is small relative to the case with strong symmetric drives (Fig. 11, C and D), especially in the reduced model.

Similar articles

Cited by

References

    1. Armstrong DM. The supraspinal control of mammalian locomotion. J Physiol 405: 1–37, 1988. doi:10.1113/jphysiol.1988.sp017319. - DOI - PMC - PubMed
    1. Atsuta Y, Garcia-Rill E, Skinner RD. Characteristics of electrically induced locomotion in rat in vitro brain stem-spinal cord preparation. J Neurophysiol 64: 727–735, 1990. - PubMed
    1. Best J, Borisyuk A, Rubin J, Terman D, Wechselberger M. The dynamic range of bursting in a model respiratory pacemaker network. SIAM J Appl Dyn Syst 4: 1107–1139, 2005. doi:10.1137/050625540. - DOI
    1. Britz O, Zhang J, Grossmann KS, Dyck J, Kim JC, Dymecki S, Gosgnach S, Goulding M. A genetically defined asymmetry underlies the inhibitory control of flexor–extensor locomotor movements. eLife 4: e04718, 2015. doi:10.7554/eLife.04718. - DOI - PMC - PubMed
    1. Brocard F, Shevtsova NA, Bouhadfane M, Tazerart S, Heinemann U, Rybak IA, Vinay L. Activity-dependent changes in extracellular Ca2+ and K+ reveal pacemakers in the spinal locomotor-related network. Neuron 77: 1047–1054, 2013. doi:10.1016/j.neuron.2013.01.026. - DOI - PMC - PubMed

Publication types

LinkOut - more resources