. 2017 Oct 4;7(1):12671.
doi: 10.1038/s41598-017-12570-6.

Functional role of PPAR-γ on the proliferation and migration of fibroblast-like synoviocytes in rheumatoid arthritis

Affiliations

Functional role of PPAR-γ on the proliferation and migration of fibroblast-like synoviocytes in rheumatoid arthritis

Xiao-Feng Li et al. Sci Rep. .

Abstract

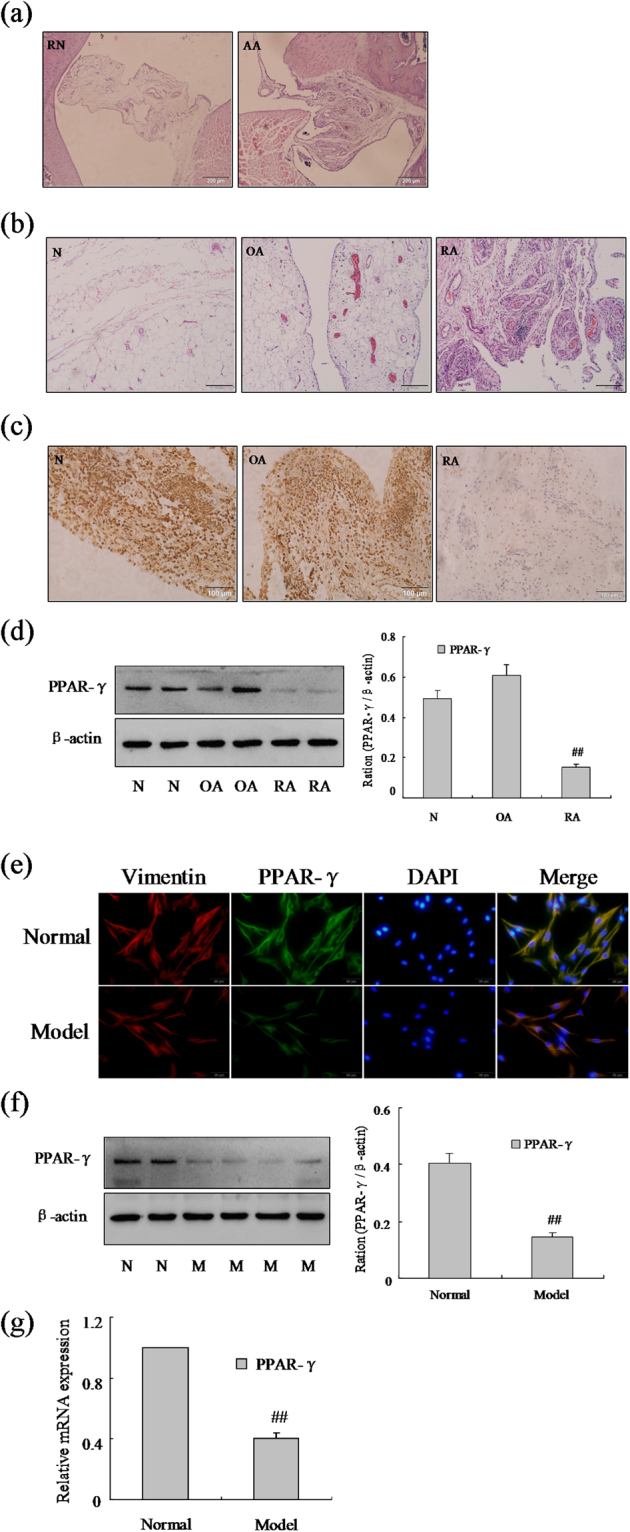
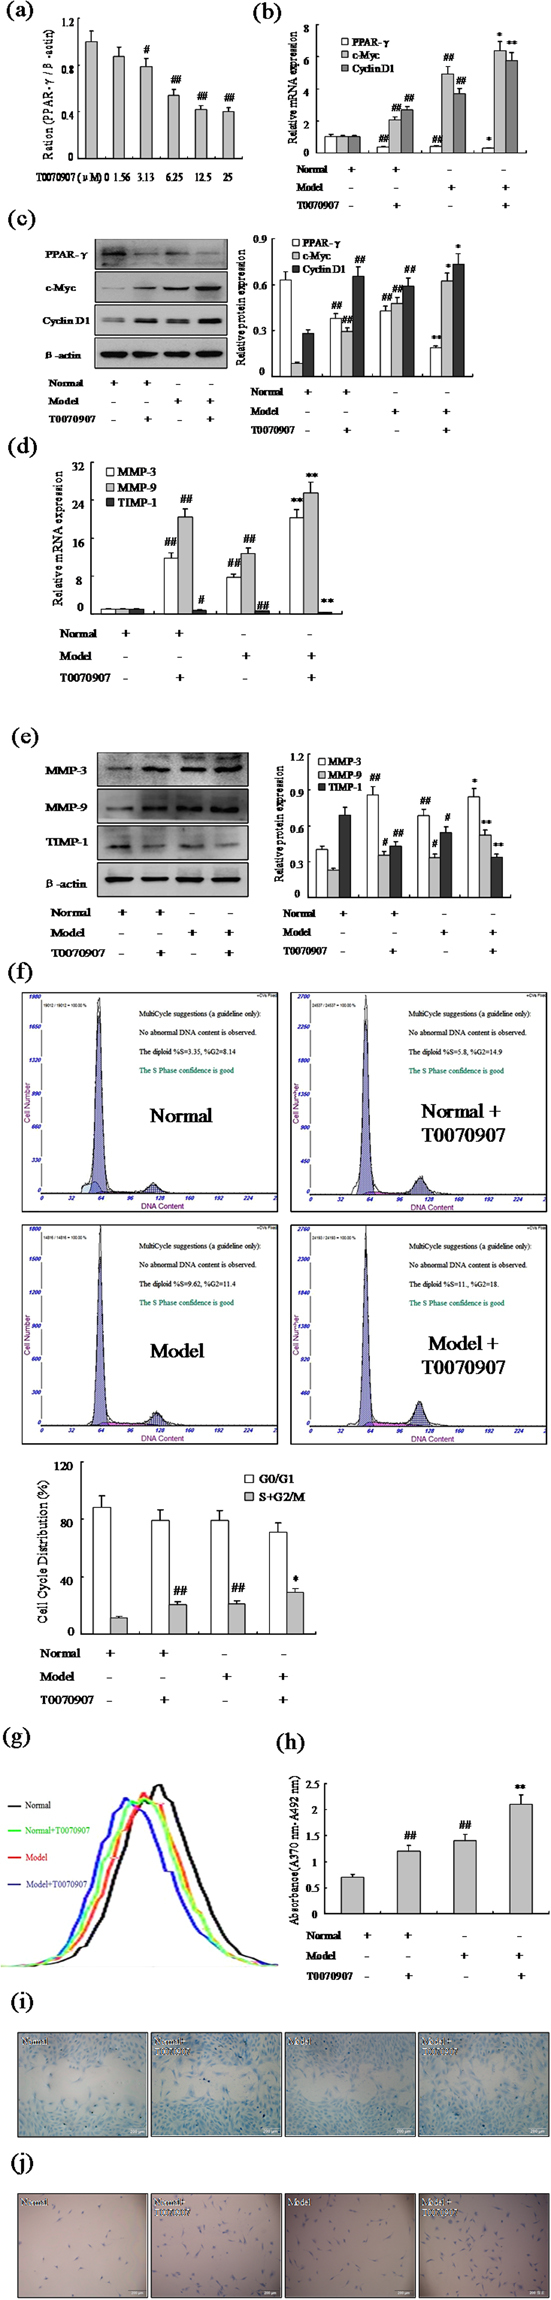
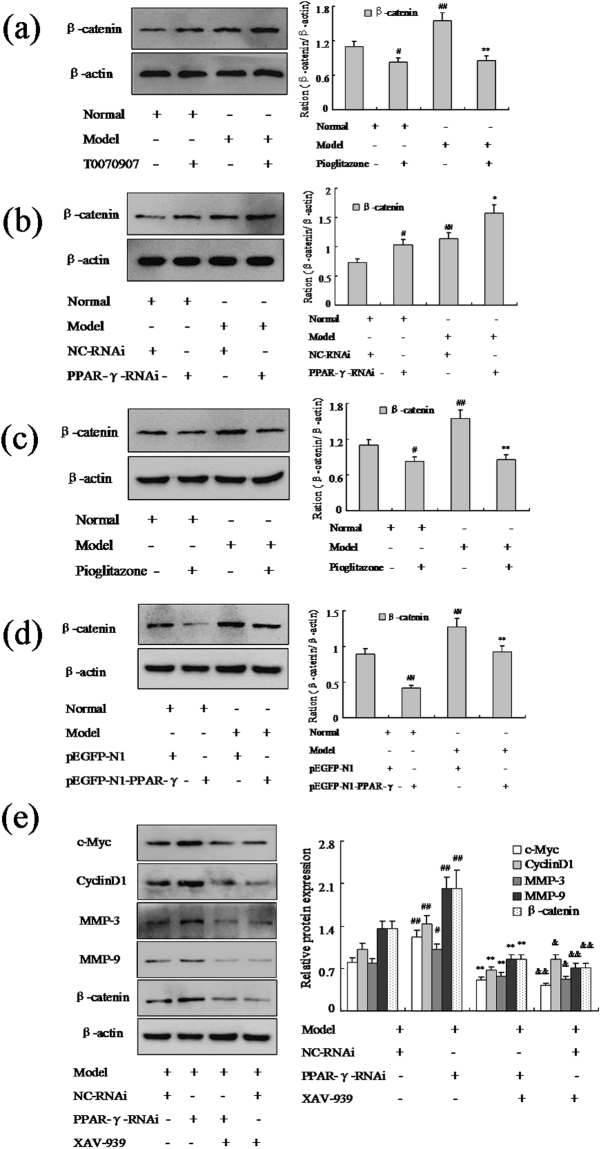
Peroxisome proliferator-activated receptor (PPAR)-γ is involved in both normal physiological processes and pathology of various diseases. The purpose of this study was to explore the function and underlying mechanisms of PPAR-γ in rheumatoid arthritis (RA) fibroblast-like synoviocytes (FLSs) proliferation and migration. In the present study, we found PPAR-γ expression was remarkably reduced in RA synovium patient compare with OA and normal, as well as it was low-expression in Adjuvant-induced arthritis (AA). Moreover, inhibition PPAR-γ expression by T0070907 (12.5 μM) or PPAR-γ siRNA could promote FLSs proliferation and expressions of c-Myc, Cyclin D1, MMP-1, and MMP-9 in AA FLSs, except for TIPM-1. These date indicate that up-regulation of PPAR-γ may play a critical role in RA FLSs. Interestingly, co-incubation FLSs with Pioditazone (25 μM) and over expression vector with pEGFP-N1-PPAR-γ reduced proliferation and expressions of c-Myc, Cyclin D1, MMP-1, and MMP-9 in AA FLSs, besides TIMP-1. Further study indicates that PPAR-γ may induce activation Wnt/β-catenin signaling. In short, these results indicate that PPAR-γ may play a pivotal role during FLSs activation and activation of Wnt/β-catenin signaling pathway.


Conflict of interest statement

The authors declare that they have no competing interests.

Figures

Figure 1
Figure 1
The expression of PPAR-γ was down-regulated in RA FLSs. (a) Representative H&E staining of AA and normal synovial tissues in rat (original magnification, ×10). (b) Representative H&E staining of RA, OA and normal synovial tissues in human (original magnification, ×10). (c) The expression of PPAR-γ in RA, OA and normal synovial tissue was analyzed by IHC staining analysis in human. (d) The protein level of PPAR-γ was analyzed by Western blot in RA, OA and normal synovial tissue. (e) The expression of PPAR-γ and Vimentin were analyzed by double immunofluorescence staining analysis in rat AA and normal FLSs. (f) The protein level of PPAR-γ was analyzed by Western blot in AA and normal FLSs. (g) The mRNA level of PPAR-γ was analyzed by Q-PCR in AA and normal FLSs. All values were expressed as mean ± SEM. ##P < 0.01 vs normal group.
Figure 2
Figure 2
Effect of PPAR-γ inhibitor increases FLSs proliferation and migration. (a) Concentration-dependent inhibition expression of PPAR-γ mRNA by T0070907 in normal FLSs, tested by Q-PCR assays. (b) The mRNA levels of PPAR-γ, c-Myc and Cyclin D1 were analyzed by Q-PCR in FLSs with T0070907 (12.5 μM). (c) The protein levels of PPAR-γ, c-Myc and Cyclin D1 were analyzed by Western blot in FLSs with T0070907 (12.5 μM). (d) The mRNA levels of MMP-3, MMP-9 and TIMP-1 were analyzed by Q-PCR in FLSs with T0070907 (12.5 μM). (e) The protein levels of MMP-3, MMP-9 and TIMP-1 were analyzed by Western blot in FLSs with T0070907 (12.5 μM). (f) Cell cycle of FLSs were incubated with T0070907 (12.5 μM) for 48 h and then subjected to the FACS analysis. (g) After stained with CFDA-SE, FLSs were incubated with T0070907 (12.5 μM) for six days and then subjected to the FACS analysis. (h) BrdU proliferation assay were treated with T0070907 (12.5 μM) 48 h in FLSs. (i) FLSs were treated with T0070907 (12.5 μM), and migration into the wound-healing 24 h was photographed (original magnification, ×10). (j) FLSs were treated with T0070907 (12.5 μM), and transwell migration 48 h was photographed (original magnification, ×10). All values were expressed as mean ± SEM. #P < 0.05, ##P < 0.01 vs normal group. *P < 0.05, **P < 0.01 vs model group.
Figure 3
Figure 3
Effect of PPAR-γ siRNA silencing increases FLSs proliferation and migration. (a) The mRNA levels of PPAR-γ, c-Myc and Cyclin D1 were analyzed by Q-PCR in FLSs with PPAR-γ siRNA. (b) The protein levels of PPAR-γ, c-Myc and Cyclin D1 were analyzed by Western blot in FLSs with PPAR-γ siRNA. (c) The mRNA levels of MMP-3, MMP-9 and TIMP-1 were analyzed by Q-PCR in FLSs with PPAR-γ siRNA. (d) The protein levels of MMP-3, MMP-9 and TIMP-1 were analyzed by Western blot in FLSs with PPAR-γ siRNA. (e) Cell cycle of FLSs were incubated with PPAR-γ siRNA for 48 h and then subjected to the FACS analysis. (f) After stained with CFDA-SE, FLSs were incubated with PPAR-γ siRNA for six days and then subjected to the FACS analysis. (g) BrdU proliferation assay were treated with PPAR-γ siRNA 48 h in FLSs. (h) FLSs were treated with PPAR-γ siRNA, and migration into the wound-healing 24 h was photographed (original magnification, ×10). (i) FLSs were treated with PPAR-γ siRNA, and transwell migration 48 h was photographed (original magnification, ×10). All values were expressed as mean ± SEM. #P < 0.05, ##P < 0.01 vs normal group. *P < 0.05, **P < 0.01 vs model group.
Figure 4
Figure 4
Effect of PPAR-γ agonist inhibits FLSs proliferation and migration. (a) Concentration-dependent inhibition expression of PPAR-γ mRNA by Pioditazone in AA FLSs, tested by Q-PCR assays. (b) The mRNA levels of PPAR-γ, c-Myc and Cyclin D1 were analyzed by Q-PCR in FLSs with Pioditazone. (c) The protein levels of PPAR-γ, c-Myc and Cyclin D1 were analyzed by Western blot in FLSs with Pioditazone. (d) The mRNA levels of MMP-3, MMP-9 and TIMP-1 were analyzed by Q-PCR in FLSs with Pioditazone. (e) The protein levels of MMP-3, MMP-9 and TIMP-1 were analyzed by Western blot in FLSs with Pioditazone. (f) Cell cycle of FLSs were incubated with Pioditazone for 48 h and then subjected to the FACS analysis. (g) After stained with CFDA-SE, FLSs were incubated with Pioditazone for six days and then subjected to the FACS analysis. (h) BrdU proliferation assay were treated with Pioditazone 48 h in FLSs. (i) FLSs were treated with Pioditazone, and migration into the wound-healing 24 h was photographed (original magnification, ×10). (j) FLSs were treated with Pioditazone, and transwell migration 48 h was photographed (original magnification, ×10). All values were expressed as mean ± SEM. #P < 0.05, ##P < 0.01 vs normal group. *P < 0.05, **P < 0.01 vs model group.
Figure 5
Figure 5
Effect of over expression vector of PPAR-γ inhibits FLSs proliferation and migration. (a) The mRNA levels of PPAR-γ, c-Myc and Cyclin D1 were analyzed by Q-PCR in FLSs with pEGFP-N1-PPAR-γ. (b) The protein levels of PPAR-γ, c-Myc and Cyclin D1 were analyzed by Western blot in FLSs with pEGFP-N1-PPAR-γ. (c) The mRNA levels of MMP-3, MMP-9 and TIMP-1 were analyzed by Q-PCR in FLSs with pEGFP-N1-PPAR-γ. (d) The protein levels of MMP-3, MMP-9 and TIMP-1 were analyzed by Western blot in FLSs with pEGFP-N1-PPAR-γ. (e) Cell cycle of FLSs were incubated with pEGFP-N1-PPAR-γ for 48 h and then subjected to the FACS analysis. (f) After stained with CFDA-SE, FLSs were incubated with pEGFP-N1-PPAR-γ for six days and then subjected to the FACS analysis. (g) BrdU proliferation assay were treated with pEGFP-N1-PPAR-γ 48 h in FLSs. (h) FLSs were treated with pEGFP-N1-PPAR-γ, and migration into the wound-healing 24 h was photographed (original magnification, ×10). (i) FLSs were treated with pEGFP-N1-PPAR-γ, and transwell migration 48 h was photographed (original magnification, ×10). All values were expressed as mean ± SEM. #P < 0.05, ##P < 0.01 vs normal group. *P < 0.05, **P < 0.01 vs model group.
Figure 6
Figure 6
PPAR-γ may modulate FLSs proliferation and be closely associated with Wnt/β-catenin signaling pathway. (a) The protein level of β-catenin was analyzed by Western blot in FLSs with T0070907 (12.5 μM). (b) The protein level of β-catenin was analyzed by Western blot in FLSs with PPAR-γ siRNA. (c) The protein level of β-catenin was analyzed by Western blot in FLSs with Pioditazone (25 μM). (d) The protein level of β-catenin was analyzed by Western blot in FLSs with over expression vector pEGFP-N1-PPAR-γ. (e) The protein level of c-Myc, Cyclin D1, MMP-3, MMP-9 and β-catenin was analyzed by Western blot in AA FLSs. All values were expressed as mean ± SEM. #P < 0.05, ##P < 0.01 vs normal group. *P < 0.05, **P < 0.01 vs model group. (e) #P < 0.05, ##P < 0.01 vs model group; **P < 0.01 vs PPAR-γ siRNA group; &P < 0.05, &&P < 0.01 vs model group.

References

    1. Feldmann M, Brennan FM, Maini RN. Rheumatoid arthritis. Cell. 1996;85:307–310. doi: 10.1016/S0092-8674(00)81109-5. - DOI - PubMed
    1. Elshabrawy, H. A. et al. The pathogenic role of angiogenesis in rheumatoid arthritis. Angiogenesis (2015). - PMC - PubMed
    1. Dulos J, et al. p38 inhibition and not MK2 inhibition enhances the secretion of chemokines from TNF-alpha activated rheumatoid arthritis fibroblast-like synoviocytes. Clin Exp Rheumatol. 2013;31:515–525. - PubMed
    1. Yeremenko N, et al. Brief Report: Tumor Necrosis Factor and Interleukin-6 Differentially Regulate Dkk-1 in the Inflamed Arthritic Joint. Arthritis Rheumatol. 2015;67:2071–2075. doi: 10.1002/art.39183. - DOI - PubMed
    1. Koga T, et al. Post-transcriptional regulation of IL-6 production by Zc3h12a in fibroblast-like synovial cells. Clin Exp Rheumatol. 2011;29:906–912. - PubMed

Publication types