. 2017 Oct 4;7(1):12685.
doi: 10.1038/s41598-017-12858-7.

Age-related neurodegenerative disease associated pathways identified in retinal and vitreous proteome from human glaucoma eyes

Affiliations

Age-related neurodegenerative disease associated pathways identified in retinal and vitreous proteome from human glaucoma eyes

Mehdi Mirzaei et al. Sci Rep. .

Abstract

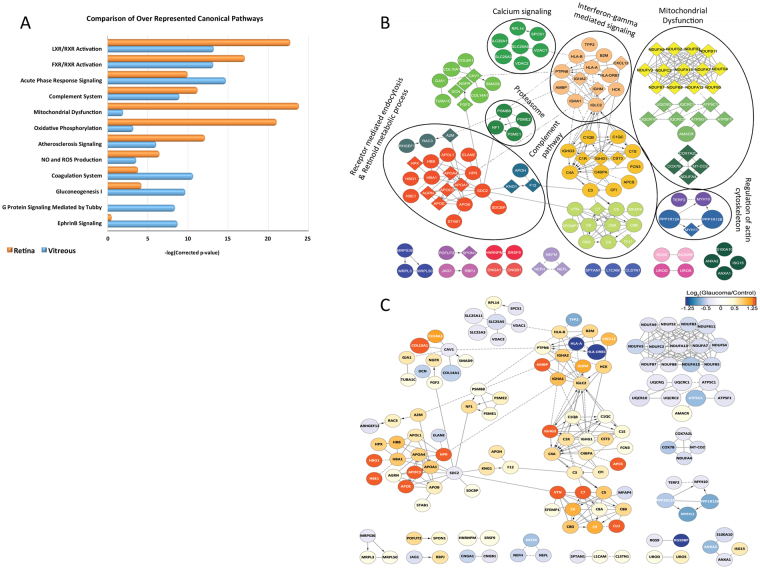
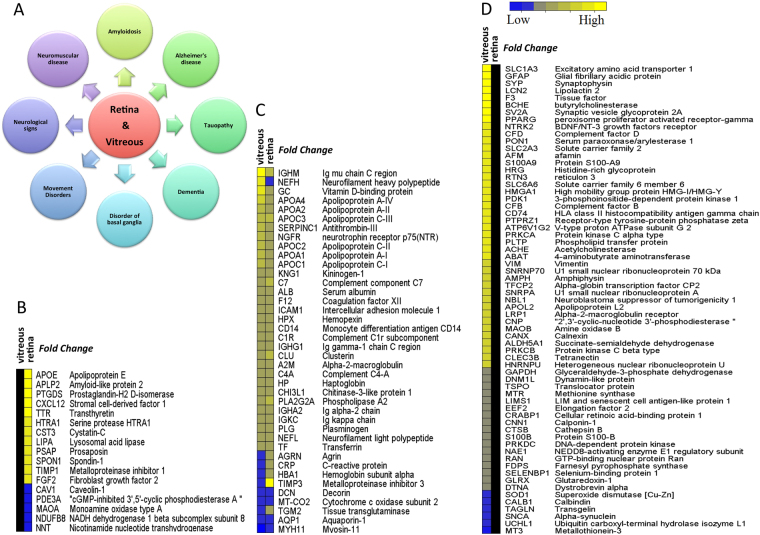
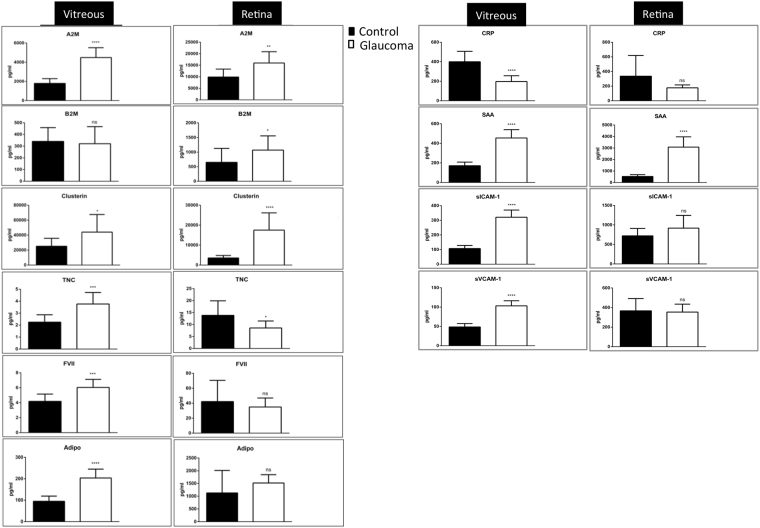
Glaucoma is a chronic disease that shares many similarities with other neurodegenerative disorders of the central nervous system. This study was designed to evaluate the association between glaucoma and other neurodegenerative disorders by investigating glaucoma-associated protein changes in the retina and vitreous humour. The multiplexed Tandem Mass Tag based proteomics (TMT-MS3) was carried out on retinal tissue and vitreous humour fluid collected from glaucoma patients and age-matched controls followed by functional pathway and protein network interaction analysis. About 5000 proteins were quantified from retinal tissue and vitreous fluid of glaucoma and control eyes. Of the differentially regulated proteins, 122 were found linked with pathophysiology of Alzheimer's disease (AD). Pathway analyses of differentially regulated proteins indicate defects in mitochondrial oxidative phosphorylation machinery. The classical complement pathway associated proteins were activated in the glaucoma samples suggesting an innate inflammatory response. The majority of common differentially regulated proteins in both tissues were members of functional protein networks associated brain changes in AD and other chronic degenerative conditions. Identification of previously reported and novel pathways in glaucoma that overlap with other CNS neurodegenerative disorders promises to provide renewed understanding of the aetiology and pathogenesis of age related neurodegenerative diseases.


Conflict of interest statement

The authors declare that they have no competing interests.

Figures

Figure 1
Figure 1
Experimental design and TMT labelling workflow of the experiment. Human retinal and vitreous tissues were extracted from postmortem eyes of control (age: control 64.5 ± 10, n = 10) and glaucoma subjects (age: 71.5 ± 8.5, n = 10). Extracted proteins form 40 samples subjected to reduction, alkylation and subsequent digestion with Trypsin and Lys-C. Extracted peptides were quantified and labeled in a 10 plex TMT reaction. Four TMT experiments were carried out to accommodate all the biological replicates. Briefly, 2 sets of 5 control and 5 glaucoma replicates of retina tissue were used in TMT 1 and 2 experiments, and the same design was used for vitreous samples in TMT3 and TMT4 experiments. Labelled samples within each TMT experiment were pooled together, then were fractionated by basic, reversed-phase isocratic step elution using reverse phase spin columns, and analyzed by LC-ESI-MS/MS on ThermoFisher Orbitrap Fusion mass spectrometer (SPS-MS3 method). Functional pathway and protein network data analysis was performed using Ingenuity and Reactome pathway analysis.
Figure 2
Figure 2
Results of proteomics analysis and quality control measurements. (A) Venn diagram indicating the overlap between the proteins identified and quantified from vitreous and retinal tissues (1% FDR). (B,C) Volcano plots demonstrating the dual thresholds for differentially regulated proteins. Each data point represents a single quantified protein. The x-axis represents log fold change in abundance (glaucoma/control). Vertical blue lines indicate 1.3 and 0.77 ratio. The −log (p-value) is plotted on the y-axis. Proteins above the red horizontal line indicate significance ≤ 0.05. Proteins within the upper and outer quadrants meet both the fold change and p-value cut-off, and are therefore considered as differentially regulated. (D,E) Heatmaps (hierarchical clustering) of the log-transformed ratios of differentially expressed proteins (glaucoma vs. control) in retina and vitreous. Column colours indicate treatment type. Red and green color-coding indicate relative increase or decrease in protein abundance, respectively. (F) Venn diagram representing the overlap between the differentially regulated proteins quantified in vitreous and retinal tissues (glaucoma vs. control, p-value ≤ 0.05, ≥ 1.3-fold or ≤ 0.77-fold.
Figure 3
Figure 3
Results of functional protein interaction network and pathway analysis. (A) Comparison of the top 10 canonical pathways enriched from IPA analysis of differentially regulated proteins (glaucoma vs. control) from vitreous and retina tissues. The significance of functional enrichment is plotted on the y-axis as the −log (p-value). (B) Retinal Reactome functional interaction networks analyzed by the Reactome FI Cytoscape plugin. Of 355 retinal differentially expressed proteins, 136 proteins had at least one other known functional connection. Network nodes are labeled with gene symbols. The Reactome plugin was used to assign functional clusters, which were color-coded and labelled with representative broad functions. (C) Reactome network in (B) color-coded by log2 (glaucoma/control) relative abundance quantified from the TMT analysis.
Figure 4
Figure 4
Top disease related biological functions and the list of 122 AD associated markers. (A) Representation of the top disease-related biological functions, which were commonly enriched in retina and vitreous. (BD) Heatmaps of the log-transformed abundance ratios (glaucoma vs. control) quantified in retina and vitreous datasets for the 122 AD-associated proteins. Black columns indicate the corresponding protein either was not changed or detected in the dataset, yellow and blue represent up and down regulation, respectively. Relative abundances of (B) 16 AD-associated proteins identified only in the retina, (C) 40 common AD-associated proteins identified both in the retina and vitreous, and (D) 65 AD-associated proteins identified exclusively in the vitreous.
Figure 5
Figure 5
Down regulation of ETC proteins and mitochondrial ribosomal proteins in glaucoma. (A) A schematic diagram representing the overall down regulation of proteins associated with the electron transport chain (ETC) complexes of the mitochondria in glaucoma condition. (B) A table representing the down regulation of 7 mitochondrial ribosomal proteins in vitreous, which were not detected (ND) or not significantly altered (NC) in the retina (p- value ≤ 0.05).
Figure 6
Figure 6
Activation of complement (classical) and coagulation cascades. (A) A bar graph representing the comparison of the relative abundance of proteins involved in the complement and coagulation cascade. The x-axis represent the average fold changes (p-value ≤ 0.05 and ≥1.3-fold change, n = 10). (B) A schematic diagram showing the details of the three pathways activating the complement cascade (classical, lectin and alternative), of which our quantitative proteomics data supports the activation of the classical pathway in both retina and vitreous. ★, indicates differentially regulated proteins that are part of the classical pathway (C) Western blotting analysis measuring the protein level of CLU (retina and vitreous, n = 10) and VTN in vitreous (n = 10) of glaucoma and control samples. GAPDH was used as the loading control. The bar graphs indicate average densitometry measurements (ImageJ software) (n = 10, average ± sd, *p-value < 0.05). Black bars represent control, while the light grey bars represent glaucoma. The copyright of the basic complement pathway image belongs to Noris, Mescia, & Remuzzi, Nat. Rev Neprh. 2012.
Figure 7
Figure 7
Upregulation of Apolipoproteins and down regulation of Crystallin and GSTs in glaucoma. (A) A bar graph representing the expression pattern of 12 differentially expressed Apolipoproteins identified in retina and/or vitreous (p-value ≤ 0.05 and ≥ 1.3-fold change, n = 10). (B) A bar graph representing the relative abundance of eight differentially expressed GSTs identified in retina and/or vitreous (p-value ≤ 0.05 and ≤0.77-fold change, n = 10). (C) A bar graph representing the relative abundance of 12 differentially expressed crystallin proteins identified in vitreous (p-value ≤ 0.05 and ≤ 0.77-fold change, n = 10). (D) Western blotting analysis for measuring the relative protein expression level of CRYBB2 and CRYBB3 in vitreous (n = 10) of glaucoma and control samples. GAPDH was used as the loading control. The bar graphs indicate average densitometry measurements (ImageJ software) (n = 10, average ± SD, *p-value < 0.05). Black bars represent control, while the light grey bars represent glaucoma.
Figure 8
Figure 8
ECL analysis of AD associated markers. ECL analysis of selected proteins (SAA, CRP, sVCAM1, sICAM1, A2M, B2M, FVII, TNC), which are known as AD biomarkers in the literature and also identified in the proteomics data of this study. All samples (n = 10 control and n = 10 glaucoma) were assayed in duplicate via a multiplex biomarker assay platform using ECL on the SECTOR Imager 2400A from Meso Scale Discovery.

References

    1. Guo L, et al. Retinal ganglion cell apoptosis in glaucoma is related to intraocular pressure and IOP-induced effects on extracellular matrix. Invest Ophthalmol Vis Sci. 2005;46:175–182. doi: 10.1167/iovs.04-0832. - DOI - PMC - PubMed
    1. Weinreb RN, Aung T, Medeiros FA. The pathophysiology and treatment of glaucoma: a review. JAMA. 2014;311:1901–1911. doi: 10.1001/jama.2014.3192. - DOI - PMC - PubMed
    1. Heijl A, et al. Reduction of intraocular pressure and glaucoma progression: results from the Early Manifest Glaucoma Trial. Arch Ophthalmol. 2002;120:1268–1279. doi: 10.1001/archopht.120.10.1268. - DOI - PubMed
    1. Ghiso JA, Doudevski I, Ritch R, Rostagno AA. Alzheimer’s disease and glaucoma: mechanistic similarities and differences. J Glaucoma. 2013;22:S36. doi: 10.1097/IJG.0b013e3182934af6. - DOI - PMC - PubMed
    1. Frost S, Martins RN, Kanagasingam Y. Ocular biomarkers for early detection of Alzheimer’s disease. J Alzheimers Dis. 2010;22:1–16. doi: 10.3233/JAD-2010-100819. - DOI - PubMed

MeSH terms