

Resting vs. active: a meta-analysis of the intra- and inter-specific associations between minimum, sustained, and maximum metabolic rates in vertebrates
- PMID: 28979057
- PMCID: PMC5600087
- DOI: 10.1111/1365-2435.12879
Resting vs. active: a meta-analysis of the intra- and inter-specific associations between minimum, sustained, and maximum metabolic rates in vertebrates
Abstract
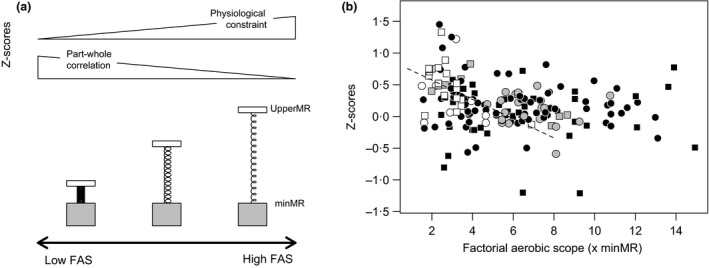
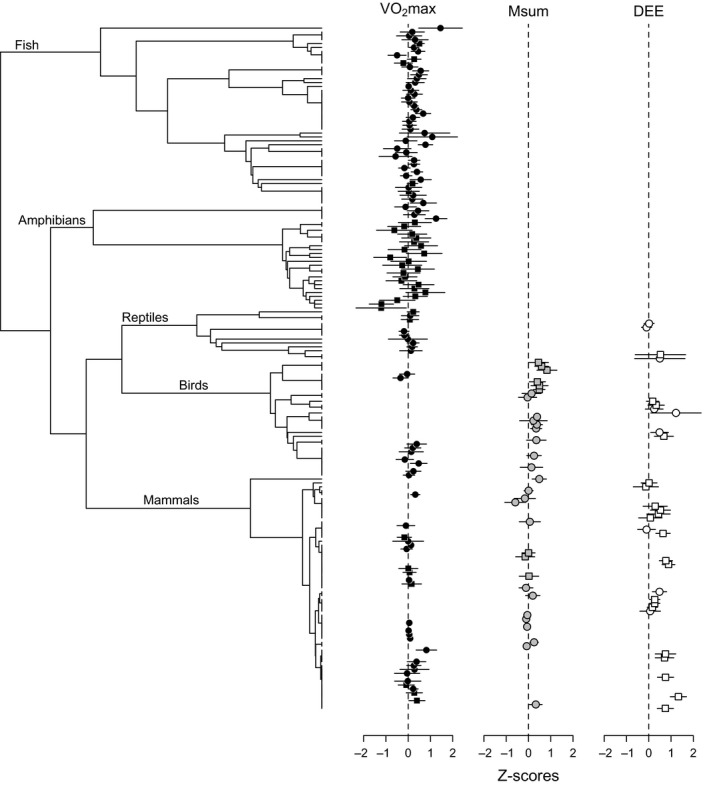
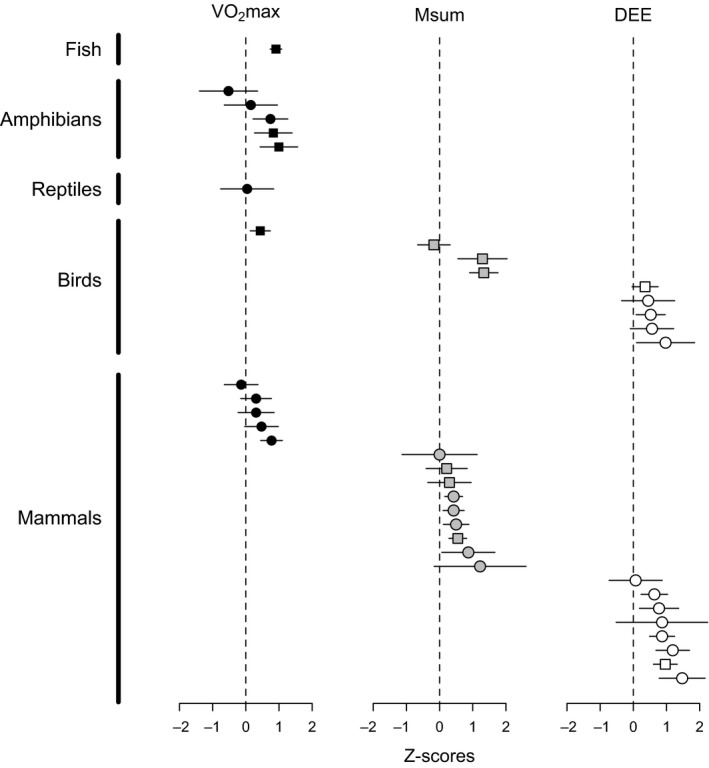
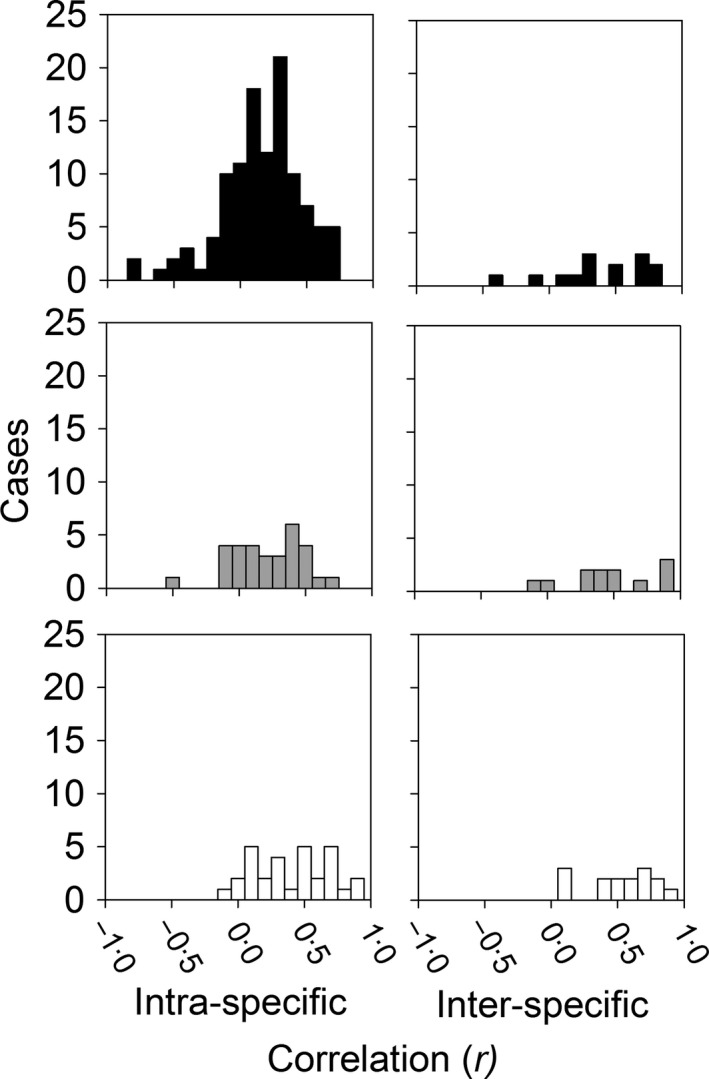
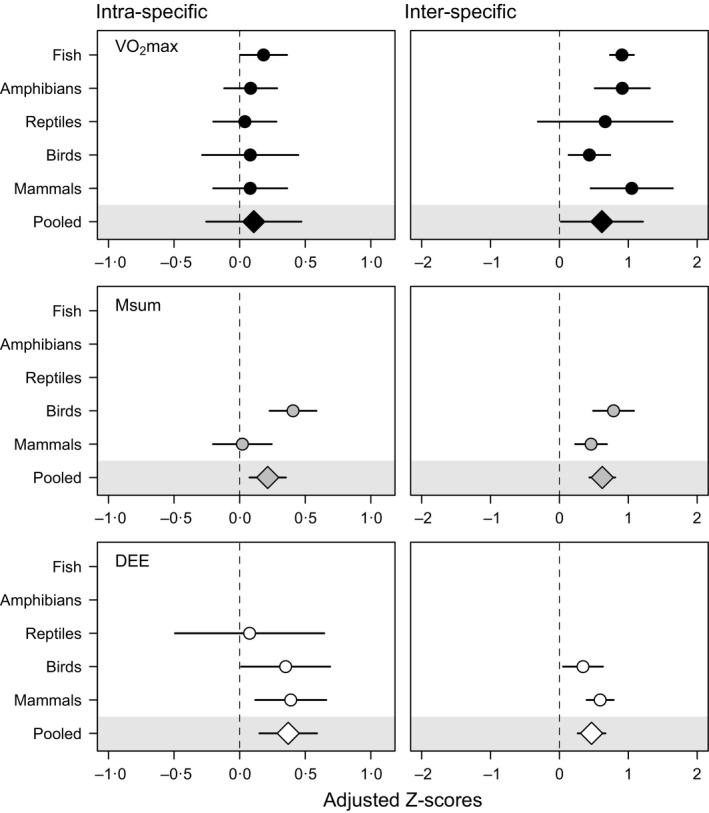
Variation in aerobic capacity has far reaching consequences for the physiology, ecology, and evolution of vertebrates. Whether at rest or active, animals are constrained to operate within the energetic bounds determined by their minimum (minMR) and sustained or maximum metabolic rates (upperMR). MinMR and upperMR can differ considerably among individuals and species but are often presumed to be mechanistically linked to one another. Specifically, minMR is thought to reflect the idling cost of the machinery needed to support upperMR. However, previous analyses based on limited datasets have come to conflicting conclusions regarding the generality and strength of their association.Here we conduct the first comprehensive assessment of their relationship, based on a large number of published estimates of both the intra-specific (n = 176) and inter-specific (n = 41) phenotypic correlations between minMR and upperMR, estimated as either exercise-induced maximum metabolic rate (VO 2max), cold-induced summit metabolic rate (Msum), or daily energy expenditure (DEE).Our meta-analysis shows that there is a general positive association between minMR and upperMR that is shared among vertebrate taxonomic classes. However, there was stronger evidence for intra-specific correlations between minMR and Msum and between minMR and DEE than there was for a correlation between minMR and VO 2max across different taxa. As expected, inter-specific correlation estimates were consistently higher than intra-specific estimates across all traits and vertebrate classes.An interesting exception to this general trend was observed in mammals, which contrast with birds and exhibit no correlation between minMR and Msum. We speculate that this is due to the evolution and recruitment of brown fat as a thermogenic tissue, which illustrates how some species and lineages might circumvent this seemingly general association.We conclude that, in spite of some variability across taxa and traits, the contention that minMR and upperMR are positively correlated generally holds true both within and across vertebrate species. Ecological and comparative studies should therefore take into consideration the possibility that variation in any one of these traits might partly reflect correlated responses to selection on other metabolic parameters. A lay summary is available for this article.
Keywords: aerobic capacity; daily energy expenditure; locomotion; maximum thermogenesis; resting metabolic rate; standard metabolic rate.
Figures
References
-
- Alsop, D. & Wood, C. (1997) The interactive effects of feeding and exercise on oxygen consumption, swimming performance and protein usage in juvenile rainbow trout (Oncorhynchus mykiss). Journal of Experimental Biology, 200, 2337–2346. - PubMed
-
- Anderson, K.J. & Jetz, W. (2005) The broad‐scale ecology of energy expenditure of endotherms. Ecology Letters, 8, 310–318.
-
- Artacho, P. & Nespolo, R.F. (2009) Natural selection reduces energy metabolism in the garden snail, Helix aspersa (Cornu aspersum). Evolution, 63, 1044–1050. - PubMed
-
- Auer, S.K. , Salin, K. , Rudolf, A.M. , Anderson, G.J. & Metcalfe, N.B. (2015b) The optimal combination of standard metabolic rate and aerobic scope for somatic growth depends on food availability. Functional Ecology, 29, 479–486.
LinkOut - more resources
Full Text Sources
Other Literature Sources
Research Materials