. 2017 Sep 20:8:1140.
doi: 10.3389/fimmu.2017.01140. eCollection 2017.

Unraveling Macrophage Heterogeneity in Erythroblastic Islands

Affiliations

Unraveling Macrophage Heterogeneity in Erythroblastic Islands

Katie Giger Seu et al. Front Immunol. .

Abstract

Mammalian erythropoiesis occurs within erythroblastic islands (EBIs), niches where maturing erythroblasts interact closely with a central macrophage. While it is generally accepted that EBI macrophages play an important role in erythropoiesis, thorough investigation of the mechanisms by which they support erythropoiesis is limited largely by inability to identify and isolate the specific macrophage sub-population that constitute the EBI. Early studies utilized immunohistochemistry or immunofluorescence to study EBI morphology and structure, while more recent efforts have used flow cytometry for high-throughput quantitative characterization of EBIs and their central macrophages. However, these approaches based on the expectation that EBI macrophages are a homogeneous population (F4/80+/CD169+/VCAM-1+ for example) provide an incomplete picture and potentially overlook critical information about the nature and biology of the islands and their central macrophages. Here, we present a novel method for analysis of EBI macrophages from hematopoietic tissues of mice and rats using multispectral imaging flow cytometry (IFC), which combines the high-throughput advantage of flow cytometry with the morphological and fluorescence features derived from microscopy. This method provides both quantitative analysis of EBIs, as well as structural and morphological details of the central macrophages and associated cells. Importantly, the images, combined with quantitative software features, can be used to evaluate co-expression of phenotypic markers which is crucial since some antigens used to identify macrophages (e.g., F4/80 and CD11b) can be expressed on non-erythroid cells associated with the islands instead of, or in addition to the central macrophage itself. We have used this method to analyze native EBIs from different hematopoietic tissues and evaluated the expression of several markers that have been previously reported to be expressed on EBI macrophages. We found that VCAM-1, F4/80, and CD169 are expressed heterogeneously by the central macrophages within the EBIs, while CD11b, although abundantly expressed by cells within the islands, is not expressed on the EBI macrophages. Moreover, differences in the phenotype of EBIs in rats compared to mice point to potential functional differences between these species. These data demonstrate the usefulness of IFC in analysis and characterization of EBIs and more importantly in exploring the heterogeneity and plasticity of EBI macrophages.

Keywords: CD11b; CD163; CD169; VCAM-1; erythroblastic islands; erythropoiesis; imaging flow cytometry; macrophages.


Figures
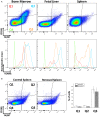
Figure 1
Figure 1
Flow cytometric analysis of F4/80, CD169, and vascular cell adhesion molecule-1 (VCAM-1) expression levels within the bone marrow (BM), fetal liver (FL), and spleen (SP) of C57Bl/6 mice. (A) The BM contains the largest double positive for F4/80 and CD169 population and demonstrates a high level of VCAM-1 expression. VCAM-1 expression is plotted in the lower graphs in red (Q1: F4/80;CD169+), light blue (Q2: F4/80+;CD169+), orange (Q3: F4/80+;CD169), or green (Q2: F4/80;CD169). Although the FL and stressed SP have lower amounts of F4/80+;CD169+, these double positive cells at the Q2 quadrant still express VCAM-1 highly. (B) Expression of CD169 and F4/80 in the spleen does not change significantly after induction of stress erythropoiesis.
Figure 2
Figure 2
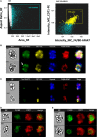
Gating strategy of erythroblastic islands (EBIs) for analysis by imaging flow cytometry (IFC). (A) Left panel: multiplets (cell clusters) characterized by their large area in brightfield (BF) are gated. Right panel: the cell clusters are then plotted as per intensity of F4/80 and of CD71 stain. The gate containing clusters high in fluorescence intensity for both F4/80 and CD71 is enriched in EBIs (gate). Manual inspection of the cell clusters in the EBI gate allows confirmation of the events (tagged yellow) that clearly have the structure of an EBI. Some EBIs are located outside of the EBI gate but with decreased frequency. (B) Examples of EBIs (representative of the yellow-marked events within the EBI gate) characterized by a central F4/80+ macrophage surrounded by CD71+ and/or Ter119+ erythroblasts. An anucleate reticulocyte (arrow) is occasionally seen, still in contact with the macrophage. (C) Examples of cell clusters, which although within the EBI gate (double positive for F4/80 and CD71), do not have the classic appearance of an intact EBI. These events would have been included in the analysis by “blind” flow cytometry, potentially leading to misguided conclusions about EBI macrophage markers. (D) Representative examples of EBIs isolated from mouse spleen after development of stress erythropoiesis (4 days post-induction of anemia with phlebotomy of 500 µL of blood). (E) Representative examples of EBIs isolated from mouse fetal livers (E13.5).
Figure 3
Figure 3
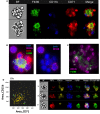
The central macrophage in erythroblastic islands (EBIs) is not CD11b+; however, other CD11b+ cells may participate in the EBI structure. (A) Mouse bone marrow EBIs stained with fluorescently conjugated antibodies against CD71, CD11b, and F4/80 and analyzed by imaging flow cytometry (IFC) indicate that CD11b positivity in EBIs is due to CD11b+ cells peripherally attached to the EBI macrophage and/or the erythroblasts; the central macrophage is not CD11b+. (B) A representative EBI imaged by immunofluorescence microscopy also showing that the F4/80+ central macrophage is not stained by anti-CD11b, while a cell attached to the macrophage and another one in close proximity are CD11b+. (C) Another example showing that F4/80+ cells in mouse bone clusters are not CD11b-bright, in contrast to adjacent cells that have a clear membranous stain for CD11b. (D) IFC analysis of mouse bone marrow EBIs, stained for F4/80, CD71, and CD11b indicates that CD11b+ cells are a consistent component of the EBI.
Figure 4
Figure 4
Central macrophages are VCAM-1+. (A) All of the erythroblastic island (EBI) macrophages in the mouse bone marrow are positive for vascular cell adhesion molecule-1 (VCAM-1) (top), while there are a few additional clusters of erythroblasts surrounding VCAM-1+;F4/80lo macrophages (bottom). (B) Similarly, in the mouse fetal liver EBIs, all F4/80+ central macrophages are also VCAM-1+ (top). However, the clusters containing CD71+ erythroblasts around a central VCAM-1+ cell with low or intermediate F4/80 staining in the fetal liver are much more frequent than in the bone marrow (bottom). (C) CD71+ clusters with VCAM-1+;F4/80lo macrophages are significantly increased in the fetal liver (74 ± 6%) compared to steady-state bone marrow (10 ± 2%). A smaller but significant increase is seen in the spleen (30 ± 2%) and bone marrow (39 ± 8%) after induction of stress. Data shown are mean ± SE, *p ≤ 0.05, **p ≤ 0.001.
Figure 5
Figure 5
The majority of mouse bone marrow erythroblastic island (EBI) macrophages are CD169 + although the staining pattern is heterogeneous. (A) By imaging flow cytometry, some F4/80+ EBI macrophages appear CD169+ (top), but many do not exhibit clear staining (bottom). Staining was suboptimal with all anti-mouse CD169 antibodies tested and positivity was determined by mean pixel value since a clear image was not always observed. (B) The similarity feature was used to compare the staining pattern of the CD169 to that of F4/80. The mean value for the similarity of CD169 to F4/80 was 1.7 ± 0.2 (242 EBIs from four biological samples), whereas vascular cell adhesion molecule-1 (VCAM-1), which had a high correlation with F4/80 expression, has mean value of 2.2 ± 0.6 (811 EBIs, 10 biological samples) and CD11b, which was very dissimilar from F4/80, gives a mean value of 0.82 ± 0.4 (484 EBIs, 6 biological samples). Distributions shown are from representative experiments.
Figure 6
Figure 6
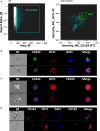
Analysis of erythroblastic islands (EBIs) from rat bone marrow by IFC. (A) Left panel: Multiplets (cell clusters) characterized by their large area in brightfield (BF) are gated. Right panel: The cell clusters are then plotted as per intensity of CD163 and of CD71 stain. The gate containing clusters high in fluorescence intensity for both CD163 and CD71 is enriched in EBIs (EBI gate). Manual inspection of the cell clusters in the EBI gate allows confirmation of the events that have clearly the structure of an EBI. (B,C) Examples of EBIs (within the EBI gate) characterized by a central CD163+/CD169 macrophage surrounded by CD71+ erythroblasts. (D) Examples of cell clusters which although within the EBI gate (double positive for CD163 and CD71) do not have the classic appearance of an intact EBI. These events would have been included in the analysis by “blind” flow cytometry, potentially leading to misguided conclusions about EBI macrophage markers.
Figure 7
Figure 7
CD163 is poorly detectable in mouse erythroblastic island (EBI) macrophages by imaging flow cytometry. (A) Antibodies against CD163 did not reliably stain the mouse EBI macrophages. (B) There were cells at the same experiment, single or present in clusters, which were stained as CD163+. (C) Flow cytometric analysis of unfixed murine peripheral WBCs showed that the antibody used labels mouse peripheral blood cells as well as it labels human monocytes.

References

    1. Palis J. Primitive and definitive erythropoiesis in mammals. Front Physiol (2014) 5:3.10.3389/fphys.2014.00003 - DOI - PMC - PubMed
    1. Franco RS. Measurement of red cell lifespan and aging. Transfus Med Hemother (2012) 39(5):302–7.10.1159/000342232 - DOI - PMC - PubMed
    1. Van Putten LM. The life span of red cells in the rat and the mouse as determined by labeling with DFP32 in vivo. Blood (1958) 13(8):789–94. - PubMed
    1. Palis J. Ontogeny of erythropoiesis. Curr Opin Hematol (2008) 15(3):155–61.10.1097/MOH.0b013e3282f97ae1 - DOI - PubMed
    1. Paulson RF, Shi L, Wu DC. Stress erythropoiesis: new signals and new stress progenitor cells. Curr Opin Hematol (2011) 18(3):139–45.10.1097/MOH.0b013e32834521c8 - DOI - PMC - PubMed