

Forecasting seasonal influenza with a state-space SIR model
- PMID: 28979611
- PMCID: PMC5623938
- DOI: 10.1214/16-AOAS1000
Forecasting seasonal influenza with a state-space SIR model
Abstract
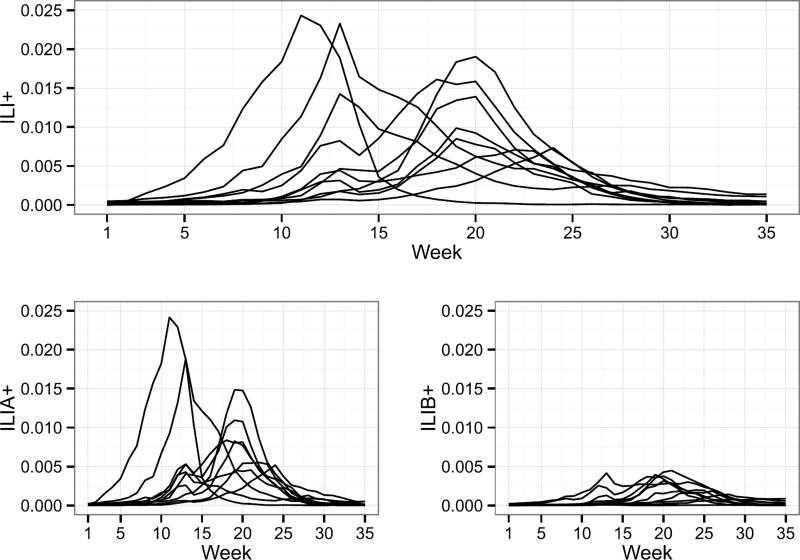
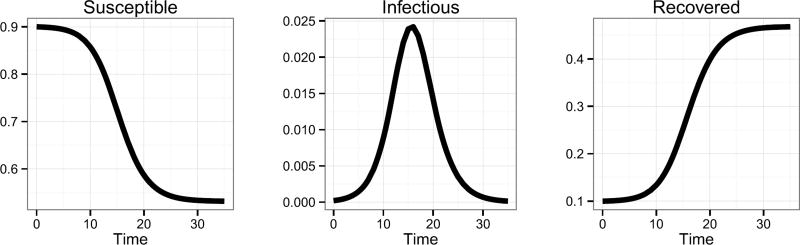
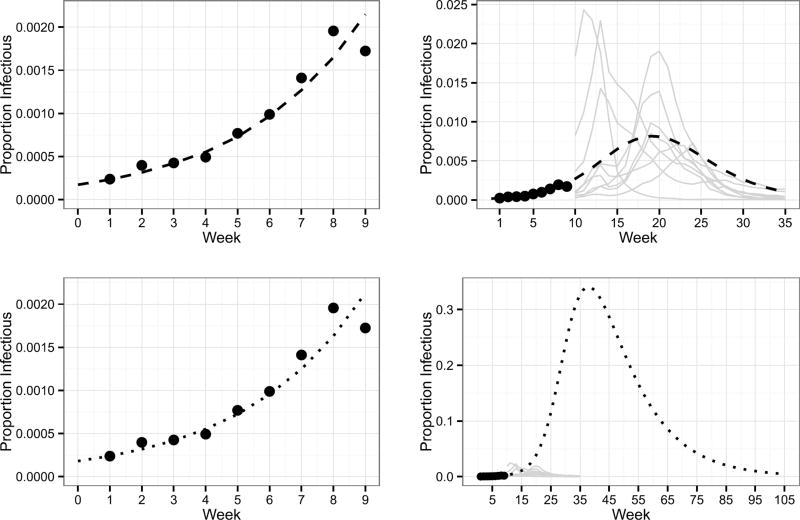
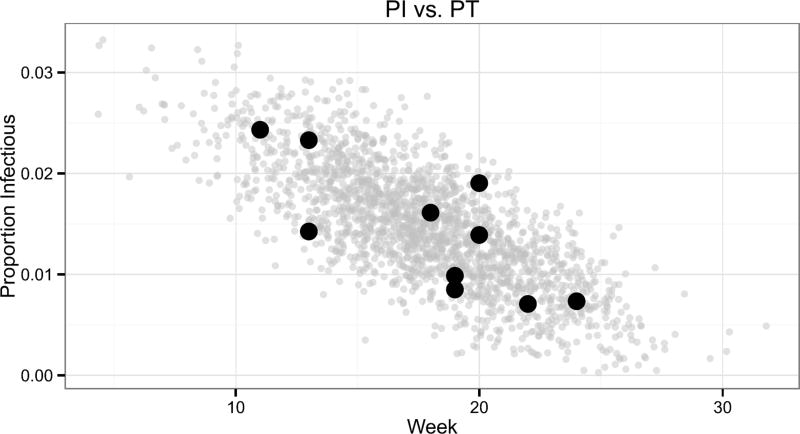
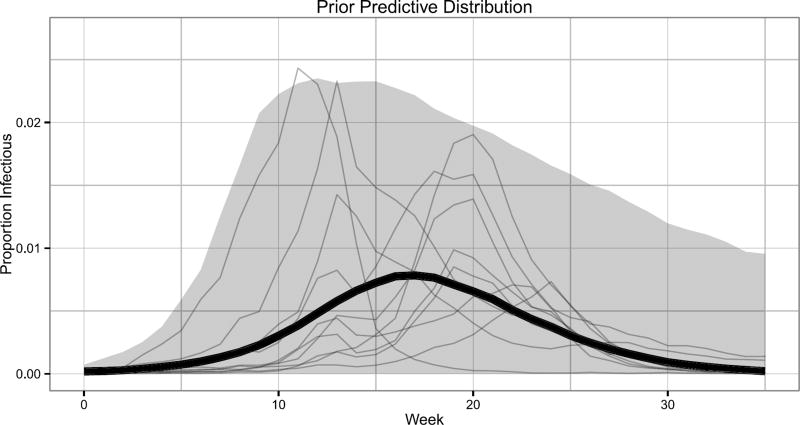
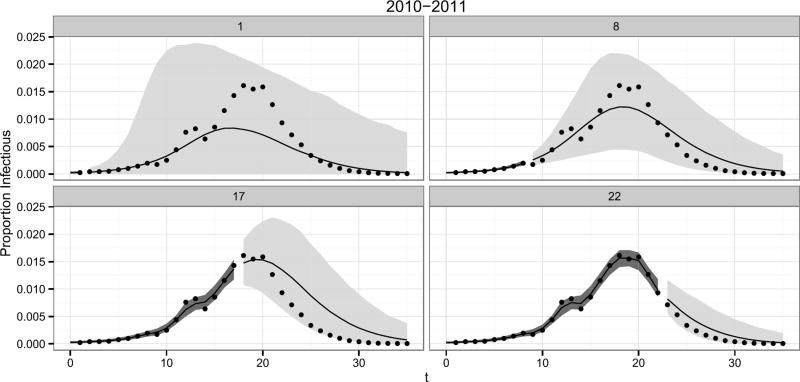
Seasonal influenza is a serious public health and societal problem due to its consequences resulting from absenteeism, hospitalizations, and deaths. The overall burden of influenza is captured by the Centers for Disease Control and Prevention's influenza-like illness network, which provides invaluable information about the current incidence. This information is used to provide decision support regarding prevention and response efforts. Despite the relatively rich surveillance data and the recurrent nature of seasonal influenza, forecasting the timing and intensity of seasonal influenza in the U.S. remains challenging because the form of the disease transmission process is uncertain, the disease dynamics are only partially observed, and the public health observations are noisy. Fitting a probabilistic state-space model motivated by a deterministic mathematical model [a susceptible-infectious-recovered (SIR) model] is a promising approach for forecasting seasonal influenza while simultaneously accounting for multiple sources of uncertainty. A significant finding of this work is the importance of thoughtfully specifying the prior, as results critically depend on its specification. Our conditionally specified prior allows us to exploit known relationships between latent SIR initial conditions and parameters and functions of surveillance data. We demonstrate advantages of our approach relative to alternatives via a forecasting comparison using several forecast accuracy metrics.
Keywords: Bayesian modeling; SIR model; forecasting; influenza; state-space modeling; time-series.
Figures
References
-
- Anderson JL. An ensemble adjustment Kalman filter for data assimilation. Mon. Weather Rev. 2001;129:2884–2903.
-
- Brauer F, van den Driessche P, Wu J, editors. Mathematical Epidemiology. Lecture Notes in Math. Vol. 1945. Berlin: Springer; 2008. MR2452129.
-
- Capaldi A, Behrend S, Berman B, Smith J, Wright J, Lloyd AL. Parameter estimation and uncertainty quantification for an epidemic model. Math. Biosci. Eng. 2012;9:553–576. MR2957535. - PubMed
-
- CDC.gov. [Accessed: 02-06-2017];Influenza (Flu) Past Pandemics. 2017 Available at http://www.cdc.gov/flu/pandemic-resources/basics/past-pandemics.html.
-
- Centers for Disease Control and Prevention. [Accessed: 05-5-2015];Free resources. 2014a Available at http://www.cdc.gov/flu/freeresources/
Grants and funding
LinkOut - more resources
Full Text Sources
Other Literature Sources