. 2017 Dec;92(6):1232-1244.
doi: 10.1111/tpj.13731. Epub 2017 Nov 18.

Identification of Chlamydomonas reinhardtii endogenous genic flanking sequences for improved transgene expression

Affiliations

Identification of Chlamydomonas reinhardtii endogenous genic flanking sequences for improved transgene expression

Cristina López-Paz et al. Plant J. 2017 Dec.

Abstract

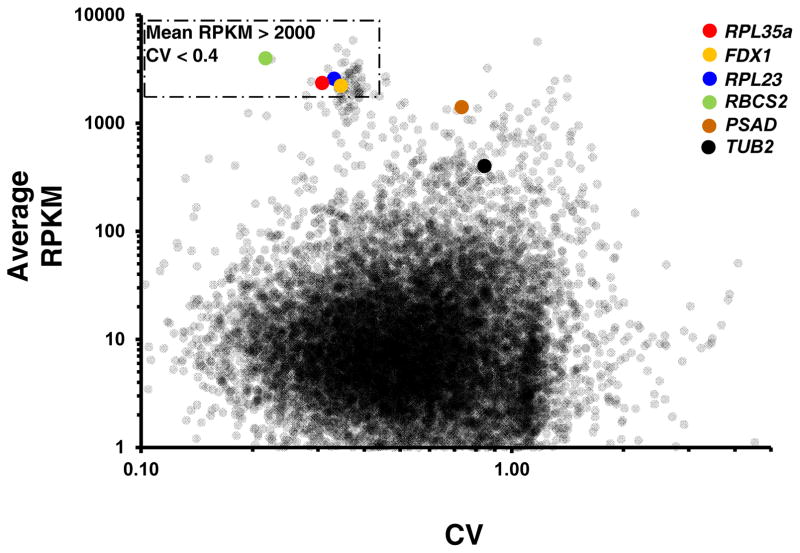
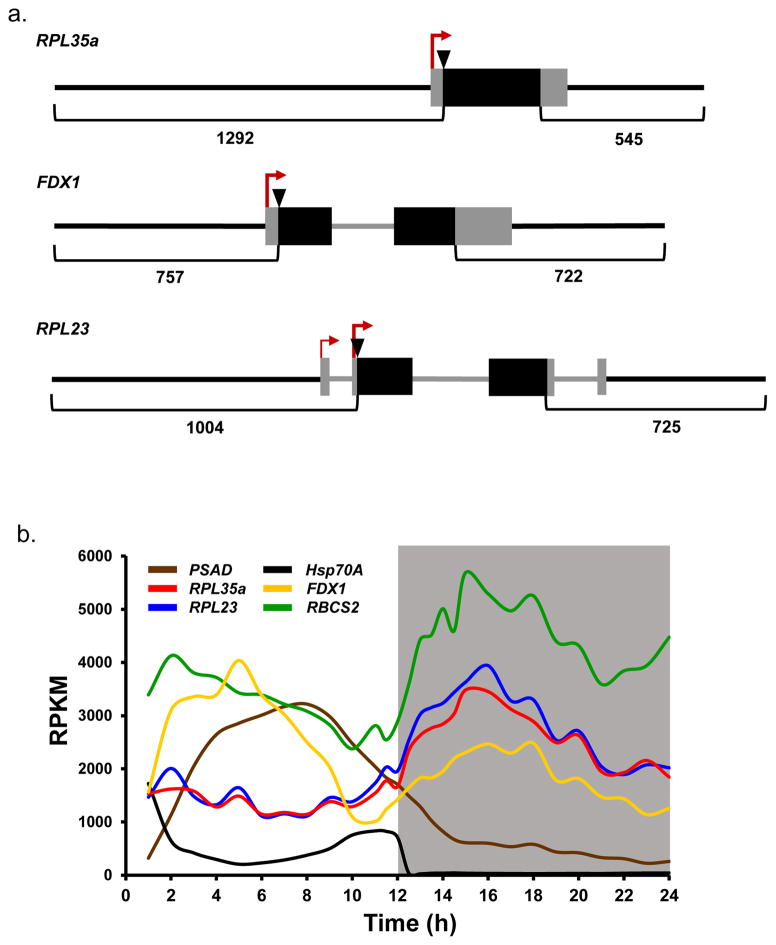
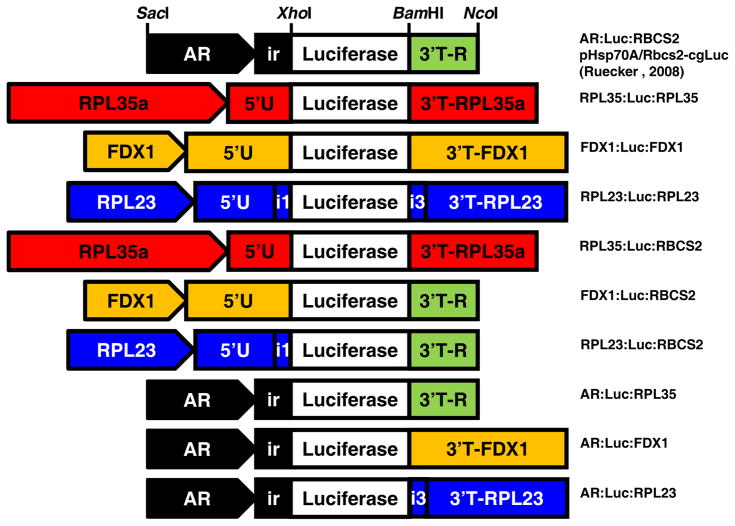
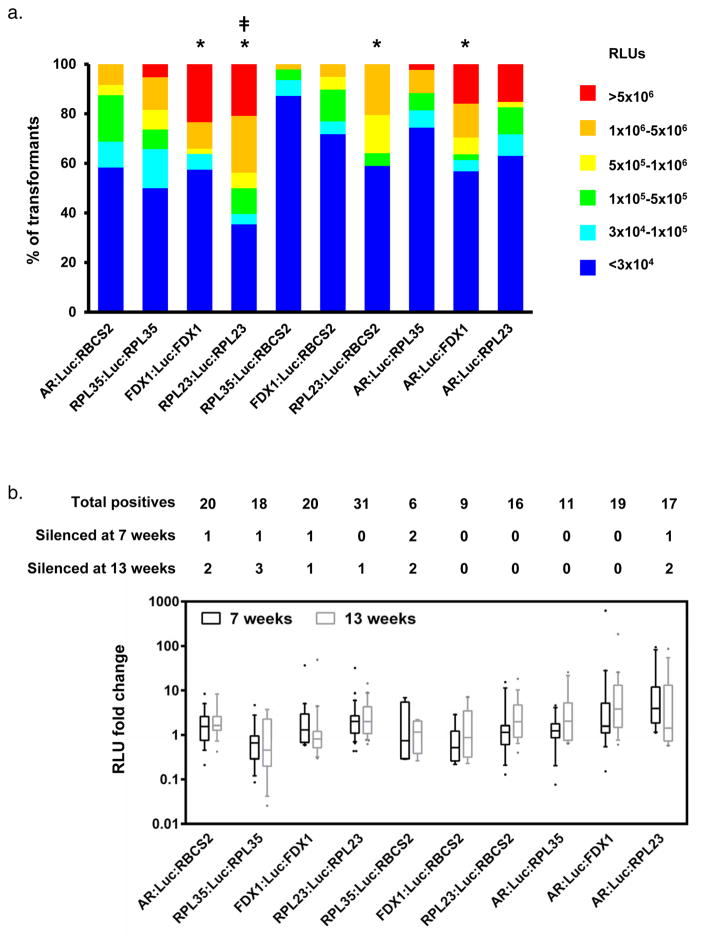
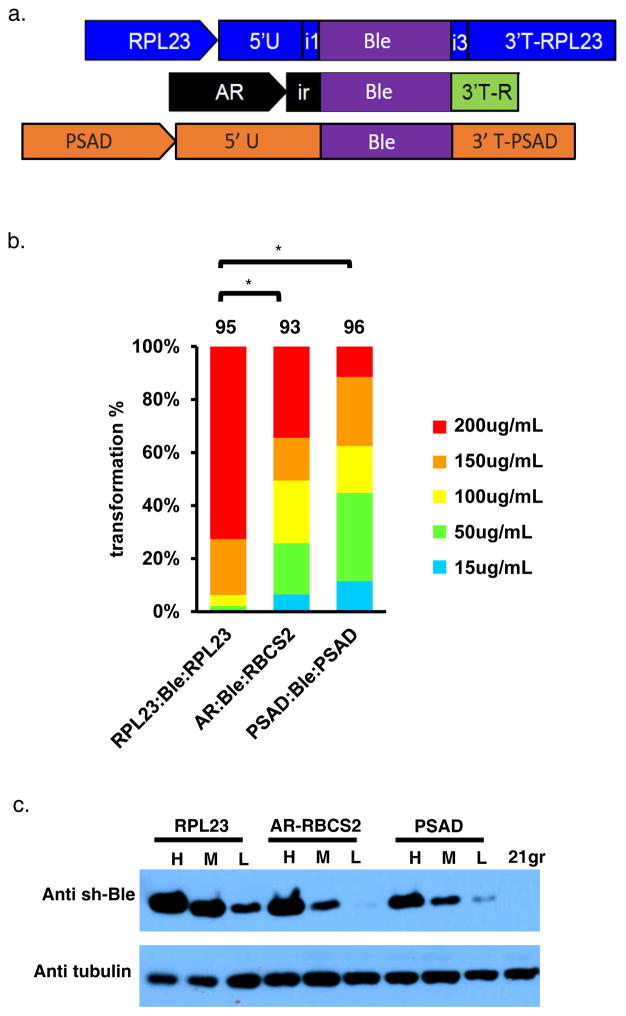
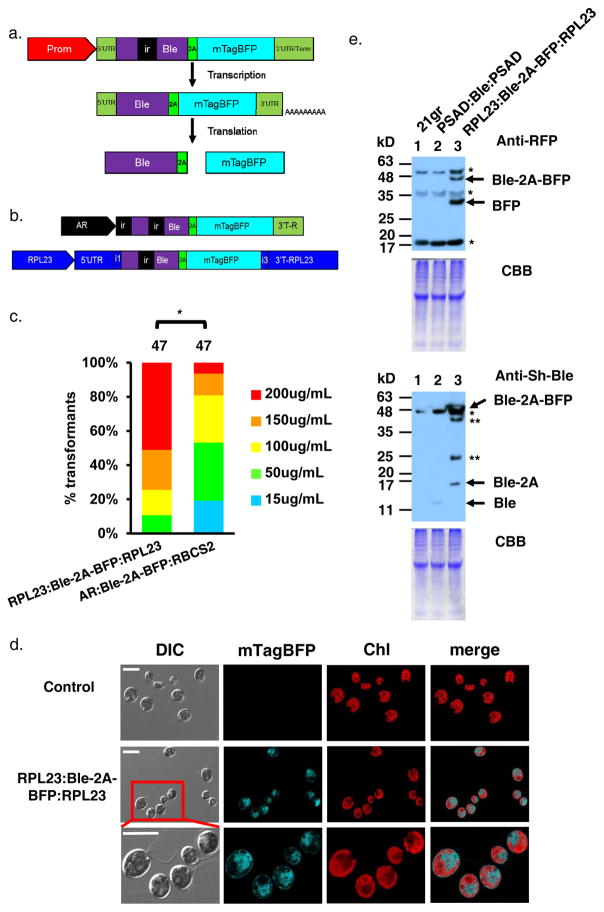
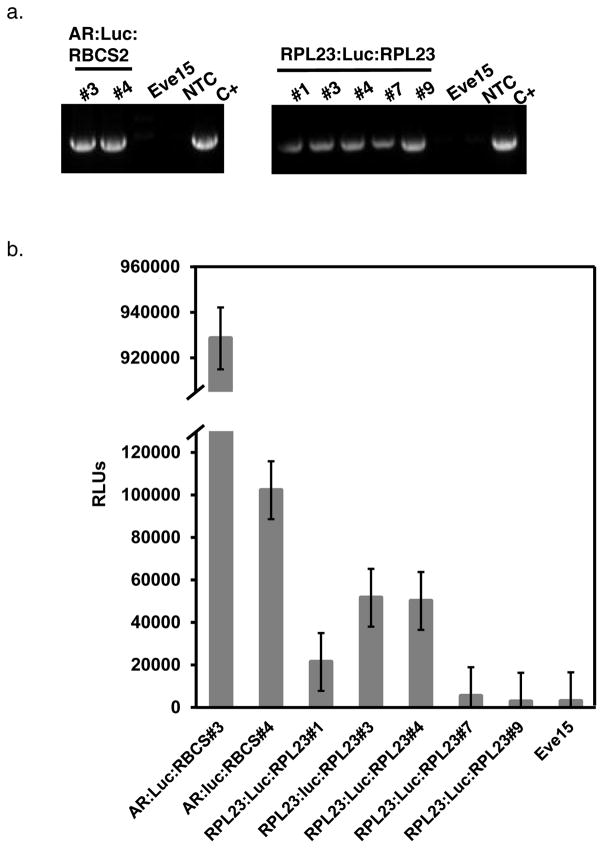
Chlamydomonas reinhardtii is a unicellular green alga that has attracted interest due to its potential biotechnological applications, and as a model for algal biofuel and energy metabolism. Despite all the advantages that this unicellular alga offers, poor and inconsistent expression of nuclear transgenes remains an obstacle for basic and applied research. We used a data-mining strategy to identify highly expressed genes in Chlamydomonas whose flanking sequences were tested for the ability to drive heterologous nuclear transgene expression. Candidates identified in this search included two ribosomal protein genes, RPL35a and RPL23, and ferredoxin, FDX1, whose flanking regions including promoters, terminators and untranslated sequences could drive stable luciferase transgene expression to significantly higher levels than the commonly used Hsp70A-RBCS2 (AR) hybrid promoter/terminator sequences. The RPL23 flanking sequences were further tested using the zeocin resistance gene sh-ble as a reporter in monocistronic and dicistronic constructs, and consistently yielded higher numbers of zeocin-resistant transformants and higher levels of resistance than AR- or PSAD-based vectors. Chlamydomonas RPL23 sequences also enabled transgene expression in Volvox carteri. Our study provides an additional benchmark for strong constitutive expression of transgenes in Chlamydomonas, and develops a general approach for identifying flanking sequences that can be used to drive transgene expression for any organism where transcriptome data are available.

Keywords: Chlamydomonas reinhardtii; Volvox carteri; dicistronic vector; luciferase; promoter; skipping peptide; technical advance; terminator; untranslated region.


Figures

Figure 1
Figure 1. Identifying highly expressed genes with low diurnal variance from transcriptome data
Log-scale plot showing mean diurnal expression level as reads per kilobase per million reads mapped (RPKM) versus coefficient of variance (CV) for 17737 Chlamydomonas genes from (Zones et al., 2015). The region of the graph containing high average expression (RPKM>2000) and low variance (CV<0.4) is boxed with a rectangle. Values for genes described in the text are plotted in color according to the key in the upper right.
Figure 2
Figure 2. Structures and expression profiles of selected highly expressed genes
(a) Schematics of genomic structure for selected genes based on gene models from Phytozome v12 with modifications based on empirical data (ESTs from Phytozome and collected EST/cDNA and RNA-seq data at http://genomes.mcdb.ucla.edu/cgi-bin/hgTracks?db=chlRei2). Gray boxes represent UTRs, black boxes represent exons, gray lines represent introns, and black lines represent non-transcribed regions. Brackets show the predicted flanking control regions (promoter/UTRs/terminators) that were amplified and used in reporter gene constructs. Lengths of each amplified segment are indicated below each bracket. Start codon positions are indicated by inverted triangles, and estimated transcription start sites by red arrows. The following modified coordinates are based on the Chlamydomonas v5.5 genome hosted on Phytozome v12. For RPL35a the transcription start site (TSS) is estimated at Chr10:5515163 and shortens the 5′UTR compared to the Phytozome model. For FDX1 the TSS is estimated at Chr14:2717680 and shortens the 5′UTR compared to the Phytozome model. For RPL23 there is a major TSS estimated at Chr4:1821718 which shortens the 5′UTR compared to the Phytozome model and which does not include the first exon and intron. A minor but well-supported TSS is at Chr4:1821798 and produces a transcript containing an extended 5′ UTR with an additional exon and intron as shown in the schematic. (b) Normalized diurnal expression profiles shown as reads per kilobase per million reads mapped (RPKMs) of RPL35a (Cre10.g459250.t1.2), RPL23 (Cre04.g211800.t1.2), FDX1 (Cre14.g626700.t1.2), PSAD (Cre05.g238332.t1.1), Hsp70A (Cre08.g372100.t1.2) and RBCS2 (Cre02.g120150.t1.2) in synchronized cultures (Zones et al., 2015). Light and dark periods are indicated by light and dark shaded regions.
Figure 3
Figure 3. Schematic representation of luciferase reporter constructs
Hsp70/RBCS2 (AR) promoter including RBCS2 first intron and RBCS2 terminator from plasmid pHsp70A/Rbcs2-cgLuc (Ruecker et al. 2008) were replaced with flanking regions from genes to be tested using the indicated restriction sites. Predicted promoters are indicated as rectangles with arrowheads and are followed by 5′UTRs. Flanking regions are color coded by gene as follows: RPL35a, red; RBCS2, green; Hsp70A/RBCS2 (AR), black; FDX1, yellow; RPL23, blue. Genic regions are labeled as follows: 3′T, terminator and 3′UTR; 5′U, 5′UTR; ir, RBCS2 first intron; i1 and i3, first and third introns of RPL23.
Figure 4
Figure 4. Expression efficiency of luciferase reporter constructs
(a) Distribution of normalized luciferase expression (RLU) values from wild type Chlamydomonas strain 6145c transformed with constructs illustrated in Fig. 3. Number of transformants analyzed: AR:Luc:RBCS2,48; RPL35:Luc:RPL35, 38; FDX1:Luc:FDX1, 47;RPL23:Luc:RPL23, 48; RPL35:Luc:RBCS2, 47; FDX1:Luc:RBCS2, 39; RPL23:Luc:RBCS2, 39; AR:Luc:RPL35,43; AR:Luc:FDX1, 44; AR:Luc:RPL23, 46. 3x10⁴ RLUs is the background (negative) threshold. ‡ indicates a significantly higher proportion of positive transformants than the control construct, AR:Luc:RBCS2, determined by Fisher’s exact test (p<0.05). * indicates a significant increase in expression levels for positive transformants compared with the control construct determined by a two-tailed Mann-Whitney U test (p<0.05). (b) Stability of luciferase transgene expression from selected individual transformants was monitored at 7 weeks (black box-whisker plots) and 13 weeks (gray-whisker box plots) from initial screening. The Table above shows numbers of initial positive transformants in the first row with numbers of silenced transformants at seven and thirteen weeks in the next two rows, respectively. The box and whisker plots show fold-change data for positive clones at seven and thirteen weeks. Boxes enclose the second quartile of data with horizontal lines showing median values, and whiskers enclose the 10th–90th percentiles. Outliers are plotted as individual data points.
Figure 5
Figure 5. Comparison of RPL23, AR-RBCS2 and PSAD flanking sequences driving sh-ble expression
(a) Schematics of constructs used to compare RPL23, AR-RBCS2 and PSAD flanking sequences driving sh-ble expression. Constructs are labeled as in Fig. 3. PSAD sequences in vector pGenD-ble (Fischer and Rochaix, 2001) are labeled in orange. (b) Distribution of maximum zeocin resistance levels in wild-type (21gr) transformants with constructs illustrated in 5a. The number of transformants analyzed: RPL23:Ble:RPL23, 95; AR:Ble:RBCS2, 93; PSAD:Ble:PSAD (same as pGenD-Ble), 96. Results of a two-tailed Mann-Whitney U test applied to pairs of data are indicated with black brackets (*, p<0.01). (c) Immunoblotting of total proteins of selected strains from Fig. 5b with different relative zeocin resistance levels: high (H), medium (M), and low (L). Duplicate blots were probed with anti-sh-Ble (top) and anti-tubulin (bottom) as a loading control.
Figure 6
Figure 6. Expression of Ble-2A-BFP cassette driven by RPL23 flanking sequences
(a) Schematic of gene expression from the dicistronic Ble-2A-BFP cassette. Separate proteins are produced from a single dicistronic mRNA due to ribosome skipping at the 2A peptide during translation. Prom, predicted promoter; ir, first intron of RBCS2; Ble, sh-ble; 2A, FMDV 2A translational skipping peptide; mTagBFP, blue fluorescent protein. (b) Schematics of constructs used to compare RPL23 and AR-RBCS2 flanking sequences in driving expression of the dicistronic Ble-2A-BFP cassette. Constructs are labeled as in Fig. 3. (c) Distribution of maximum zeocin resistance from transformants with constructs illustrated in Fig. 6b. The number of transformants analyzed: RPL23:Ble-2A-BFP:RPL23, 47; AR:Ble-2A-BFP:RBCS2, 47. Results of a two-tailed Mann-Whitney U Test are shown above (*, p<0.01). (d) Live cell confocal fluorescence microscopy of a negative control strain expressing RPL23:Ble:RPL23 and a positive transformant expressing RPL23:Ble-2A-BFP:RPL23 with maximum zeocin resistance of 100ug/mL. Left to right panels show representative fields of cells imaged using DIC, or fluorescence with mTagBFP colored cyan, chlorophyll (chl) colored red, and merged fluorescence signals. The lower row is a higher magnification inset from the middle panel. Scale bar=12μm. (e) Immunoblots from a control wild type strain 21gr (lane 1) and representative transformants expressing PSAD:Ble:PSAD as a control (lane 2) or RPL23:Ble-2A-BFP:RPL23 (lane 3). Duplicate blots were probed separately with anti-RFP (upper panels) and anti-sh-Ble (lower panels) antibodies. Black arrows on upper blot indicate signals for unprocessed Ble-2A-BFP and processed free BFP. Asterisks indicate background bands. Black arrows on lower blot indicate unprocessed Ble-2A-BFP, processed Ble-2A, or Ble protein from the monomeric PSAD expression construct. Single asterisk indicates a background band. Double asterisks are possible breakdown products detected only with sh-Ble antibodies (see also Fig. S8). Coomassie blue staining for each post-transfer gel is shown as a loading control.
Figure 7
Figure 7. RPL23 and AR driven gene expression in Volvox carteri.
(a) PCR genotyping of independent Volvox transformants. Left panel, AR:Luc:RBCS2 transformants; right panel, RPL23:Luc:RPL23 transformants. Eve15, wild type parental strain; NTC, no template control; C+, plasmid used for positive control. (b) Comparison of luciferase activity from reporter constructs transformed into Volvox carteri. Independent transformants are shown for each construct. RLUs were normalized per total protein in each lysate. Error bars, S.D. of two technical replicates.

Similar articles

Cited by

References

    1. Almaraz-Delgado A, Flores-Uribe J, Pérez-España V, Salgado-Manjarrez E, Badillo-Corona J. Production of therapeutic proteins in the chloroplast of Chlamydomonas reinhardtii. AMB Express. 2014;4:57. - PMC - PubMed
    1. Barahimipour R, Strenkert D, Neupert J, Schroda M, Merchant SS, Bock R. Dissecting the contributions of GC content and codon usage to gene expression in the model alga Chlamydomonas reinhardtii. Plant J. 2015;84:704–17. - PMC - PubMed
    1. Berthold P, Schmitt R, Mages W. An engineered Streptomyces hygroscopicus aph 7″ gene mediates dominant resistance against hygromycin B in Chlamydomonas reinhardtii. Protist. 2002;153:401–412. - PubMed
    1. Boynton JE, Gillham NW, Harris EH, et al. Chloroplast transformation in Chlamydomonas with high velocity microprojectiles. Science. 1988;240:1534–1538. - PubMed
    1. Casas-Mollano JA, Rohr J, Kim EJ, Balassa E, van Dijk K, Cerutti H. Diversification of the core RNA interference machinery in Chlamydomonas reinhardtii and the role of DCL1 in transposon silencing. Genetics. 2008;179:69–81. - PMC - PubMed

MeSH terms