. 2017 Oct 5;8(10):e3081.
doi: 10.1038/cddis.2017.453.

Trehalose ameliorates oxidative stress-mediated mitochondrial dysfunction and ER stress via selective autophagy stimulation and autophagic flux restoration in osteoarthritis development

Affiliations

Trehalose ameliorates oxidative stress-mediated mitochondrial dysfunction and ER stress via selective autophagy stimulation and autophagic flux restoration in osteoarthritis development

Qian Tang et al. Cell Death Dis. .

Abstract

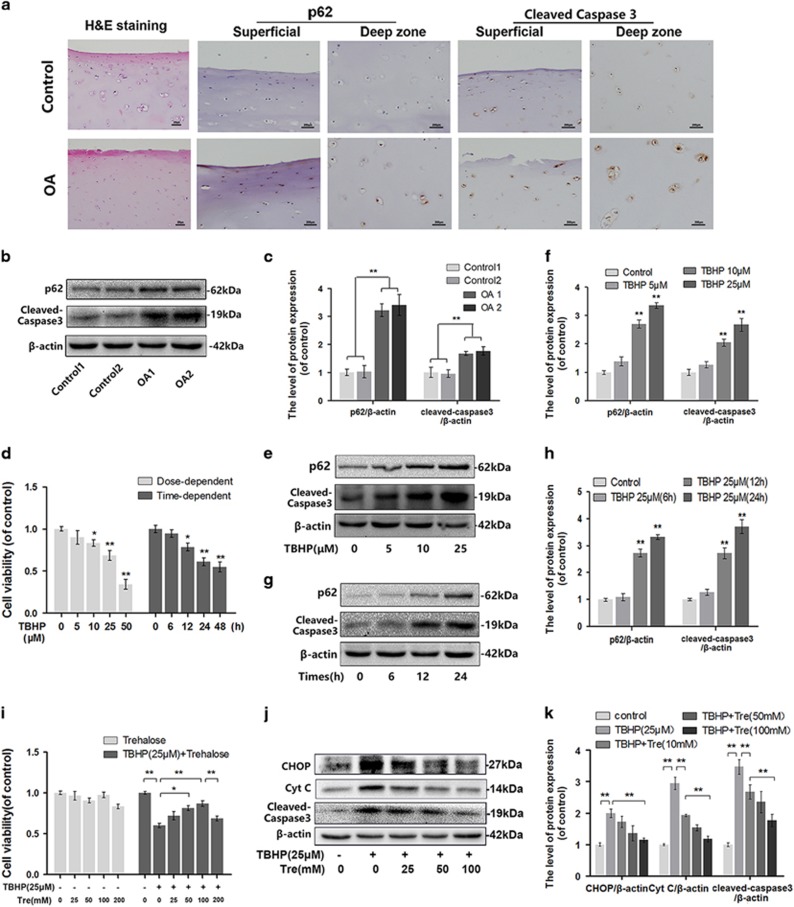
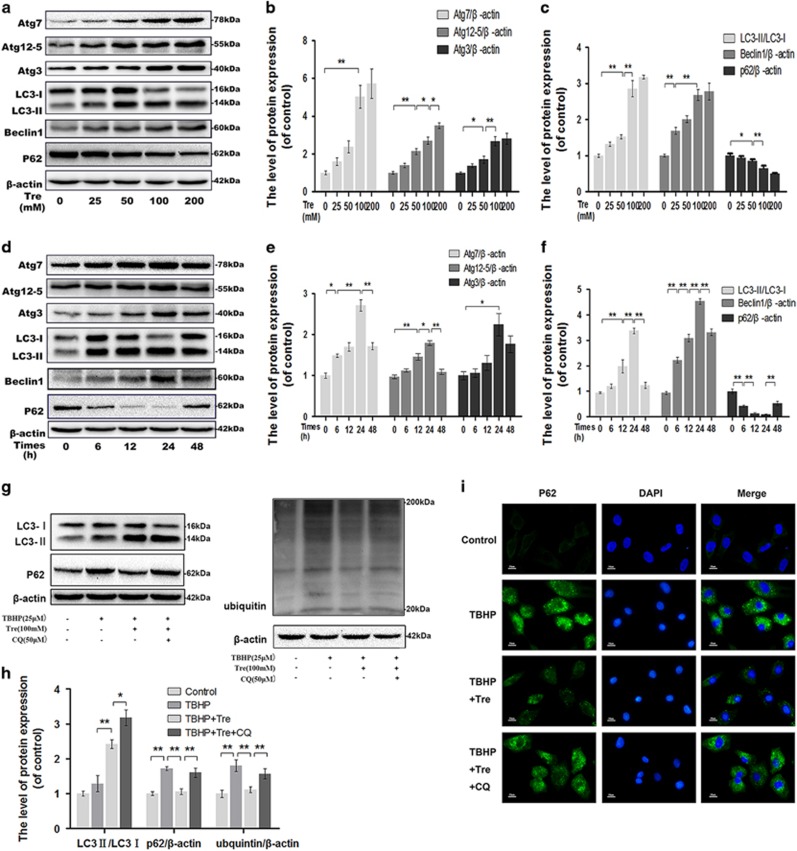
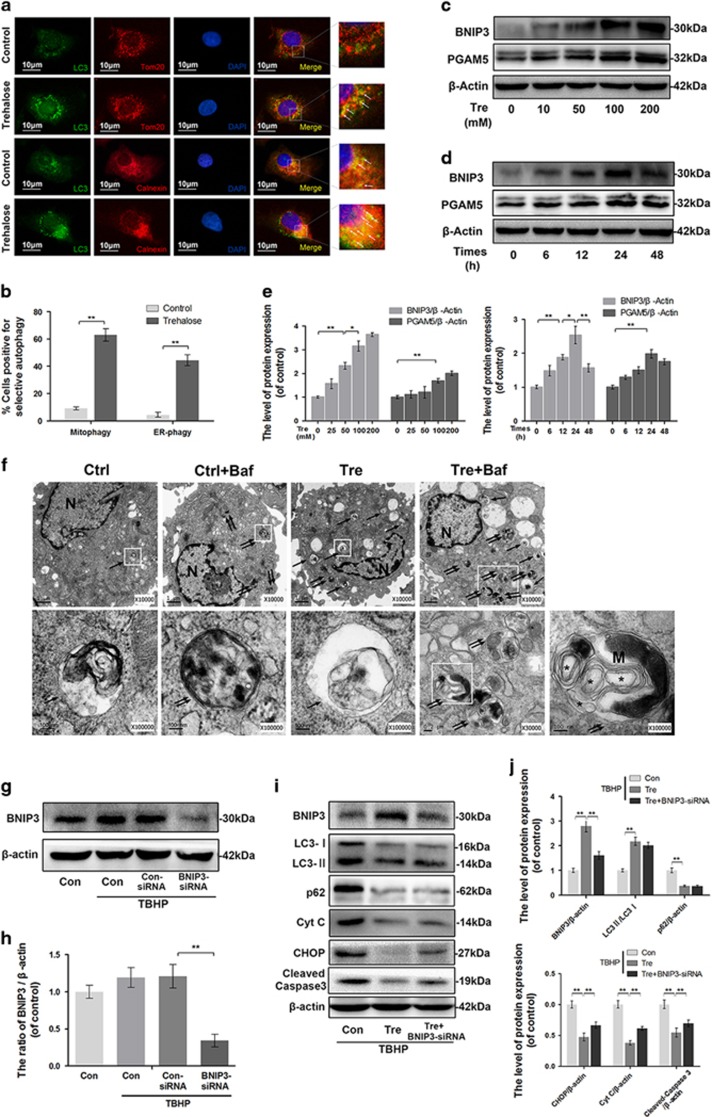
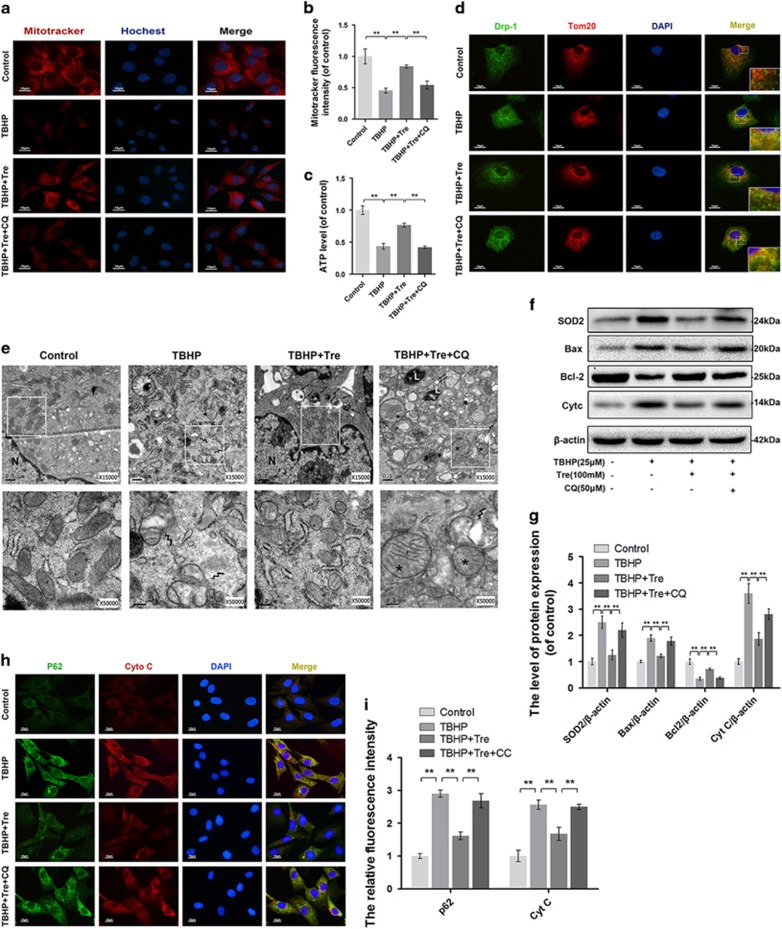
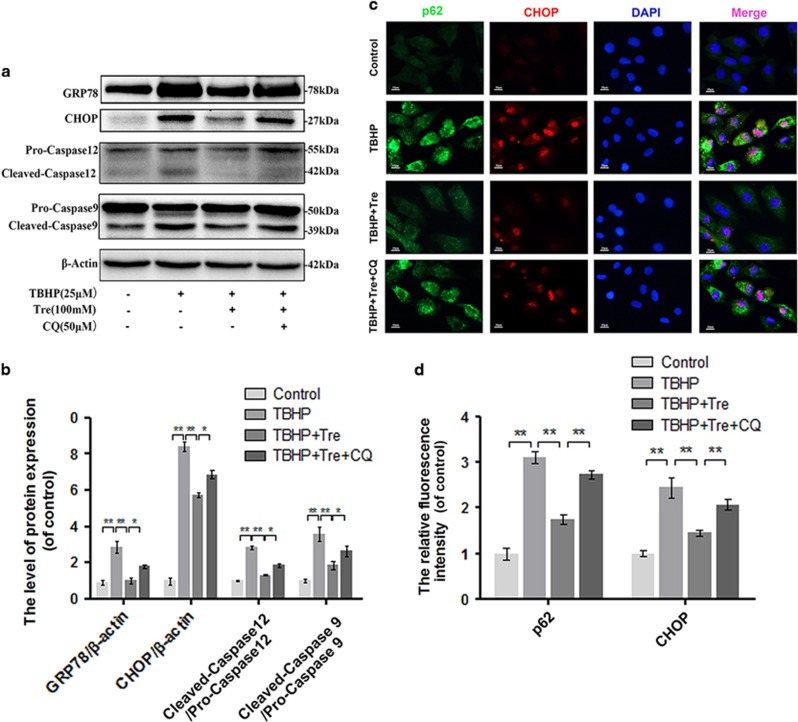
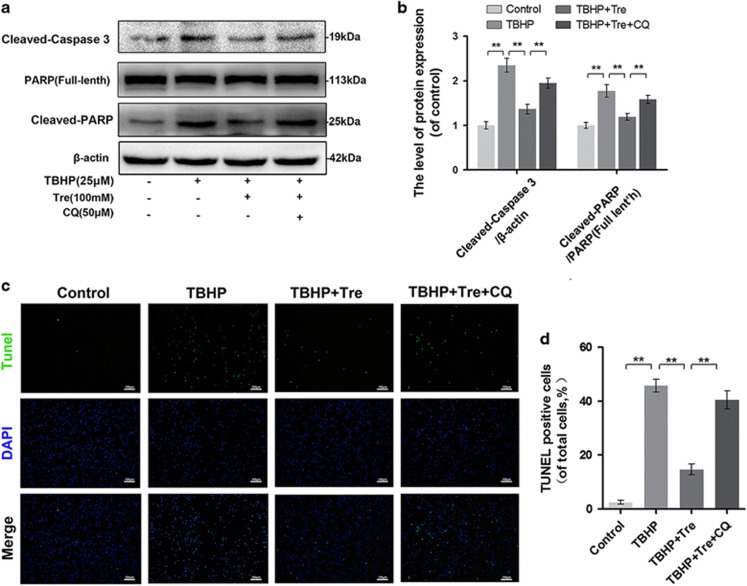
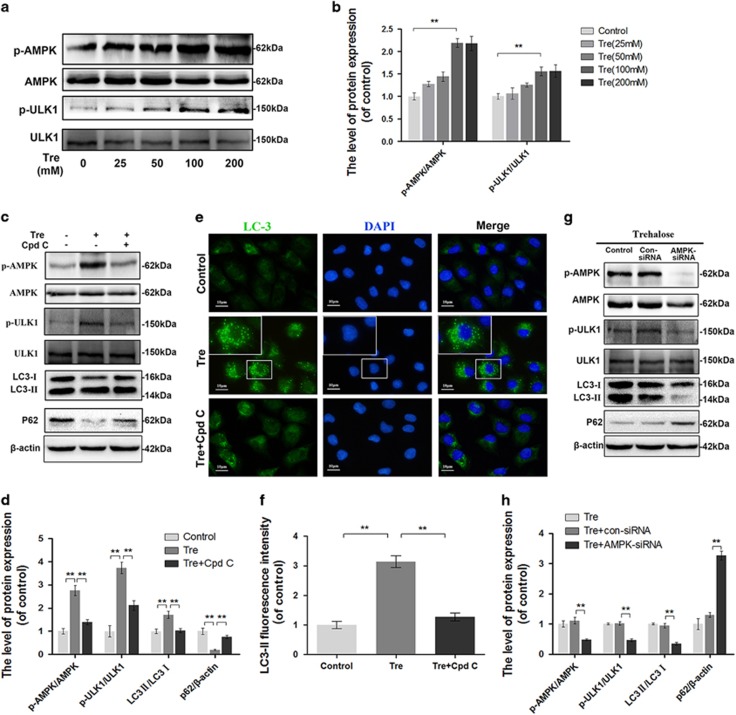
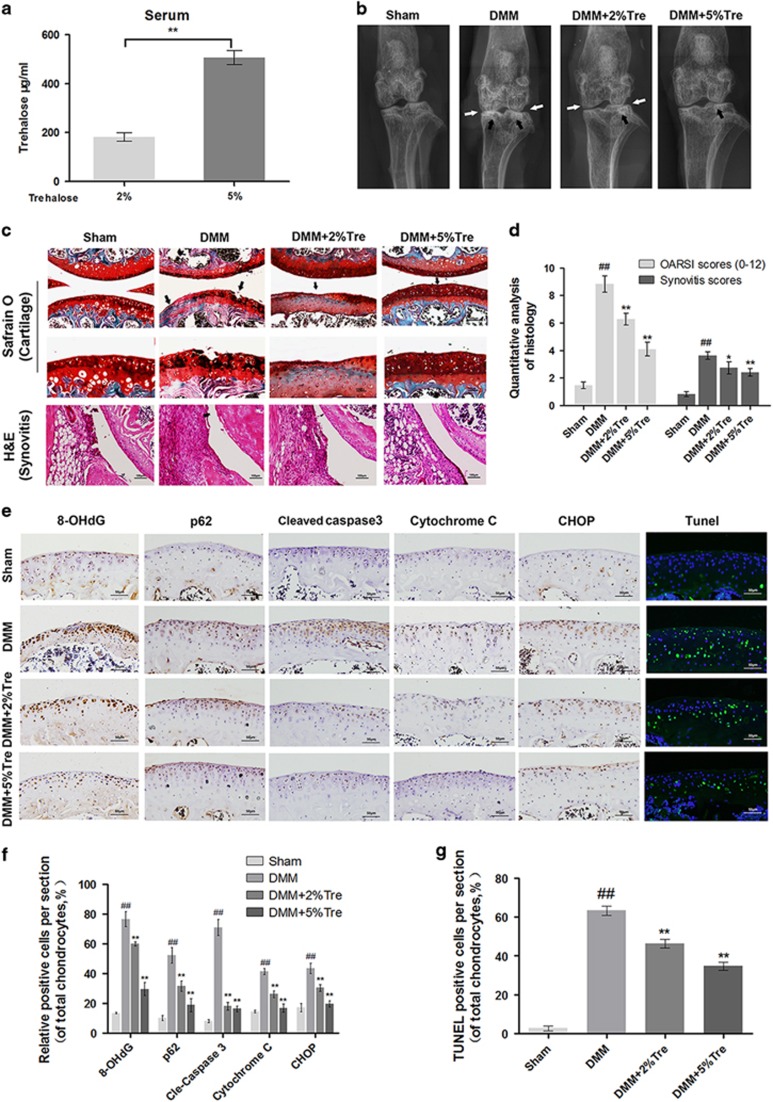
Oxidative stress-related apoptosis and autophagy play crucial roles in the development of osteoarthritis (OA), a progressive cartilage degenerative disease with multifactorial etiologies. Here, we determined autophagic flux changes and apoptosis in human OA and tert-Butyl hydroperoxide (TBHP)-treated chondrocytes. In addition, we explored the potential protective effects of trehalose, a novel Mammalian Target of Rapamycin (mTOR)-independent autophagic inducer, in TBHP-treated mouse chondrocytes and a destabilized medial meniscus (DMM) mouse OA model. We found aberrant p62 accumulation and increased apoptosis in human OA cartilage and chondrocytes. Consistently, p62 and cleaved caspase-3 levels increased in mouse chondrocytes under oxidative stress. Furthermore, trehalose restored oxidative stress-induced autophagic flux disruption and targeted autophagy selectively by activating BCL2 interacting protein 3 (BNIP3) and Phosphoglycerate mutase family member 5 (PGAM5). Trehalose could ameliorate oxidative stress-mediated mitochondrial membrane potential collapse, ATP level decrease, dynamin-related protein 1 (drp-1) translocation into the mitochondria, and the upregulation of proteins involved in mitochondria and endoplasmic reticulum (ER) stress-related apoptosis pathway. In addition, trehalose suppressed the cleavage of caspase 3 and poly(ADP-ribose) polymerase (PARP) and prevented DNA damage under oxidative stress. However, the anti-apoptotic effects of trehalose in TBHP-treated chondrocytes were partially abolished by autophagic flux inhibitor chloroquine and BNIP3- siRNA. The protective effect of trehalose was also found in mouse OA model. Taken together, these results indicate that trehalose has anti-apoptotic effects through the suppression of oxidative stress-induced mitochondrial injury and ER stress which is dependent on the promotion of autophagic flux and the induction of selective autophagy. Thus, trehalose is a promising therapeutic agent for OA.


Conflict of interest statement

The authors declare no conflict of interest.

Figures

Figure 1
Figure 1
Trehalose inhibits TBHP induced apoptosis in chondrocytes. (a) Representative H&E staining and immunohistochemical staining of p62 and cleaved caspase 3 in superficial and deep zones of cartilage from controls and severe osteoarthritis patients. (bar: 200 μm). (b and c) p62 and cleaved caspase 3 levels in chondrocytes derived from osteoarthritis patients and controls. (d) The viability of mouse chondrocytes after TBHP treatment. (e and f) p62 and cleaved caspase 3 levels in mouse chondrocytes treated with different concentrations of TBHP for 24 h. (g and h) p62 and cleaved caspase 3 levels in mouse chondrocytes treated with 25 μM TBHP in different time points; (i) The viability of mouse chondrocytes after trehalose treatment alone or both trehalose and TBHP treatment. (j and k) The levels of CHOP, Cyt C and cleaved caspase 3 in mouse chondrocytes after TBHP treatment alone or both trehalose and TBHP treatment. All data represent mean±S.D. (n=5). **P<0.01, *P<0.05, versus Control
Figure 2
Figure 2
Trehalose induces autophagy in chondrocytes. (a–f) The chondrocytes were treated with 0, 25, 50, 100 or 200 mM trehalose for 24 h or 100 mM trehalose for 0, 6, 12, 24 or 48 h, and protein levels of Atg7, Atg12-5, Atg3, LC3, Beclin-1 and p62 were detected. (g and h) The chondrocytes were treated with TBHP, trehalose or CQ, and the levels of LC3, p62 and ubiquitin were detected. (i) p62 accumulation was examined by immunofluorscence staining (bar: 10 μm). All data represent mean±S.D (n=5). **P<0.01, *P<0.05
Figure 3
Figure 3
Trehalose induces mitophagy and reticulophagy in chondrocytes. (a) Mitophagy and reticulophagy were determined by assessing the co-localization (white arrow) between LC3-positive autophagosomes (green) and Tom20-labeled mitochondria (red) or calnexin-labeled endoplasmic reticulum (red; bar: 10 μm). (b) Quantitation of the number of cells positive for mitophagy and reticulophagy per field according to immunofluorescence staining. (ce) The protein levels of BNIP3 and PGAM5 in chondrocytes treated with trehalose as indicated. (f) TEM images of autophagic vesicles and selective autophagy in chondrocytes treated as indicated (× 10 000/ × 100 000). (Double arrow: autophagosome with double membrane structure; single arrow: autophagolysosome with single membrane structure; ‘M’: mitochondria; Asterisk: parts of ER whorls). (g and h) The protein level of BNIP3 in chondrocytes treated as indicated. (i and j) The protein levels of BNIP3, LC3, p62, Cyt C, CHOP and cleaved caspase 3 in chondrocytes treated as indicated. All data represent mean±S.D. (n=5). **P<0.01, *P<0.05
Figure 4
Figure 4
Trehalose promotes autophagic flux and attenuates mitochondrial dysfunction in chondrocytes. (a and b) Mitochondrial membrane potential was detected using Mitotracker and the nuclei were stained with Hoechst. (bar: 10 μm). (c) ATP content was assessed by ATP-Glo Bioluminometric Cell Viability Assay. (d) Immunofluorescence double-labeled staining for co-localization of Drp-1 with Tom20 (Green: drp-1, red: Tom 20, bar: 10 μm). (e) TEM images of the mitochondria and autophaghic change in chondrocytes (× 15 000 or 50 000). Lightning mark: mitochondrial fission; Asterisk: swollen mitochondira with fractured cristae; Double arrow: autophagosome with double membrane structure; single arrow: autophagolysosome). (f and g) The protein levels of SOD2, Bax, Bcl-2 and Cyt C in chondrocytes treated as indicated. (h and i) Double-labeled immunofluorescence staining of p62 and Cyt C in chondrocytes. (Green: p62, red: Cyt C, bar: 10 μm). All data represent mean±S.D (n=5). **P<0.01
Figure 5
Figure 5
Trehalose relieves oxidative stress induced ER stress in chondrocytes. (a and b) The protein levels of GRP78, CHOP, Caspase 12 and Caspase 9 in chondrocytes were detected. (c and d) Double immunofluorescence staining of p62 and CHOP in chondrocytes. (Green: p62, red: CHOP, bar: 10 μm). All data represent mean±S.D. (n=5). **P<0.01, *P<0.05
Figure 6
Figure 6
Trehalose inhibits TBHP induced apoptosis in chondrocytes. (a and b) The protein levels of cleaved caspase 3, PARP and cleaved PARP in chondrocytes treated as indicated were detected. (c and d) TUNEL assay of apoptotic chondrocytes (bar: 100 μm). All data represent mean±S.D (n=5). **P<0.01
Figure 7
Figure 7
Trehalose promotes autophagic flux via activating AMPK-ULK1 pathway (a and b) The protein levels of p-AMPK, AMPK, p-ULK1 and ULK1 in chondrocytes treated with 0, 25, 50, 100 or 200 μM Trehalose for 24 h. (c and d) The protein levels of p-AMPK, AMPK, p-ULK1, ULK1, LC3 and p62 in chondrocytes treated as indicated. (e and f) Immunofluorescence staining of LC3 (green) and the nucleus (blue). (bar: 10 μm). (g and h) The protein levels of p-AMPK, AMPK, p-ULK1, ULK1, LC3 and p62 in chondrocytes treated with trehalose alone, trehalose combined with con-siRNA, or trehalose combined with AMPK-siRNA. All data represent mean±S.D. (n=5). **P<0.01
Figure 8
Figure 8
Trehalose ameliorates OA in mouse DMM model. (a) Serum levels of trehalose in DMM mice treated with 2% or 5% trehalose. (b) Digital X-ray images of knee joints in four groups. Narrowing of joint space was indicated by white arrows, and the calcification of cartilage surface was indicated by black arrows. (c) Representative S-O staining of cartilage and H&E staining of synovitis in four groups at 8 week post-surgery (bar: 100 or 50 μm). (d) OARIS scores of cartilage and the scores of synovitis in four groups. (e) Immunohistochemical staining of 8-OHdG, p62, cleaved caspase 3, cytochrome C and CHOP and TUNEL staining in the mouse cartilage (bar: 50 μm). (f and g) Quantitation of immunohistochemical and TUNEL staining. All data represent mean±S.D. (n=5). ##P<0.01, versus Sham, **P<0.01, *P<0.05, versus DMM

References

    1. Glyn-Jones S, Palmer AJ, Agricola R, Price AJ, Vincent TL, Weinans H et al. Osteoarthritis. Lancet 2015; 386: 376–387. - PubMed
    1. Karsdal MA, Michaelis M, Ladel C, Siebuhr AS, Bihlet AR, Andersen JR et al. Disease-modifying treatments for osteoarthritis (DMOADs) of the knee and hip: lessons learned from failures and opportunities for the future. Osteoarthritis Cartilage 2016; 24: 2013–2021. - PubMed
    1. Charlier E, Relic B, Deroyer C, Malaise O, Neuville S, Collee J et al. Insights on molecular mechanisms of chondrocytes death in osteoarthritis. Int J Mol Sci 2016; 17: E2146. - PMC - PubMed
    1. Lepetsos P, Papavassiliou AG. ROS/oxidative stress signaling in osteoarthritis. Biochim Biophys Acta 2016; 1862: 576–591. - PubMed
    1. Li D, Xie G, Wang W. Reactive oxygen species: the 2-edged sword of osteoarthritis. Am J Med Sci 2012; 344: 486–490. - PubMed

Publication types

MeSH terms